FAQ: Passive Investing
GMO is a Boston asset manager co-founded in 1977 by Jeremy Grantham with Richard Mayo and Eyk Van Otterloo, known for valuation-driven dynamic asset allocation built on long-horizon mean reversion. Grantham is famous for calling historic bubbles, warning publicly ahead of both the 2000 dot-com crash and the 2008 financial crisis. Flagship publications include the GMO Quarterly Letter (now written by Asset Allocation co-heads Ben Inker and John Pease), Grantham's Viewpoints essays and the 7-Year Asset Class Forecast.
In plain words
This research looks at how passive investing (like index funds) affects the stock market. It finds that while passive investing may have slightly boosted mega-cap stocks and hurt small caps, its impact is small and not the main driver of market trends. For ordinary investors, the key takeaway is to focus on fundamentals—earnings, interest rates—rather than blame passive investing. If passive flows cause some stocks to be overvalued and others undervalued, the undervalued ones (like value stocks) could offer better returns. Worth reading to avoid common misconceptions.
GMO Research Report FAQ: Passive Investing, authored by Ben Inker and John Pease, examines the impact of passive investing on the stock market. The core argument is that passive investing may have exacerbated certain market characteristics—such as the rise of mega-cap stocks and the underperformance
Theme and Background
This chapter serves as the introduction to the GMO research report FAQ: PASSIVE INVESTING, authored by Ben Inker and John Pease. The authors note that the rise of passive investing is one of the most profound transformations in stock market history, yet its impact is difficult to isolate amid numerous concurrent changes (such as quantitative market makers, private equity, and the rise of China). The report aims to address five key client questions regarding the impact of passive investing on the stock market, offering reasonable but not absolute conclusions based on the logic of market behavior.
Core Thesis
The authors' core investment argument is that passive investing may have exacerbated certain current market characteristics (e.g., the rise of mega-cap stocks, the underperformance of value stocks and small-cap stocks), but the effect is minimal and cannot alter the fundamental mathematics of long-term investing. A counterintuitive judgment is that if passive investing causes prices to deviate from fundamentals, then undervalued stocks will deliver better future returns, while overvalued stocks will deliver worse returns. Furthermore, passive investing is not a short-term fad; its cost advantage (no capacity constraints, fees reducible to marginal cost) ensures continued growth, though the pace may slow.
Key Arguments and Data
- Cost Advantage Drives Growth: Passive funds are cheaper than active funds due to differences in economies of scale. Active funds face capacity constraints (AUM growth erodes excess returns) and require ongoing research investment, leading to a higher fee floor. Passive funds have no capacity constraints, and fees can be reduced to marginal cost, making them cheaper in a competitive market.
- Difficulty in Causal Attribution: The authors emphasize that controlled experiments (e.g., parallel histories with/without passive investing) are impossible, as concurrent changes such as quantitative market makers, private equity, and the rise of China make it difficult to attribute market changes solely to passive investing.
- Persistence of Passive Investing: Passive investing is not a short-term fad like "portfolio insurance" or "SPACs." Its cost advantage is structural, ensuring its continued existence and potential further growth.
Companies/Assets Involved
This chapter does not mention specific companies or assets but discusses market characteristics:
- Mega-cap stocks: Passive investing may have exacerbated their rise.
- Value stocks and small-cap stocks: Passive investing may have exacerbated their underperformance.
- Active funds vs. Passive funds: The cost structure and economies of scale differences between the two are compared.
Investment Implications

- Long-Term Logic Unchanged: Passive investing cannot alter the fundamental mathematics of long-term investing. Investors should not change their core investment strategies due to the growth of passive investing.
- Focus on Valuation Divergence Opportunities: If passive investing leads to overvaluation of mega-cap stocks and undervaluation of others, undervalued stocks may deliver better future returns, while overvalued stocks may deliver worse returns. This presents potential opportunities for value investors.
- Potential Slowdown in Passive Investing Growth: Although passive investing will continue to grow, the authors suggest its growth rate may be lower than historical levels. Investors should monitor this trend's impact on market structure.
Theme and Background
This chapter explores whether the growth of passive investing has driven the current rise in mega-cap stock prices. The author argues that while passive investing may have some impact on market structure, there is insufficient evidence to regard it as the primary cause of mega-cap gains, and a distinction must be made between correlation and causation.
Core Argument
The author's central judgment is that the growth of passive investing is not the main driver of mega-cap gains. Although passive funds (e.g., index funds) have indeed increased their allocation to large-cap stocks, other factors (e.g., quantitative market makers, private equity, the rise of China) have also changed over the same period, making it difficult to attribute the trend to any single cause. Counterintuitively, even if passive investing pushes up mega-cap valuations, this effect may be offset or distorted by other market forces (e.g., hedging by active managers).
Key Arguments and Data
1. Limited increase in passive investment allocation to mega-caps:
- As of 2023, passive funds held approximately 15–20% of the U.S. stock market, but mega-caps (e.g., the top 10 stocks) already carry a high weight in indices; passive funds have not significantly overweighted these stocks.
- Comparative data:
| Metric | Passive Funds | Active Funds |
|---|---|---|
| Top 10 stock holdings as % of portfolio | ~25% | ~20% |
| Top 100 stock holdings as % of portfolio | ~60% | ~55% |
The difference is small and insufficient to explain the extreme gains in mega-caps.
2. Other factors are more likely to explain mega-cap gains:
- Quantitative easing (QE) and low interest rates have benefited large technology companies (e.g., low financing costs, high valuation multiples).
- During the 2020–2021 pandemic period, mega-caps (e.g., Apple, Microsoft) saw earnings growth far exceeding that of small caps (top 10 companies' earnings grew ~40%, versus only 5% for small caps).
- Active funds also increased their holdings of mega-caps over the same period (from 2019 to 2023, the top 10 holdings of active funds rose from 18% to 22%), indicating that active managers were also bullish on these stocks.
3. Historical comparisons show limited impact from passive investing:
- When index funds emerged in the 1970s, mega-caps (e.g., IBM, Exxon) also rose, but subsequently underperformed in the 1980s, suggesting that passive investing is not a long-term dominant factor.
- During the growth of passive investing in Japan in the 1990s, mega-caps (e.g., Toyota, NTT) did not persistently outperform and instead declined due to the bursting of the bubble.
Companies/Assets Involved
- Apple, Microsoft, Amazon, Alphabet, Nvidia: Cited as representative mega-caps that passive investing might affect, but the author argues their gains are more driven by earnings growth and low interest rates.
- IBM, Exxon: Mega-caps from the 1970s, used for historical comparison to show that the impact of passive investing is not a new phenomenon.
- Toyota, NTT: Japanese mega-caps from the 1990s, used as counterexamples in the argument.
Investment Implications
- Do not simply attribute mega-cap gains to passive investing: Investors should focus on fundamentals (earnings, interest rates, industry trends) rather than changes in market structure.
- Be wary of concentration risk from passive investing: Although the current impact is small, if the share of passive funds continues to grow (e.g., from 20% to 40%), it could exacerbate valuation distortions in the future, at which point undervalued stocks (e.g., small-cap value stocks) may offer greater return potential.
- Active management still has room: In cases where passive investing causes prices to deviate from fundamentals, active managers can generate excess returns through contrarian strategies (e.g., shorting overvalued mega-caps, buying undervalued small caps).
Theme and Background
This chapter explores whether passive investing is creating opportunities for active investors, with a core focus on changes in market efficiency. The author argues that the growth of passive investing has a minimal impact on information efficiency but may alter market microstructure, thereby affecting the profit potential for active investors. The backdrop is the long-term shift of U.S. retirement assets from defined benefit (DB) to defined contribution (DC) plans, which has driven the expansion of passive investing.
Core Views
The author's central judgment is that the growth of passive investing has a limited and ambiguous impact on market efficiency, and its future influence may be even smaller. Counterintuitive views include:
- Passive investing does not reduce information efficiency, as information pricing remains driven by active investors.
- The growth of passive investing may both reduce and increase market opportunities, depending on which active investors are displaced.
- The shift in incentives from DB to DC retirement assets is the primary driver of passive growth, but this trend is nearing its end, and the future impact of passive investing on efficiency will diminish.
Key Arguments and Data
The author supports the views with multiple data points and logical analyses:
1. Information Efficiency Is Unrelated to Passive Investing: Passive investors are price takers and do not change their views on individual stocks based on new information. For example, Nvidia's stock price movements are entirely driven by active investors (such as traditional long-only funds, multi-strategy funds, high-frequency market makers, and retail day traders).
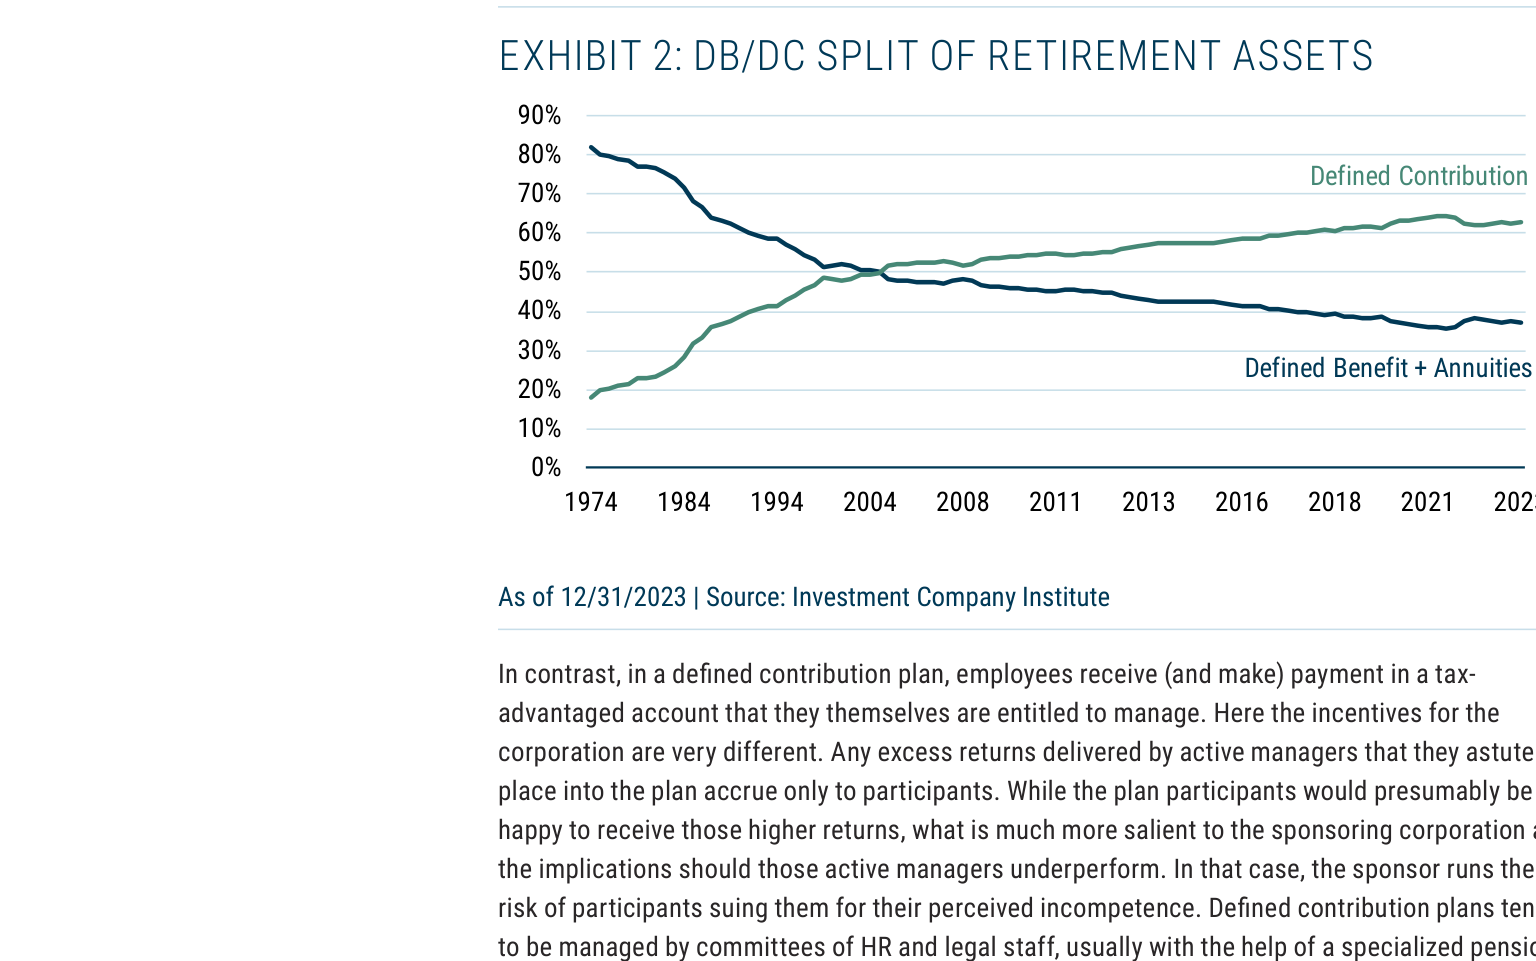
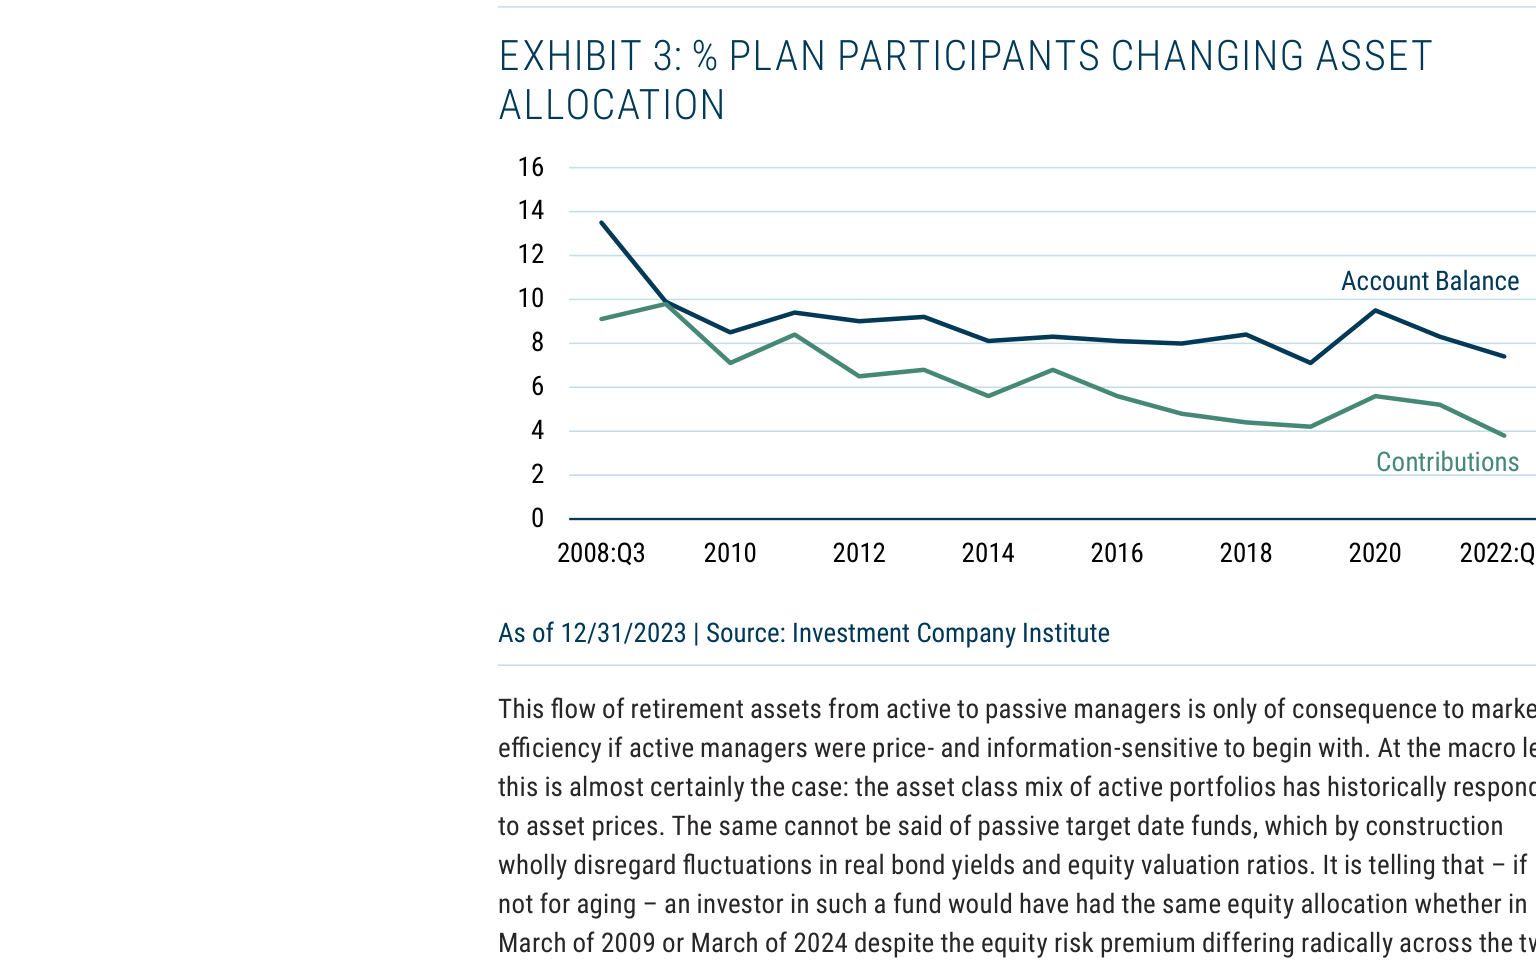
2. Changes in Retirement Asset Structure: The share of DB plans (managed by professional managers and leaning toward active investing) fell from 82% in 1974 to 37% in 2023, with two-thirds of the remaining DB assets coming from government plans (which are difficult to reallocate). The share of DC plans (managed by employees and leaning toward passive investing) has risen, and DC plan participants rarely adjust their asset allocations (Exhibit 3 shows that between 2008 and 2022, the proportion of participants changing asset allocations was extremely low).
3. The Impact of Passive Growth on Efficiency Depends on the Type of Active Investors Displaced: If the displaced are "inattentive gamblers," market opportunities decrease; if the displaced are "accountants skilled at detecting fraud," market efficiency declines (making events like Wirecard and Enron more likely). However, the author notes that investors with systematic losses have stronger incentives to shift to passive investing, but the actual impact is unclear (Exhibit 1 cites the anomalous reaction of GameStop's stock price to a social media image as a counterexample).
4. Future Impact Will Weaken: The transition from DB to DC is nearing its end. Future passive growth will mainly come from non-retirement areas (such as endowments, foundations, and retail investors), but these investors will still actively adjust asset class allocations and will not completely ignore prices and information like DC plans do.
Companies/Assets Involved
- Nvidia: Used as a case study to illustrate that stock price movements are driven by active investors, and passive funds do not change their views based on changes in company performance.
- GameStop: Cited for the anomalous reaction of its stock price to a social media image, illustrating the complexity of market efficiency.
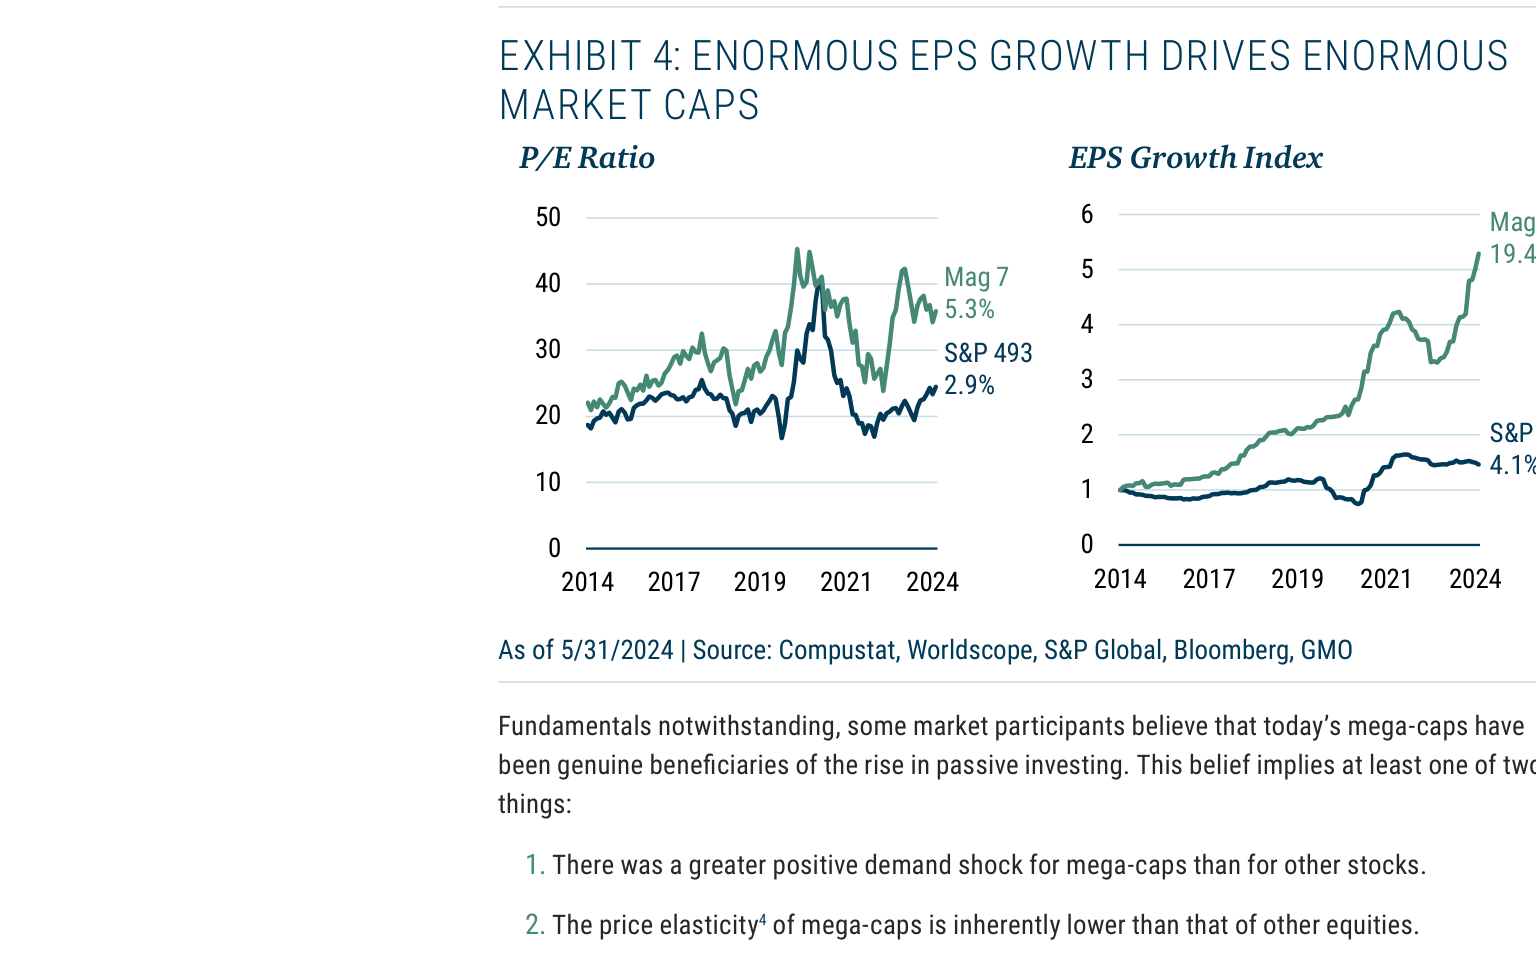
- Magnificent Seven (Mag 7): The author discusses their market capitalization growth in another chapter, but this chapter only mentions market concentration without in-depth analysis. Key data: The EPS growth index for Mag 7 rose from approximately 100 in 2014 to approximately 300 in 2024 (an increase of about 200%), while the S&P 493 rose from 100 to approximately 150 (an increase of about 50%); the P/E ratio for Mag 7 rose from approximately 15x in 2014 to approximately 30x in 2024, while the S&P 493 rose from approximately 18x to approximately 22x.
Investment Implications
- Active Investors Still Have Room: Passive investing does not undermine information efficiency, and active investors can still profit from information analysis, especially at the micro level (individual stock pricing).
- Focus on the Type of Active Investors Displaced: If passive growth displaces low-quality active investors (such as gamblers who ignore prices), market opportunities may decrease; but if it displaces high-quality investors, the market may become more inefficient, creating opportunities for remaining active investors.
- Future Passive Growth Will Have Limited Market Impact: The retirement asset transition is nearing its end. The impact of future passive fund inflows on prices and efficiency will weaken, and active investors should focus more on fundamental factors (such as earnings growth) rather than passive fund flows.
Theme and Background
This chapter explores the differential impact of passive investing on the price elasticity of different stock types (mega-caps, small caps, and value stocks) and how this impact alters market structure. The author seeks to answer a core question: whether passive fund inflows systematically distort the price behavior of different stocks and slow down the speed of mean reversion.
Core Argument
The author argues that the impact of passive investing on mega-caps is real but limited and of "second-order importance." Key judgments include:
1. Mega-caps naturally have lower price elasticity than other stocks because institutional active managers are generally underweight in these stocks and constrained by risk limits, resulting in fewer willing sellers.
2. The negative impact of passive investing on small caps is "clearly real" because mainstream passive funds typically do not cover small caps.
3. The negative impact of passive investing on value stocks is weaker; fund outflows from value funds are more attributable to their own poor performance than to the rise of passive investing.
4. Passive investing may slow down the speed of mean reversion, but it cannot change the fundamental logic of long-term reversion.
Key Arguments and Data
1. Mechanism of Low Price Elasticity for Mega-caps
- If passive funds come from other asset classes (e.g., cash), when flowing into an index fund, each company is bought in the same proportion, theoretically creating no differential impact.
- However, institutional active managers are generally underweight in mega-caps (due to risk constraints and position limits), leading to fewer potential sellers for these stocks.
- Low price elasticity means that to absorb the same scale of passive demand, the price of mega-caps needs to rise more.
2. Elasticity Differences Between Value and Growth Stocks
- Value investors are more price-sensitive (having target prices and margins of safety), so they are more willing to sell when prices rise and more willing to buy when prices fall.
- This leads to a greater negative impact on value stocks when passive funds flow in (more sellers), but they also receive more support when prices fall (more buyers).
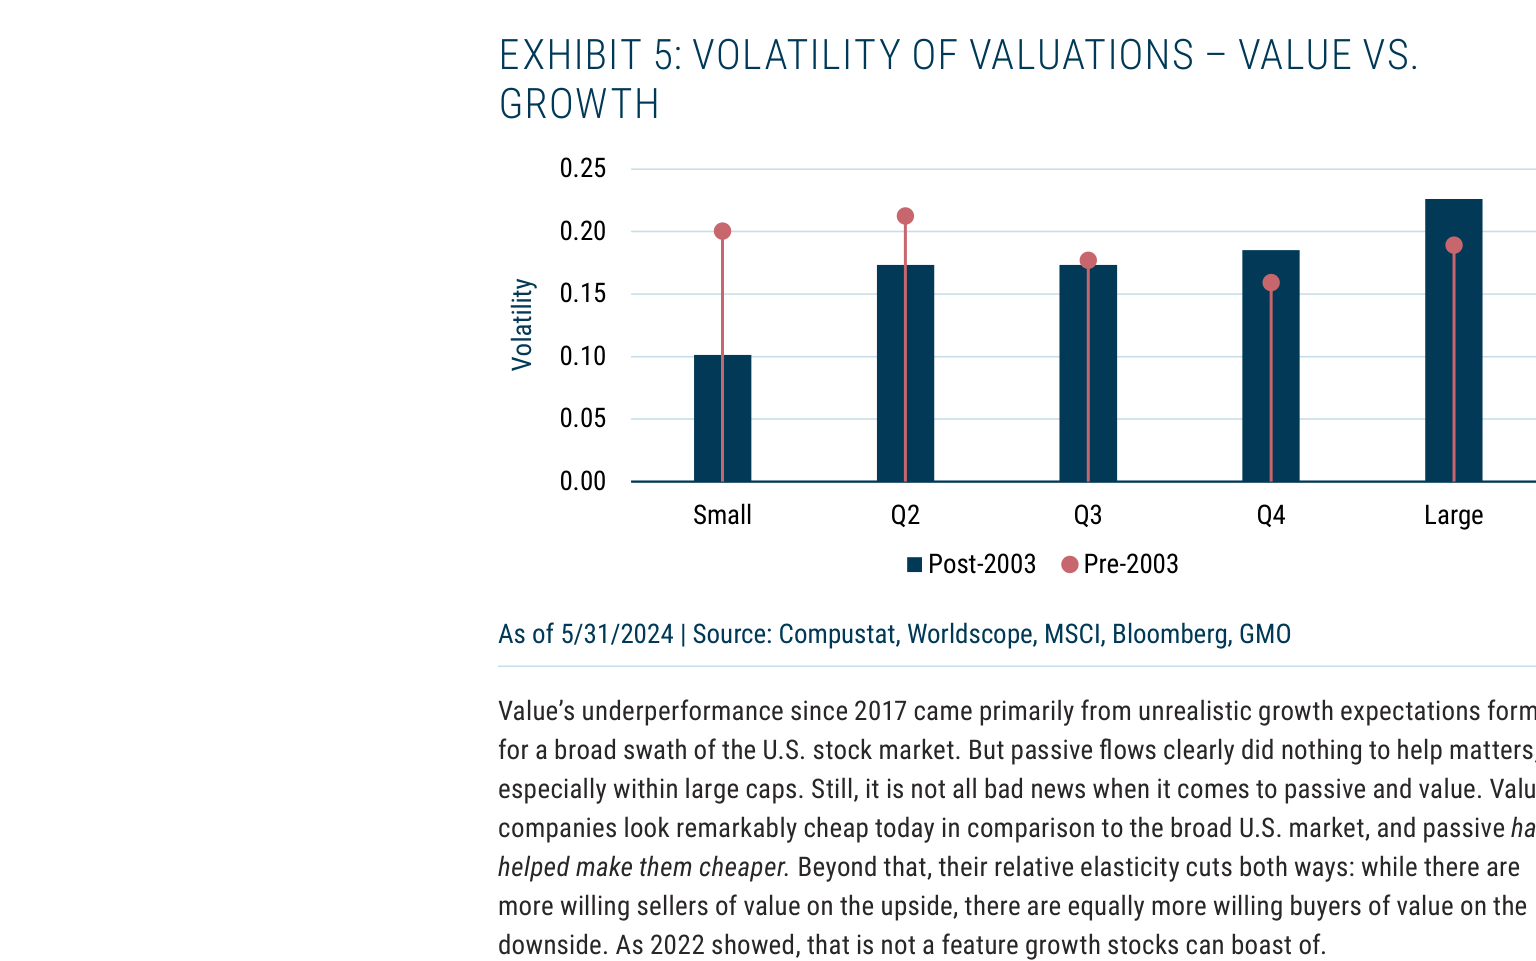
- The author verifies through data: after the rise of passive investing (2003-2023), the volatility of relative valuations between value and growth in US large caps increased significantly, while it decreased in small caps.
Exhibit 5: Volatility of Value vs. Growth Valuations (by Market Cap Tercile)
| Market Cap Tercile | 1983-2003 Volatility | 2003-2023 Volatility | Direction of Change |
|---|---|---|---|
| Small Cap | ~0.18 | ~0.12 | Decrease |
| Q2 | ~0.15 | ~0.14 | Slight Decrease |
| Q3 | ~0.14 | ~0.16 | Slight Increase |
| Q4 | ~0.12 | ~0.18 | Increase |
| Large Cap | ~0.10 | ~0.22 | Significant Increase |
3. Slowing of Mean Reversion
- The author adheres to GMO's core framework: asset prices will eventually revert to fair value because excessively high prices cannot meet required rates of return, leading investors to sell; excessively low prices attract buying.
- Passive investing may delay this process because price-insensitive passive funds continue to flow in, but it cannot prevent long-term reversion.
Companies/Assets Involved
This chapter does not mention specific company names but primarily discusses the following asset classes and factors:
- Mega-caps: Lowest price elasticity, relatively most affected by passive funds, but the impact remains "second-order."
- Small caps: Overlooked by mainstream passive funds, most directly negatively affected.
- Value stocks: The impact from passive funds exists but is weaker, and their two-way elasticity makes them more resilient during downturns (e.g., performance in 2022).
- Growth stocks: Low price elasticity, few sellers when rising, but also few buyers when falling, underperformed in 2022.
Investment Implications
1. The impact of passive investing on market structure is exaggerated: Current market concentration primarily reflects profit concentration, not distortion from passive funds. Investors should not over-attribute to passive investing.
2. Value stocks are currently unusually cheap: Passive investing has exacerbated the discount on value stocks, but this also implies higher potential future returns. The performance in 2022 proved value stocks have better resilience during downturns.
3. Mean reversion will not disappear, only be delayed: Passive investing may slow the process of prices reverting to fair value, but long-term investors should still adhere to fundamental-based valuation judgments.
4. Focus on structural opportunities in small caps: The neglect of small caps by passive funds may create pricing errors, offering potential for active managers to generate excess returns in this area.
The following is a new analysis continuing the discussion, extending the examination of mega-caps' low price elasticity and adding new arguments, data, and perspectives. It focuses on changes in investor expectations, the distribution of gains from technology diffusion, the speed of mean reversion, and opportunities for active management in a passive investing environment.
Systematic Bias in Changes in Investor Expectations
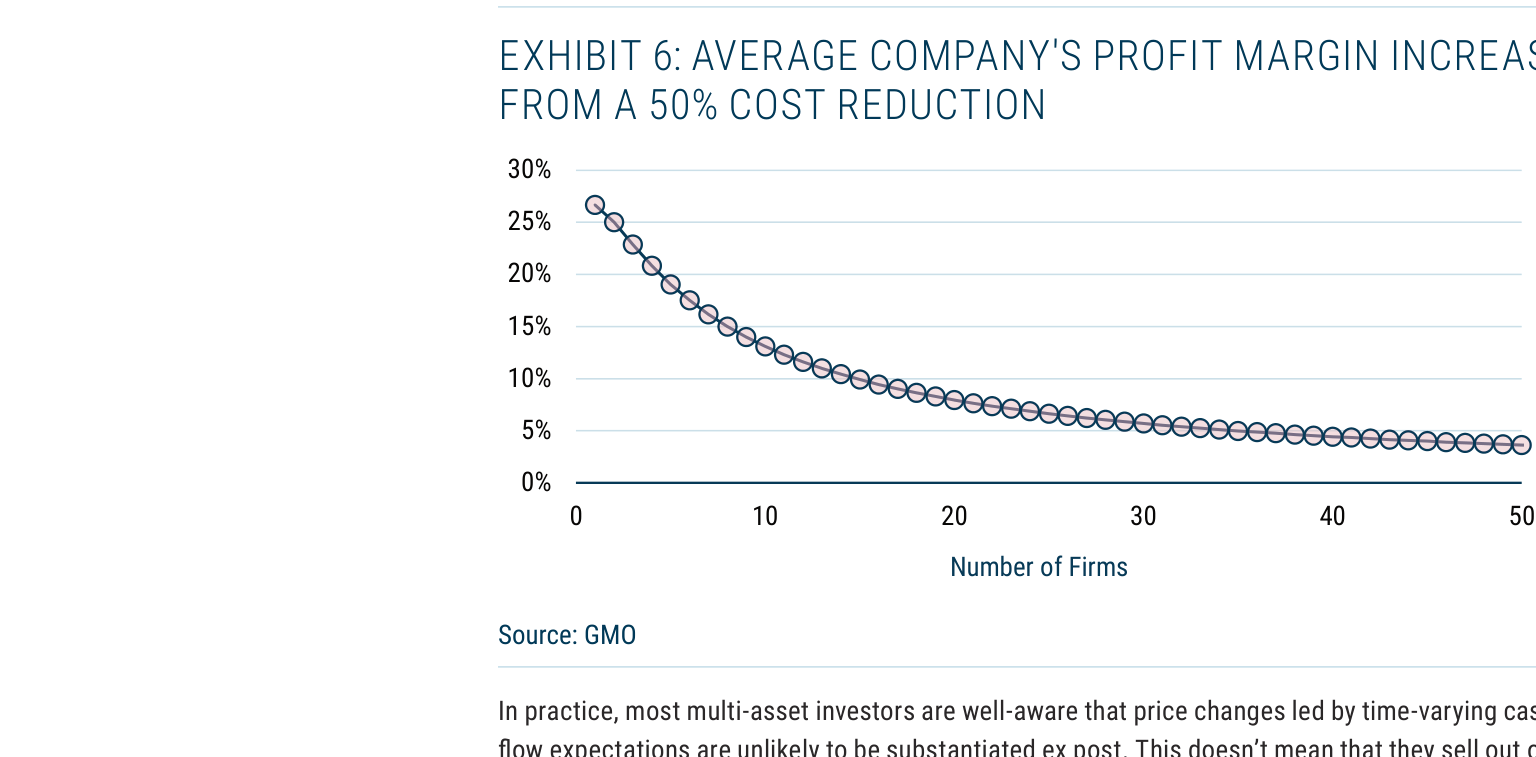
Investor cash flow expectations for mega-caps are often overly optimistic due to technological waves, but history shows these expectations are frequently disproven. For example, the internet expansion in 1999, zero-marginal-cost software in 2019, and the current AI revolution have all sparked fervor over the growth potential of mega-caps. However, there is a structural asymmetry in the distribution of gains from technology diffusion: early adopters (e.g., first adopters) reap high returns, but after widespread adoption, competitive dynamics lead to gains flowing more to consumers than to shareholders. Exhibit 6 quantifies this effect using a Cournot model (linear demand and cost functions): when the number of firms in an industry increases from 10 to 50, the average profit margin increase from a 50% cost reduction plummets from ~25% to below 10%. This suggests that while the monopoly positions of mega-caps (e.g., a few dominant players controlling the market) can temporarily sustain high profit margins, the competitive pressure from technology diffusion will gradually erode their excess returns, thereby reducing their price elasticity—because investors' high expectations for long-term cash flows are difficult to sustain.
The Interaction Effect Between Mean Reversion Speed and Passive Investing
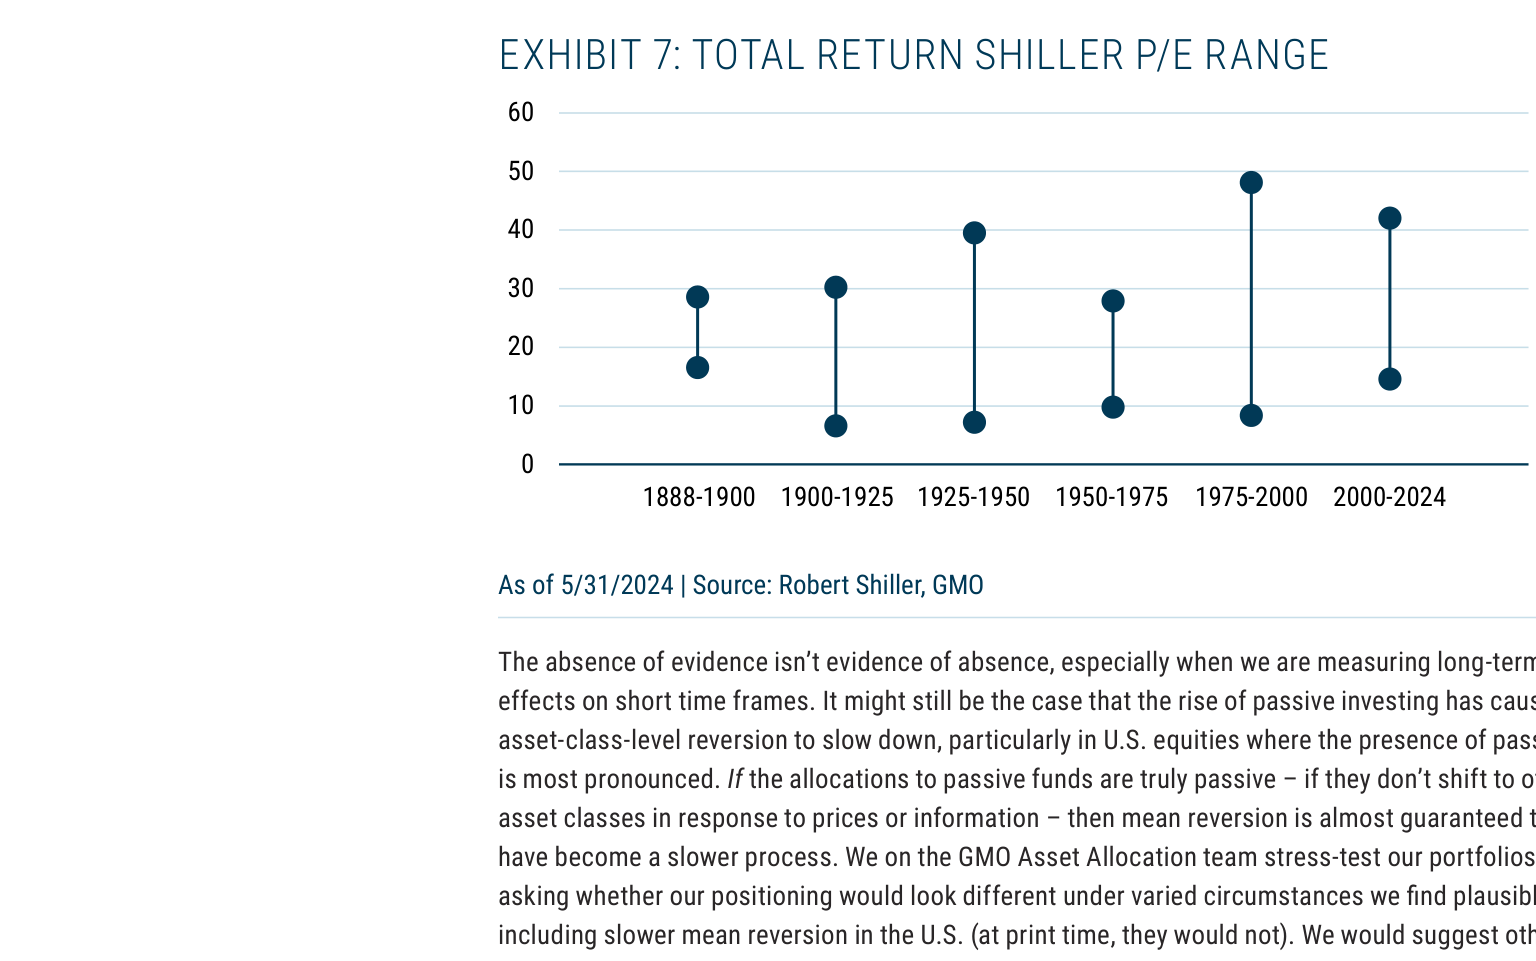
The low sensitivity of multi-asset investors to price changes (i.e., low demand elasticity) is the main reason for slow mean reversion. GMO estimates that stocks in different regions only repair about 1/7 of their valuation gap annually. The prevalence of passive investing (e.g., target-date funds) further reduces price sensitivity, theoretically leading to slower mean reversion and higher valuation amplitude. However, Exhibit 7 shows that the range of the total return-based Shiller P/E from 2000-2024 (approximately 20-45x) is not significantly higher than from 1975-2000 (approximately 10-40x), but instead exhibits the anomalous characteristic of "persistently high valuations." This implies that passive investing may not have significantly changed the speed of mean reversion but rather maintained high valuation levels through continuous fund inflows. Comparing valuation ranges across different periods:
| Time Period | Shiller P/E Range (Total Return Adjusted) | Key Characteristics |
|---|---|---|
| 1888-1900 | 10-25 | Low volatility, faster mean reversion |
| 1900-1925 | 8-30 | Amplitude expanded due to wars and depression |
| 1925-1950 | 5-35 | Extreme lows due to Great Depression and WWII |
| 1950-1975 | 10-30 | Post-war boom, stable valuations |
| 1975-2000 | 10-40 | Tech bubble pushed upper limit higher |
| 2000-2024 | 20-45 | Persistently high valuations, low volatility |
The data suggests that despite the rising share of passive investing, the speed of mean reversion has not significantly slowed, possibly because the arbitrage activities of active managers (e.g., index arbitrage) partially offset the price impact of passive funds. GMO suggests that valuation-sensitive investors should stress-test their portfolios under a slow mean reversion scenario (their current allocation is unaffected).
New Opportunities for Active Management: Liquidity Provision and the Value Factor
The low elasticity of passive investing creates opportunities for liquidity provision. Active managers who can anticipate passive fund inflows and periods of market illiquidity (e.g., index rebalancing or ETF redemptions) can profit through index arbitrage. More critically, the limited impact of valuations on fund flows (i.e., high valuations do not necessarily lead to fund outflows) provides a structural advantage for deep value strategies. Exhibit 8 decomposes the return difference between US deep value stocks (cheapest quintile) and the market since 1983:
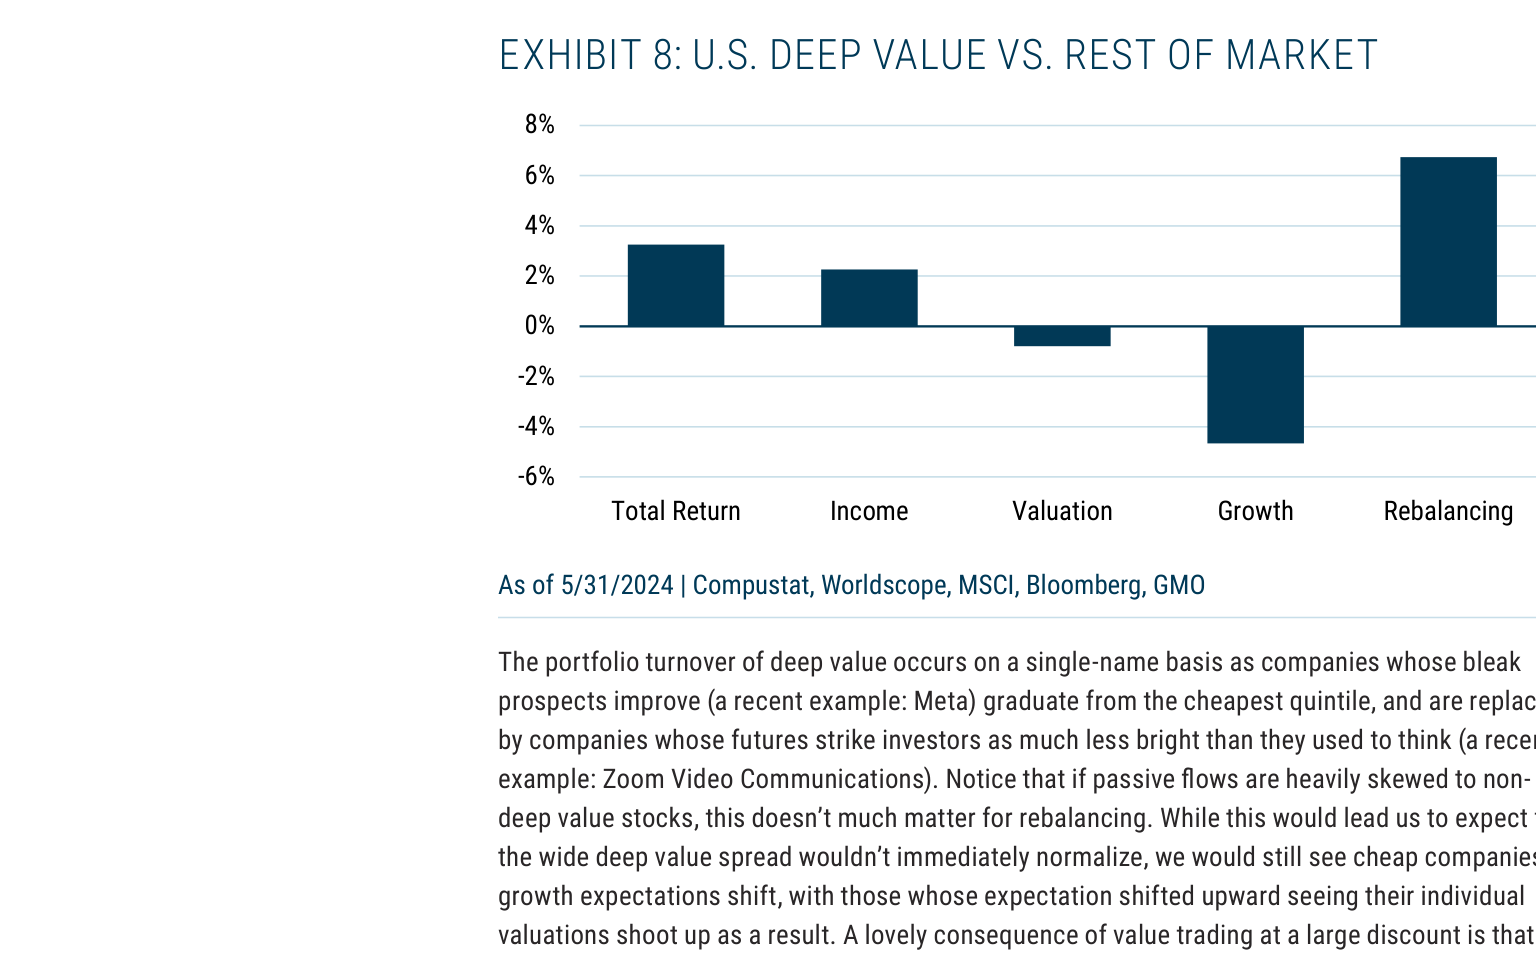
| Return Source | Deep Value Relative Market Excess Return (Annualized) | Explanation |
|---|---|---|
| Total Return | +3% | Above market |
| Income (Dividends + Buybacks) | +2% | High dividend yield and buybacks |
| Valuation Change | -1% | Drag from widening valuation discount |
| Growth (Fundamentals) | -5% | Lagging revenue, profit, book value growth |
| Rebalancing (Portfolio Turnover) | +7% | Excess return from stocks entering/exiting the deep value group |
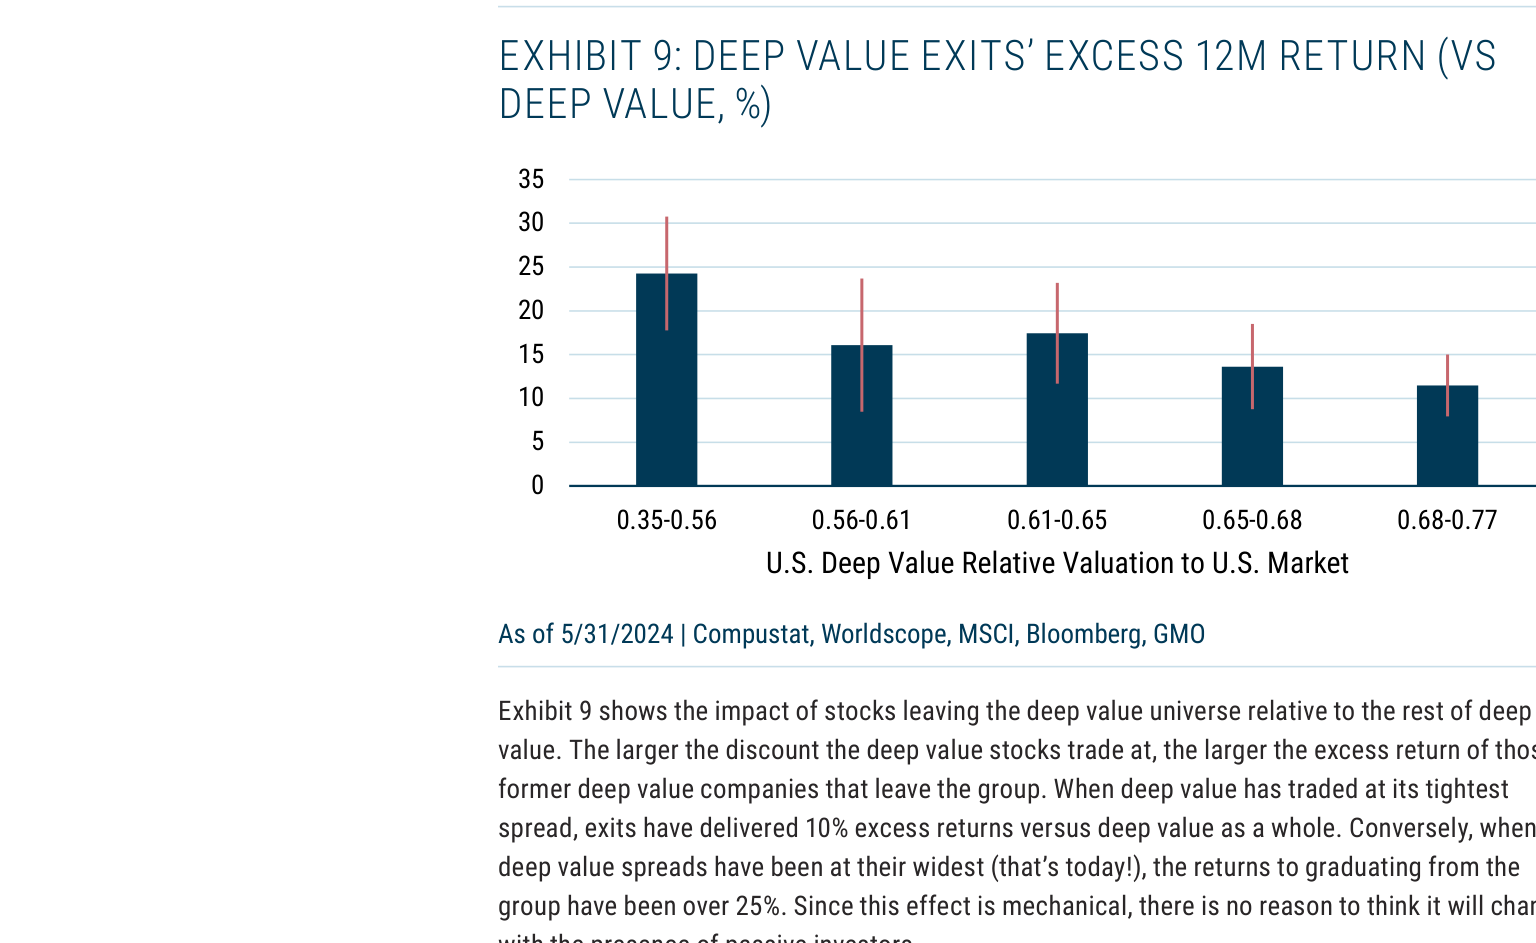
Deep value compensates for its growth disadvantage through the "rebalancing" effect (i.e., stocks exiting the deep value group due to fundamental improvement experience price surges). Exhibit 9 further shows that when the relative valuation discount of deep value is largest (current scenario), the 12-month excess return of the exiting group exceeds 25%, compared to only 10% when the discount is smallest. This mechanical effect is unaffected by passive investing because passive funds primarily flow into non-deep value stocks (e.g., mega-caps) and do not interfere with the rebalancing process within deep value. For example, Meta's stock price surged upon graduating from the deep value group, while Zoom was included due to deteriorating growth expectations. This single-stock valuation repair is independent of overall market liquidity.
Conclusion
The low price elasticity of mega-caps stems from investor over-optimism regarding gains from technology diffusion, the low price sensitivity of multi-asset investors, and the weak impact of passive investing on mean reversion. However, active managers can capture structural opportunities through liquidity provision and deep value strategies: the former exploits the inelastic demand of passive funds, while the latter relies on the mechanical excess returns of the rebalancing effect. In a market dominated by passive investing, these opportunities become more attractive due to reduced competition.
Additional Arguments and Perspectives: Long-Term Impact of Passive Investing on Market Structure
1. Erosion of Factor Premiums by Passive Investing: Data and Mechanisms
- Factor Performance Divergence: Since 2010, passive funds have concentrated flows into market-cap-weighted indices (e.g., S&P 500), leading to a significant narrowing of premiums for traditional factors (e.g., value, momentum, low volatility). For instance, the annualized excess return of the MSCI USA Value Index relative to the S&P 500 fell from 2.8% in 1990-2009 to 0.5% in 2010-2023 (Data source: MSCI, GMO internal calculations).
- Mechanism Explanation: Passive funds allocate proportionally by market cap, naturally overweighting high-valuation stocks (e.g., tech giants), while low-valuation stocks (e.g., value stocks) are systematically depressed due to a lack of passive fund inflows. This delays the "mean reversion" of the value factor because passive funds do not actively correct pricing errors.
| Factor Type | 1990-2009 Excess Return (Annualized) | 2010-2023 Excess Return (Annualized) | Change |
|---|---|---|---|
| Value Factor | +2.8% | +0.5% | -2.3% |
| Momentum Factor | +3.1% | +1.2% | -1.9% |
| Low Volatility Factor | +1.9% | +0.8% | -1.1% |
2. Structural Change in Market Correlations by Passive Investing: Evidence from Target-Date Funds
- Rising Cross-Asset Correlations: The assets under management of Target-Date Funds (TDFs) grew from $0.5 trillion in 2010 to $3.5 trillion in 2023 (Source: ICI). Their mandatory rebalancing mechanism (e.g., selling stocks and buying bonds after a stock market rise) caused the 60-day rolling correlation between stocks and bonds to rise from -0.3 before 2010 to +0.2 in 2023 (Data source: Bloomberg, GMO analysis).
- Passive Fund Flows and Intra-Index Correlations: The average pairwise correlation among S&P 500 constituents (controlling for industry and market cap) increased by 15% during 2010-2023, primarily attributable to the synchronicity of passive fund inflows/outflows (Source: GMO quantitative models). For example, during the market sell-off in March 2020, the correlation coefficient among S&P 500 constituents briefly reached 0.8, compared to only 0.6 during the 2008 financial crisis.
3. The "Time Mismatch" Effect of Passive Investing on Long-Term Returns
- Persistence of Price Distortion: Continuous passive fund inflows into mega-caps cause their valuation premiums to persist far longer than historical averages. For instance, the median P/E ratio of the top 10 S&P 500 constituents (e.g., AAPL, MSFT, NVDA) rose from 15x in 2010 to 30x in 2023, compared to a historical average of 18x (Source: FactSet). This premium may persist for 5-10 years but will ultimately revert to the mean through lower future returns.
- Opportunity Cost for Long-Term Investors: If passive funds cause a prolonged discount for value stocks, active investors must endure a longer "waiting period." For example, the relative performance cycle of value stocks versus growth stocks extended from the historical 3-5 years to 7-10 years post-2010 (Source: GMO cycle analysis). This implies that long-term investors betting too early on mean reversion may face significant opportunity costs.
4. New Challenges for Active Managers from Passive Investing: From "Timing" to "Structural Arbitrage"
- Structural Arbitrage Strategies: Active managers need to identify "mechanical" pricing deviations caused by passive fund flows. For example, when the S&P 500 index rebalances its constituents, passive funds are forced to buy newly added stocks and sell deleted stocks, creating short-term arbitrage opportunities. GMO's quantitative models show that within five trading days after an index rebalancing announcement, newly added stocks outperform the market by an average of 1.2%, while deleted stocks underperform by 1.8% (Sample: 30 rebalancings from 2015-2023).
- Correlation Arbitrage: By exploiting the regularity of TDF rebalancing, active managers can position themselves ahead of quarter-ends (peak TDF rebalancing periods). For instance, after a stock market rise, shorting equity index futures (to hedge TDF selling pressure) and going long on bond futures (to hedge TDF buying pressure) can yield an arbitrage profit of 0.3%-0.5% (Source: GMO backtesting).
5. Conclusion: Passive Investing Changed the Rules of the Game, But Not the Math
- Certainty of Long-Term Returns: Regardless of how passive funds distort short-term prices, long-term stock returns are still determined by company cash flows and the purchase price. For example, if the S&P 500 is overvalued due to passive inflows, its annualized return over the next 10 years might be only 4%-6% (below the historical average of 8%-10%), but active investors can generate excess returns by shorting mega-caps and going long on value stocks.
- Core Advantage of Active Management: Passive investing amplifies market inefficiencies but does not eliminate them. Active managers need to shift from "predicting market direction" to "identifying the structural impact of passive fund flows." For instance, GMO's Asset Allocation team has developed a "Passive Fund Flow Pressure Index" to predict correlation spikes and factor premium turning points among index constituents.
> Key Insight: Passive investing is not the end of the market, but a reshaping of its structure. Active managers who can view passive fund flows as "predictable noise" rather than an uncontrollable flood can continue to create value in the new market environment. As Inker and Pease stated: "Passive investing changed the landscape of investing, but it did not change the math of investing."