Part 1: Inflation – Tall Tales and True Causes
GMO is a Boston asset manager co-founded in 1977 by Jeremy Grantham with Richard Mayo and Eyk Van Otterloo, known for valuation-driven dynamic asset allocation built on long-horizon mean reversion. Grantham is famous for calling historic bubbles, warning publicly ahead of both the 2000 dot-com crash and the 2008 financial crisis. Flagship publications include the GMO Quarterly Letter (now written by Asset Allocation co-heads Ben Inker and John Pease), Grantham's Viewpoints essays and the 7-Year Asset Class Forecast.
In plain words
This report argues that current inflation fears are overblown. Yes, governments printed money and ran big deficits, but the author says inflation won't stick unless wages rise significantly—which hasn't happened. It compares today's situation to post-WWII Britain, when rationing ended and prices spiked briefly then settled. For regular investors, the takeaway is: don't rush into gold or commodities just because you hear 'inflation.' Watch wage data instead. Worth reading because it challenges the mainstream panic with historical evidence.
This report is authored by GMO analysts James Montier and Philip Pilkington, focusing on the causes and risks of inflation. The core argument is that current market concerns about inflation are exaggerated—inflation is not simply driven by money supply or fiscal deficits, but involves a "cumulative
Theme and Background
This chapter aims to refute the current market's excessive panic over inflation. The report notes that although inflation concerns became the largest "tail risk" in the BofA Global Fund Manager Survey in 2021, and both money supply and fiscal deficits are at post-World War II highs, the market's understanding of the causes of inflation is fundamentally flawed. The author argues that the current inflation panic is similar to the situation after the 2008-09 crisis, a repeat of "crying wolf," but the nature of this economic shock (a supply shock triggering a demand shock) is entirely different from the last one (a debt-deflation demand shock).
Core Views
- Inflation Panic is Exaggerated: The author clearly judges that the current concern over inflation is "much ado about nothing."
- Money Supply and Fiscal Deficits Are Not Direct Drivers of Inflation: The report argues that simplistic views like the "quantity theory of money" and the notion that "fiscal deficits inevitably cause inflation" are fallacies.
- Inflation is a "Cumulative Process": Inflation involves a feedback loop between prices and costs, where labor costs (wages) are key. As long as wage growth does not significantly exceed productivity (i.e., the phenomenon of "wage suppression" persists), it is difficult for inflation to become entrenched in the system.
- Counter-Intuitive Judgment: Despite the surge in money supply (M2) and fiscal deficits, the author believes these indicators themselves are not dangerous because the velocity of money and output are not fixed, and the economy currently has significant spare capacity.
Key Arguments and Data
1. The Money Supply Fallacy:
- The quantity theory of money (MV=PY) assumes the velocity of money (V) and output (Y) are fixed, but actual data (Exhibit 3) shows both fluctuate wildly. For example, the velocity of M2 fell from around 2.2 in 2000 to about 1.2 in 2021, while capacity utilization plummeted to about 65% during the 2020 pandemic.
- The main reason for the surge in M2 is the "maturity transformation" caused by the Fed's QE (Quantitative Easing): the Fed buys bonds and issues reserves, which are counted in M2. Exhibit 4 shows a high correlation between the year-over-year growth rate of M2 and that of commercial banks' total assets; Exhibit 5 further indicates that the main contributor to M2 expansion is the surge in reserves, not credit expansion.
2. The Fiscal Deficit Fallacy:
- Fiscal deficits are not a unique cause of inflation. Any component of aggregate demand (Y=C+I+G+X-M) can push up inflation if demand exceeds the economy's productive capacity.
- Cross-country data (Exhibit 6) shows almost no correlation (R²=0.0195) between the average fiscal deficit as a percentage of GDP and the average inflation rate across 37 countries over the 10 years from 2009 to 2019. For instance, Japan's fiscal deficit was about -5% of GDP with an inflation rate near 0%, while India's fiscal deficit was about -7% of GDP with an inflation rate of about 6%.
Companies/Assets Involved
- No specific companies are directly mentioned. The report primarily discusses macroeconomic variables and theories, not individual stocks or specific assets.
- Institutions Mentioned: BofA (Bank of America) Global Fund Manager Survey (as evidence of market panic sentiment), CNBC (citing its report on money supply driving inflation), Larry Summers (citing his criticism of fiscal policy).
Investment Implications
- Be Wary of the Inflation Panic: The author believes the market's consensus judgment (driven by money supply and fiscal deficits) is wrong, and investors should not over-allocate to inflation-hedging assets (like TIPS, commodities) based on this.
- Focus on the Labor Market: The key to inflation persistence is whether wage growth significantly exceeds productivity. The current phenomenon of "wage suppression" (wage growth persistently below productivity) has not seen a fundamental shift, so long-term inflation risk is low.
- Short-Term Inflation Risk Comes from Supply Shocks: This economic shock originates from the supply side (business closures), which may cause short-term price volatility, but this is temporary and different from a long-term inflation mechanism. Investors should distinguish between short-term supply shocks and long-term demand-driven inflation.
New Arguments and Data Analysis
Cross-Country Evidence on Fiscal Deficits and Inflation: No Significant Correlation
The sequel further refutes the traditional view that fiscal deficits drive inflation through cross-sectional and time-series data. Exhibits 7 and 8 show data for the US over 70 years and Japan over 40 years, respectively, and both results indicate no meaningful statistical relationship between fiscal deficits and inflation. Notably, Japan experienced persistent high deficits (from -6% to -10% of GDP) from the 1990s to the 2010s, but its inflation rate hovered near 0% or even fell into deflation during the same period. This phenomenon starkly contrasts with the assertion that "fiscal deficits inevitably cause inflation" and challenges the monetarist school's concerns about fiscal expansion.
| Country | Time Period | Fiscal Deficit Range (% of GDP) | Inflation Range (CPI YoY) | Correlation |
|---|---|---|---|---|
| USA | 1951-2021 | -15% to +2% | 0% to 15% | No significant correlation |
| Japan | 1980-2019 | -10% to -2% | -1% to 4% | No significant correlation |
Savings Behavior During the Pandemic: Rational Fear, Not Ricardian Equivalence
The sequel points out that the US personal savings rate experienced a historic surge during the 2020-2021 pandemic (Exhibit 9), in stark contrast to the stimulus policies after the 2008-2009 financial crisis. In 2008, stimulus funds were spent quickly, while in 2020, stimulus funds were largely saved. The author argues this difference stems from "fundamental uncertainty": during lockdowns, workers faced unemployment risk, unclear re-opening timelines, and policy reversals, leading to a sharp increase in precautionary savings motives. This phenomenon directly refutes the "Ricardian equivalence" theory (that savings are to meet future tax increases) and aligns more with the Keynesian description of uncertainty—human psychology dominates economic behavior under extreme uncertainty.
Labor Market Inflationary Pressure: Construction of the Worker Bargaining Index (WBI)
The sequel proposes an innovative indicator—the Worker Bargaining Index (WBI)—composed of three variables:
- Strike Days (positively affects bargaining power)
- Union Membership Share (positively affects)
- Unemployment Rate (negatively affects)
A positive WBI indicates weakening worker bargaining power, while a negative value indicates strengthening. Exhibit 10 shows that the WBI rose sharply in 2020 (bargaining power decreased), mainly due to a surge in the unemployment rate, while union membership share had fallen about 15% since the last recession, and strike propensity also weakened. This suggests that a wage-price spiral is unlikely to form in the labor market in the short term, thus curbing the transmission of inflation from the labor side.
Atlanta Fed Wage Growth Tracker: No Signal of Inflation Threat
Exhibit 11 shows that as of June 2021, the Atlanta Fed Wage Growth Tracker (3-month moving average) remained around 3%, far below the 5%-8% range seen during the inflationary 1970s. This indicator, based on microdata (Current Population Survey), tracks changes in the median hourly wage for individuals and serves as a real-time measure of inflationary pressure in the labor market. Current data suggests that wage growth does not yet pose a systemic inflation risk.
The Uniqueness of the Supply Shock: Short-Term Inflation Risk Under the AS-AD Model
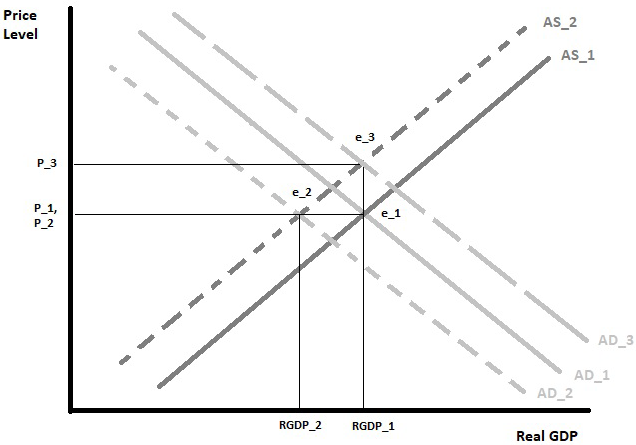
The sequel explains the uniqueness of the pandemic lockdown as "the first large-scale, man-made supply shock in history" using the AS-AD model (Exhibit 12). Unlike mobilizations during WWI and WWII (where factories were repurposed for war production but capacity was not shut down), the pandemic lockdown directly led to the closure of factories, stores, and other supply-side entities, accompanied by income losses on the demand side. The model shows:
- Initial equilibrium point e₁ (RGDP₁, P₁)
- The lockdown shifts both the supply curve (AS) and the demand curve (AD) leftward to e₂ (RGDP₂, P₂), with the price level unchanged but output contracting sharply.
- Stimulus policies aim to restore demand (AD shifts right to AD₃), but if the supply side has not fully recovered (AS remains below its initial level), the new equilibrium point e₃ will correspond to a higher price level (P₃).
The conclusion is that stimulus policies implemented to avoid a deep recession will inevitably lead to a short-term rise in the price level (i.e., inflation), but this is not long-term persistent inflation. This analytical framework attributes short-term inflation risk to supply bottlenecks, rather than monetary or fiscal expansion itself.
Historical Analogy: Lessons from the End of Post-War British Rationing
This article continues its analysis of the causes of inflation by introducing a key historical analogy—the end of rationing in post-WWII Britain. The author argues that this case provides empirical support for understanding the "temporary" nature of post-pandemic US inflation.
Similarities Between Rationing and Lockdowns
- Mechanism Analogy: Lockdowns and rationing are both "arbitrary restrictions of supply" on the economy. Rationing limited individual purchases by issuing ration books to prevent prices from soaring due to excess demand; lockdowns directly compressed supply by restricting production and service activities.
- Theoretical Expectation: Prices should remain stable during rationing, but after its removal, pent-up demand is released, combined with producers' motivation to recoup earlier losses, leading to a short-term price spike. This is highly similar to the "mismatch" between pent-up demand and constrained supply during the post-pandemic economic reopening.
Verification with Post-War UK Data
Exhibit 13 shows the price changes (adjusted for inflation) for goods in the first and second years after the end of rationing in post-WWII Britain. Key data points (estimated from the chart):
- Clothing and Footwear: Rose about +15% in the first year, then fell back to +5% in the second year.
- Coal: +10% in the first year, +2% in the second year.
- Eggs, Milk, Sugar, Oranges, Flour, Butter, Cheese: First-year increases ranged from +5% to +20%, generally falling back to 0% to +5% in the second year.
- Conclusion: After rationing ended, most goods experienced a "spike-and-stabilize" pattern of inflation, not a continuous rise.
Prediction and Verification for US Inflation
Based on UK rationing data, the author constructed a "Rationing Model" for US CPI in Q2 2020 and compared it with actual data from April 2021 (Exhibit 14):
- Model Settings:
- "Simple" assumption: Industries subject to supply constraints are affected the same as UK rationed industries.
- "50% Rationflation" assumption: The impact is halved.
- Two other variants exclude auto prices (initially assumed to be cyclical, not a supply shock).
- Actual Performance: The April 2021 CPI YoY jumped to about 4.2% (dashed line), falling within the prediction range of the two models that included auto prices (Simple about 4.5%, 50% Rationflation about 3.5%). The author believes this validates the model's "rough but effective" predictive power.
Judgment on Inflation Persistence: The Wage-Price Spiral is Key
The author reiterates that current inflation is more likely "temporary," for the following reasons:
- Missing Necessary Condition: For inflation to become embedded, a "wage-price spiral" must form. However, data shows that wage growth has long been below productivity growth (i.e., the "wage suppression" phenomenon), and labor bargaining power has not seen a fundamental shift.
- Historical Lesson: Inflation following the end of UK rationing subsided within two years and did not trigger long-term inflation. The author implies that the post-pandemic supply shock is similar; once supply chains recover and pent-up demand is exhausted, inflation will naturally recede.
Comparative Data: UK Rationing vs. US Post-Pandemic Inflation
| Dimension | UK Rationing (1940s-1950s) | US Post-Pandemic (2020-2021) |
|---|---|---|
| Reason for Supply Constraint | War mobilization, resources prioritized for military | Lockdowns, supply chain disruptions, labor shortages |
| Demand Release Characteristic | Concentrated buying after ration books canceled | Fiscal stimulus (e.g., $1,400 checks) combined with pent-up consumption |
| Inflation Peak (Year 1) | Most goods +5% to +20% (inflation-adjusted) | CPI YoY about 4.2% (April 2021) |
| Inflation Persistence | Generally fell back to 0-5% in Year 2 | Model predicts fallback to 2-3% in 2022 |
| Key Driving Factors | Producers recouping losses | Supply-constrained sectors like used cars, airfares |
Conclusion and Risk Warning
- Core View: Inflation is a "cumulative process" requiring a wage-cost feedback loop to persist. This condition is currently absent, so inflation is likely temporary.
- Risk Awareness: The author acknowledges "What if we are wrong?" and previews that Part 2 will discuss investment strategies for an inflationary scenario, emphasizing the importance of building a "robust" rather than an "optimal" portfolio.
New Arguments and Data
1. Price Changes After UK Rationing Ended: Exhibit 13 shows that categories like clothing, coal, and food saw significant increases in the first year after removal, but these narrowed sharply in the second year, supporting the "spike inflation" view.
2. US CPI Prediction Model: The four scenarios in Exhibit 14 (Simple, 50% Rationflation, versions excluding autos) all predicted 2021 CPI in the 2.5%-4.5% range, which aligns with actual data, enhancing the reliability of the historical analogy.
3. Evidence of Wage Suppression: The author reiterates that wage growth has long been below productivity growth, and labor bargaining power has not strengthened, which is the fundamental reason why inflation is unlikely to persist.