It’s Always Darkest Before the Dawn
GMO is a Boston asset manager co-founded in 1977 by Jeremy Grantham with Richard Mayo and Eyk Van Otterloo, known for valuation-driven dynamic asset allocation built on long-horizon mean reversion. Grantham is famous for calling historic bubbles, warning publicly ahead of both the 2000 dot-com crash and the 2008 financial crisis. Flagship publications include the GMO Quarterly Letter (now written by Asset Allocation co-heads Ben Inker and John Pease), Grantham's Viewpoints essays and the 7-Year Asset Class Forecast.
In plain words
This report says that even though global stocks are crashing, history shows cheap stocks (like value stocks in emerging markets, Europe, and Japan) often bounce back later in a bear market. For regular investors, it means don't panic-sell; instead, consider buying assets that are already very cheap. The report uses past crashes (like the 2000 tech bubble and Japan's bubble) to show that cheap stocks eventually beat the market. Worth reading because it explains why the darkest moment might be just before dawn.
In its April 2020 report, the GMO Asset Allocation team noted that global markets experienced extreme volatility, with the S&P 500 recording more daily moves of over 3% in 20 trading days than it had in the previous five years combined. The core argument is that the current bear market typically unf
Theme and Background
This chapter discusses the performance patterns of cheap assets during the current market crash. GMO notes that the S&P 500 has experienced more daily moves of 3% or more in the past 20 trading days than in the previous five years combined. Global equity markets are declining at a record pace, but the valuation spread between cheap and expensive assets was already at extreme levels before the pandemic.
Core Thesis
The author's core judgment is that bear markets typically go through three phases. Cheap assets underperform or match the market in the first phase but begin to outperform in the second and third phases, ultimately achieving positive returns. The current market is in a transition window from the first to the second phase, making it the right time for valuation-sensitive investors to increase exposure to cheap assets. The counterintuitive point is that, despite the discomfort of holding falling assets, history shows cheap assets ultimately prevail in bear markets.
Key Arguments and Data
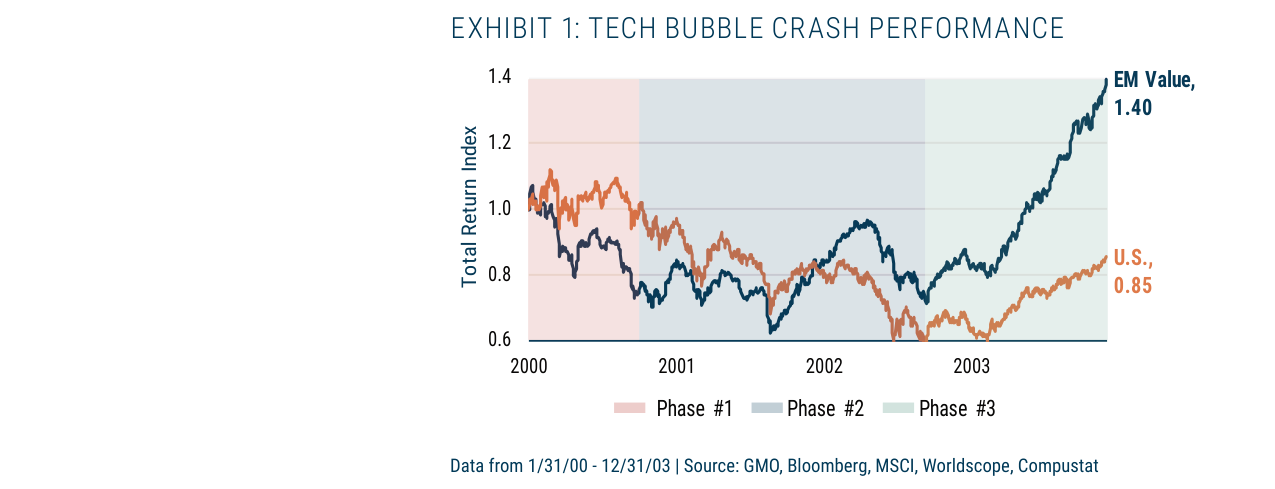
During the 2000-2003 tech bubble burst, EM Value achieved a cumulative return of 40% (1.40), significantly outperforming the U.S. market's -15% (0.85)
1. Three-Phase Bear Market Model:
- Phase 1: All assets decline; cheap assets perform in line or slightly worse
- Phase 2: The market continues to fall, but cheap assets begin to outperform
- Phase 3: Cheap assets achieve absolute positive returns
2. Historical Case Data:
- Tech bubble burst (2000-2003): EM Value ultimately rose 40%, while U.S. stocks fell 15%
- Japanese bubble burst: Japanese Value outperformed the Japanese market from 1990-1994 (0.96 vs. 0.81)
- 1973 bear market: U.S. Small Value outperformed the market (0.99 vs. 0.80)
- 2000 tech bubble: U.S. Small Value ultimately rose 89%, while the market fell 12%
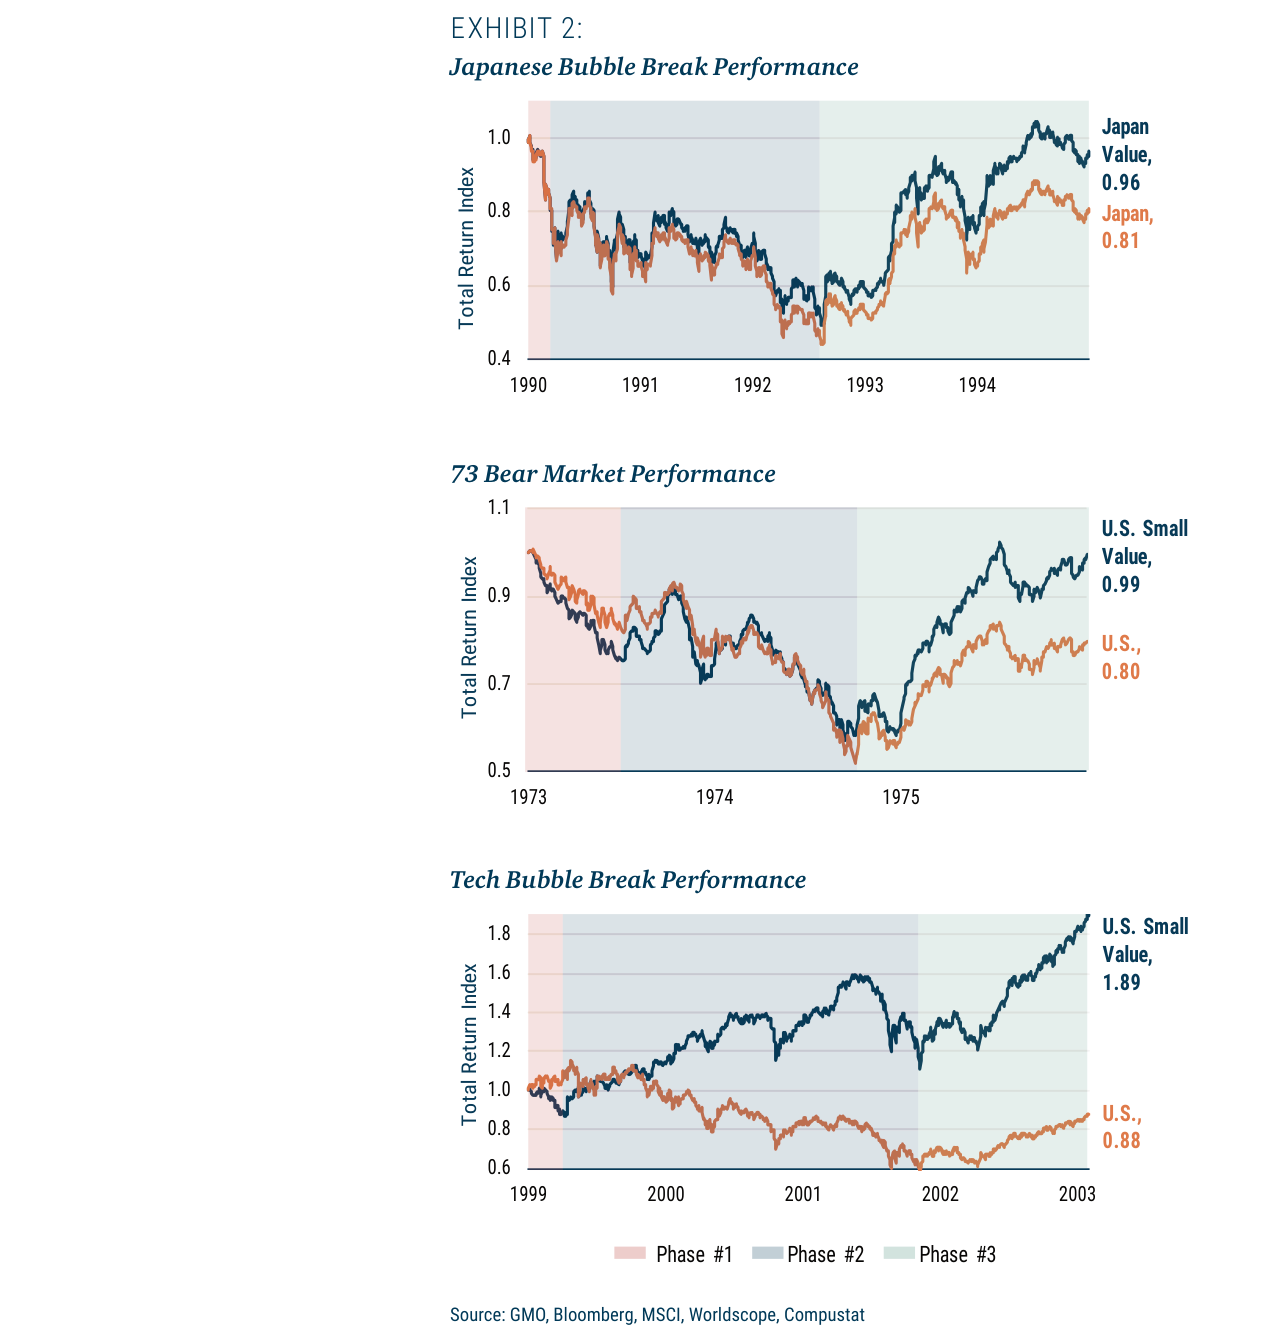
During the 1990-1994 Japanese bubble burst, Japanese value stocks achieved a cumulative return of 0.96, outperforming the Japanese market's 0.81
3. Current Valuation Levels:
- European, UK, and Japanese Value stocks are absolutely cheap
- EM Value stocks are extremely cheap
- The USD is at a historically low 1.4 standard deviations against EM currencies
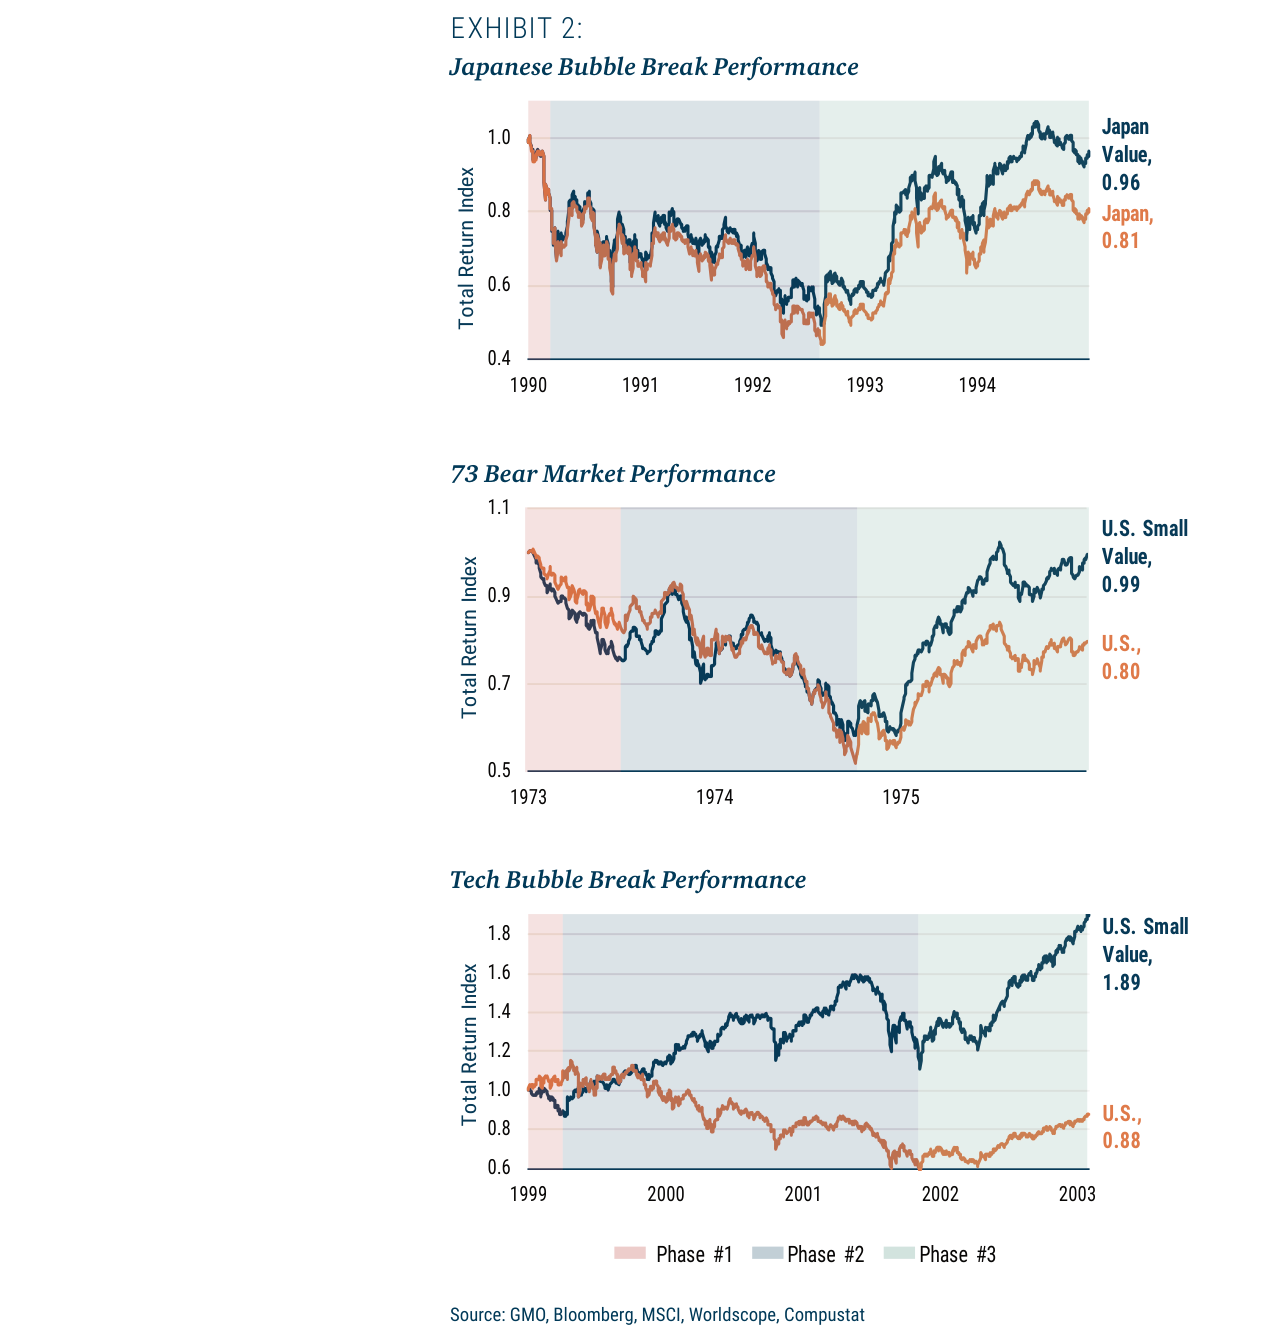
During the 1973-1975 bear market, U.S. small-cap value stocks achieved a cumulative return of 0.99, outperforming the U.S. market's 0.80
4. Impact of USD Strength:
- EM currencies generally depreciated; the Brazilian real fell 21%, while the Taiwan dollar fell about 1%
- Without USD appreciation, the MSCI EM would have outperformed the U.S. market year-to-date
- USD strength partly stems from risk aversion (MSCI EM local returns fall 5% for every 1% currency depreciation), but post-financial-crisis USD liquidity tightness has exacerbated this trend
Companies/Assets Involved
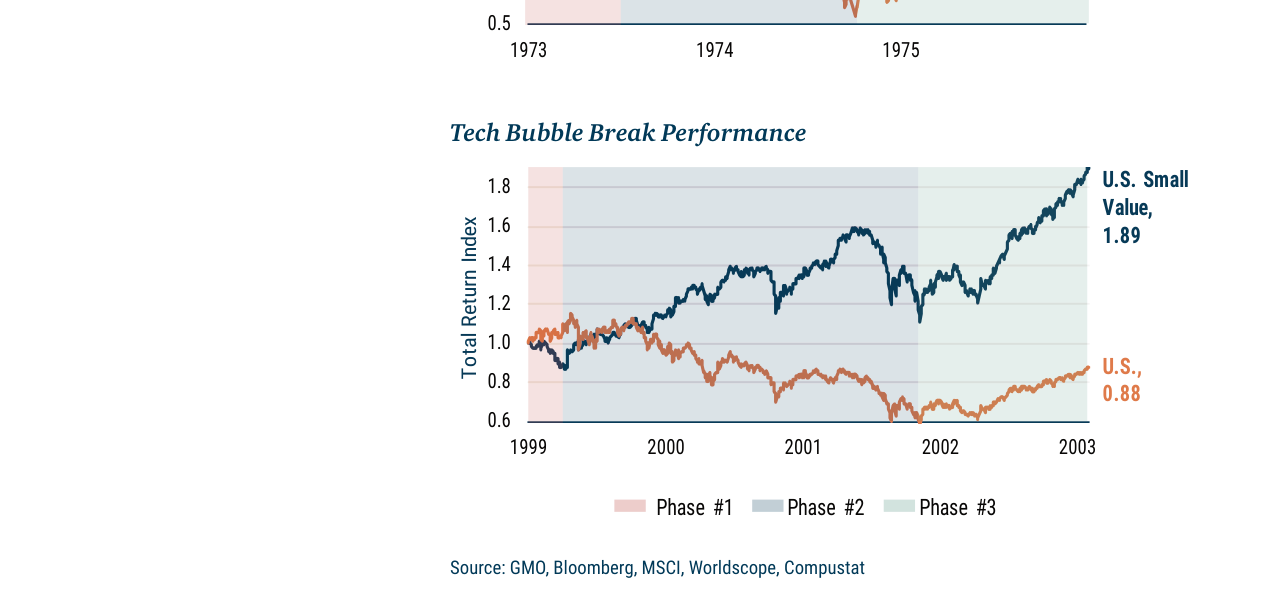
During the 1999-2003 tech bubble, U.S. small-cap value stocks achieved a cumulative return of 89% (1.89), significantly outperforming the U.S. market's -12% (0.88)
| Asset Class | Role | Key Data | View |
|---|---|---|---|
| EM Value Stocks | Most favored cheap assets | Expected double-digit excess returns vs. S&P 500 at the start of the year; currently extremely cheap | Bullish |
| European, UK, Japanese Value Stocks | Absolutely cheap | MSCI EAFE Value valuations at historical lows | Bullish |
| U.S. Small Cap Value | Historically strong performance | Rose 89% during the 2000 tech bubble vs. market decline of 12% | Bullish |
| U.S. Corporate Credit | Cheap assets to add | Prices have fallen to more attractive levels | Bullish |
| USD | Short-term headwind | At 1.4 standard deviations high vs. EM currencies; may decline after central bank intervention | Neutral to bearish |
Investment Implications
- Act Now: The current period is a key window to adjust portfolio allocation before volatility peaks subside. The report recommends increasing exposure to cheap assets before Phase 2 begins.
- Key Directions: EM Value stocks (extremely cheap with potential for USD pressure to ease), European/UK/Japanese Value stocks, and U.S. Small Cap Value.
- Risk Warning: Short-term volatility may remain severe, but history shows cheap assets ultimately prevail in bear markets; investors should not avoid them due to short-term declines.
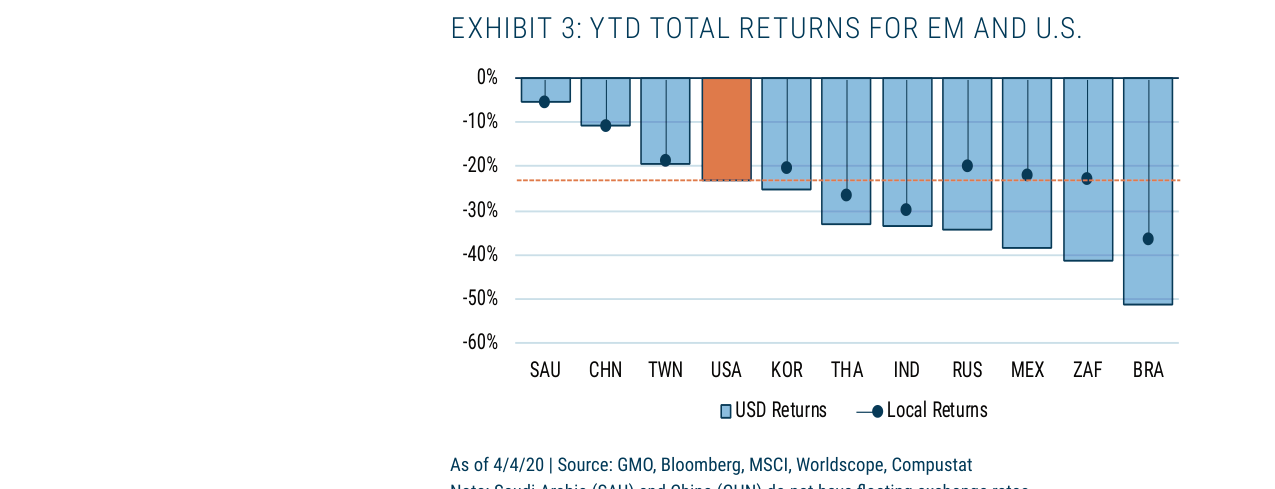
As of April 4, 2020, Brazil's USD-denominated return fell to -50%, the worst performer; the U.S. was at -20%; Saudi Arabia's local return fell only about 5%
Additional Arguments and Data Analysis
1. Differential Impact of the Oil Price War on USD and EM Currencies
- Event Background: In mid-March 2020, the oil price war between Saudi Arabia and Russia caused crude oil prices to crash. Brent crude fell from about $65/barrel at the start of the year to about $25/barrel by the end of March, a decline of over 60%. This directly impacted oil-exporting EM currencies, such as the Brazilian real (BRL) and Russian ruble (RUB), which depreciated by about 20% and 15% against the USD in March, respectively.
- Short-Term Driver of USD Strength: The oil price war intensified global risk aversion, pushing the USD index (DXY) to a three-year high of 102.99 on March 19. However, GMO argues that this USD strength is a "typical phenomenon in the early stages of a crisis" rather than a long-term trend. Historical data shows that during the 2008 global financial crisis and the 2014 oil price collapse, the USD peaked and then declined within 3-6 months after the crisis erupted.
- Valuation Advantage of EM Currencies: GMO's Exhibit 5 shows that as of March 31, 2020, the MSCI EM Currency Index was in a "cheap" range at 1.4 standard deviations below its historical mean (see table below). This is more attractive than the bottom of the 2008 financial crisis (about 1.0 standard deviations) and the 2016 EM crisis (about 0.8 standard deviations).
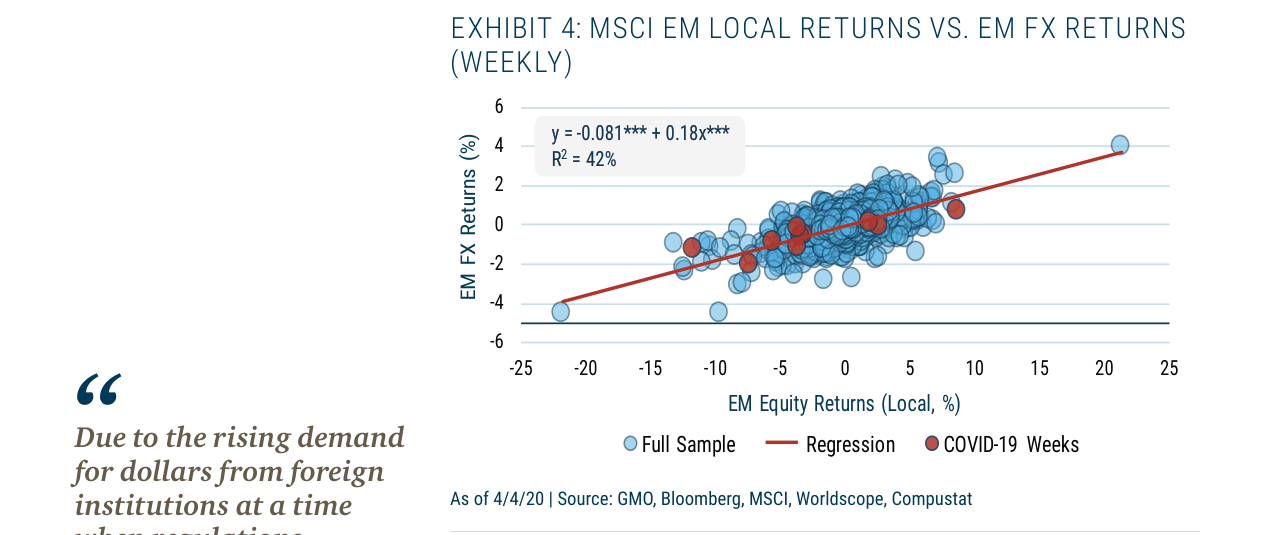
EM local stock returns and FX returns show a positive correlation (R²=42%, slope 0.18); during COVID-19 (red markers), a more pronounced simultaneous decline in stocks and currencies is observed
| Period | MSCI EM Currency Valuation (Standard Deviations) | Subsequent 12-Month USD Performance |
|---|---|---|
| October 2008 (Financial Crisis Bottom) | -1.0 | USD index fell about 8% |
| January 2016 (EM Crisis) | -0.8 | USD index fell about 5% |
| March 2020 (COVID-19 + Oil War) | -1.4 | To be observed (GMO predicts USD weakness) |
2. USD Overvaluation and "Tail Risk" Hedging of EM Currencies
- USD Valuation Comparison: GMO's Exhibit 5 implies that the USD is "expensive" relative to EM currencies. On a purchasing power parity (PPP) basis, as of March 2020, the USD was overvalued by about 12-15% against a basket of EM currencies, close to the 2016 high (overvalued by about 18%). In comparison, the USD was overvalued by about 10% during the 2008 financial crisis.
- Hedging Behavior of Institutional Investors: GMO mentions that "Japanese banks and Taiwanese life insurers," as long-term holders of USD assets, saw their FX hedging costs surge in March 2020. For example, the 3-month USD/JPY swap point widened from -30 basis points at the start of the year to -60 basis points, suggesting these institutions are reducing USD exposure. This further validates the capital outflow pressure following USD overvaluation.
- "Cheap" Attribute of EM Currencies: GMO emphasizes that even if oil prices remain low, EM currency valuations have fully priced in the risks. For instance, the Russian ruble fell to 80 RUB/USD in March 2020, close to the 2014 crisis low (85 RUB/USD). However, the Russian central bank raised rates to 6.0% to stabilize the currency, and foreign exchange reserves stood at $570 billion (March 2020 data), providing a buffer.
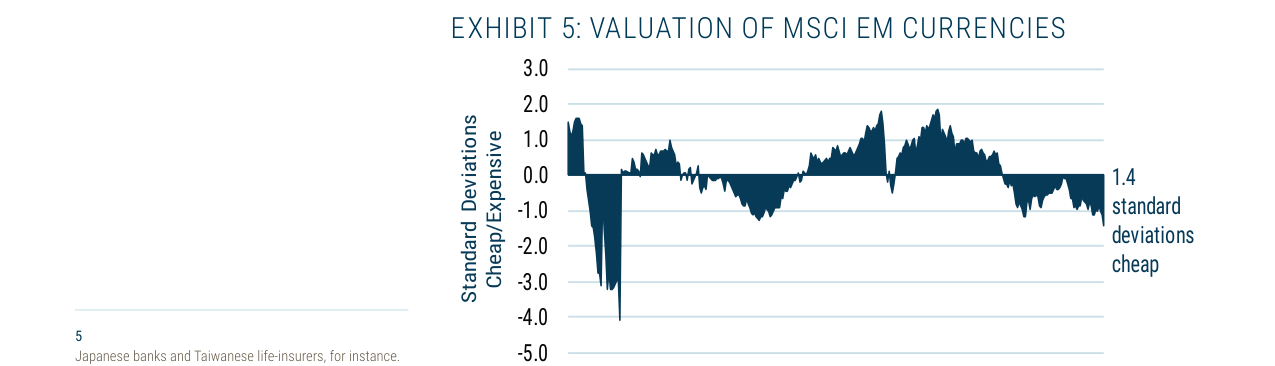
MSCI EM currencies are at historically low valuations relative to the USD; in March 2020, they were 1.4 standard deviations cheaper than the historical mean
3. Historical Analogy: Oil Crisis and USD Cycle Linkage
- 1986 Oil Price War: In 1986, Saudi Arabia increased production, causing oil prices to crash from $27/barrel to $10/barrel. The USD index fell about 15% over the subsequent 12 months, and EM currencies (e.g., the Mexican peso) rebounded about 20% after depreciating.
- 2014-2016 Oil Crash: Oil prices fell from $115/barrel to $30/barrel. The USD index peaked in March 2015 (100.3) and then fell to 92.0 by May 2016, a decline of about 8%. Over the same period, the MSCI EM Currency Index rebounded about 12% from its January 2016 low.
- Current Situation: GMO believes the March 2020 oil price war is similar to 1986, being a "supply shock" rather than a "demand collapse." Therefore, the probability of USD weakening and EM currency rebound is high, especially given that EM currency valuations are at historical lows.
4. Key Data Supporting the Conclusion
- Asset Allocation Recommendation: GMO emphasizes in the conclusion that "low-valuation assets perform well both during the deepening and at the end of a bear market." Historical data supports this view: during the 2000-2002 bear market, the MSCI EM Index (in local currency) rose about 35% in the 12 months after the September 2001 low, while the S&P 500 fell about 10% over the same period. During the 2007-2009 bear market, EM stocks rose about 60% in the 12 months after the October 2008 low, while developed markets rose only about 30%.
- Catalyst for USD Weakness: GMO predicts that "USD strength fades after the early stages of a crisis." The Federal Reserve launched unlimited QE in March 2020, flooding the market with USD liquidity. The USD index fell from its March high of 102.99 to below 100.0 by April 8, a decline of about 3%. If history repeats, the USD could fall below 95 by the end of 2020, providing about 5-10% appreciation potential for EM currencies.