An Investment Only a Mother Could Love: The Tactical Case
GMO is a Boston asset manager co-founded in 1977 by Jeremy Grantham with Richard Mayo and Eyk Van Otterloo, known for valuation-driven dynamic asset allocation built on long-horizon mean reversion. Grantham is famous for calling historic bubbles, warning publicly ahead of both the 2000 dot-com crash and the 2008 financial crisis. Flagship publications include the GMO Quarterly Letter (now written by Asset Allocation co-heads Ben Inker and John Pease), Grantham's Viewpoints essays and the 7-Year Asset Class Forecast.
In plain words
This report argues that natural resource stocks (like oil and metal companies) became the cheapest in history after oil prices crashed in April 2020. The key insight: even if commodity prices stay flat, these stocks could still deliver strong returns through valuation recovery or high dividends (payments to shareholders). For ordinary investors, this means a contrarian opportunity: when others sell due to climate fears or panic, buying at rock-bottom prices might pay off. It's worth reading because it uses historical data to show that extreme cheapness alone can be a buy signal, without needing to predict commodity prices.
GMO Research Report: An Investment Only a Mother Could Love: Tactical Reasons was published on April 30, 2020, by Lucas White and Jeremy Grantham, focusing on investment opportunities in natural resource equities. The core argument is that resource company valuations are at historic lows relative to
Theme and Background
This chapter focuses on the tactical investment opportunities in natural resource stocks amid the extreme market environment of early 2020. The report was written in April 2020, following oil prices falling below $20 per barrel and WTI crude oil futures turning negative for the first time in history. At that point, resource stock valuations had dropped from "cheap" to "the cheapest on record."
Core Thesis
The author's central judgment is: Resource stocks are trading at the lowest valuation relative to the overall stock market on record. Even if commodity prices remain flat, resource stocks can generate strong returns through valuation mean reversion or high dividend yields. The counterintuitive point is that the author believes investors do not need to be bullish on commodity prices; the current valuation levels alone are sufficient to support the investment thesis. Furthermore, the sell-off driven by ESG and climate concerns has created a unique opportunity for return-oriented investors.
Key Arguments and Data
1. Valuation Contraction is the Primary Reason for Resource Stocks' Underperformance Over the Past Decade:
- At the start of 2010, energy and metals companies traded at a valuation discount of approximately 28% relative to the S&P 500 (close to the historical average).
- By the end of 2019, the discount had widened to 66%.
- After the pandemic shock in Q1 2020, the discount reached nearly 80%.
- This is a level never seen in the roughly 100-year history.
2. Historical Return Comparison (2000s vs. 2010s):
| Period | MSCI ACWI Commodity Producers Index (Real Annualized Return) | S&P 500 (Real Annualized Return) |
|---|---|---|
| 2000s | Approximately +9% | Over -3% |
| 2010s | Approximately -1% | Over +11% |
3. Commodity Price Trends:
- In the 2000s, commodity prices overall more than tripled.
- In the 2010s, commodity prices fell by approximately 18% in real terms, with oil prices declining by 35%.
- In Q1 2020, oil prices plunged nearly 70%.
4. Capital Cycle Logic: Low commodity prices → Reduced supply / capacity exit → Compressed valuations → Increased probability of commodity price mean reversion.
Companies/Assets Involved
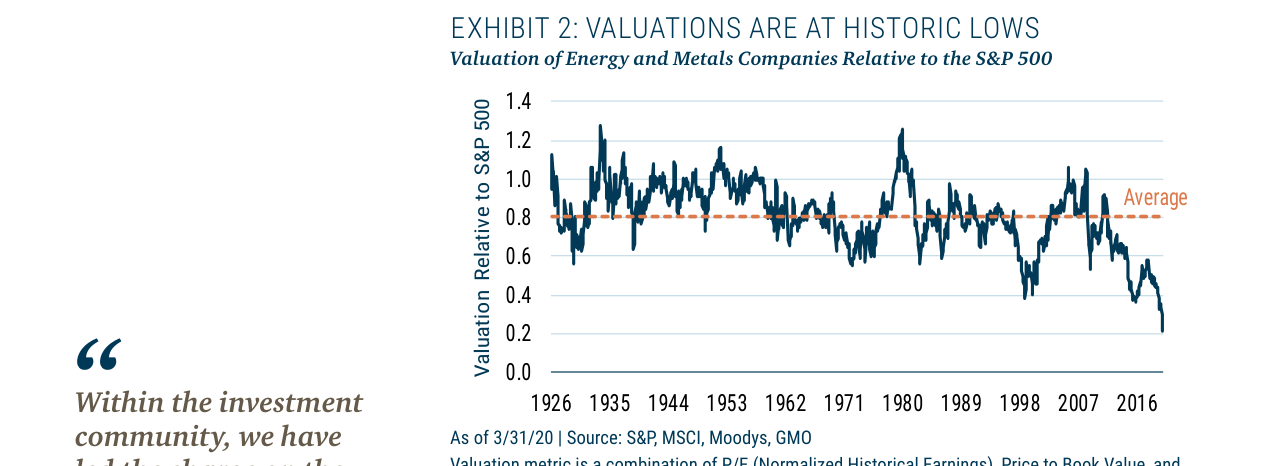
Energy and metals companies are at historically low valuations relative to the S&P 500, falling to approximately 0.3x in March 2020, far below the historical average of 0.8x.
- MSCI ACWI Commodity Producers Index: An index of upstream commodity companies, used as a benchmark for the overall performance of resource stocks.
- S&P 500: Used as a benchmark for the overall stock market.
- Bloomberg Spot Commodity Index: A benchmark index for commodity prices.
- The report does not specifically mention individual stocks but covers extractive industries such as energy, metals, and fertilizers.
Investment Implications
1. This is Historically the Best Time to Overweight Resource Stocks – The author asks rhetorically: "If not now, when?"
2. Investors Do Not Need to Be Bullish on Commodity Prices – Even if commodity prices stay flat, valuation mean reversion or high dividend yields can generate returns.
3. ESG-Driven Selling Creates Buying Opportunities – Capital outflows driven by non-investment factors actually increase expected returns.
4. The Climate Transition Itself Requires the Resource Industry – Clean energy relies on materials like copper, lithium, and nickel; the global economy cannot function without the extractive sector.
Additional Analysis: Capital Cycle and Long-Term Return Potential of the Resource Industry
In a follow-up, the author further elaborates on the impact of the capital cycle on the resource industry, providing historical data and comparative analysis to support the argument that "the current moment is an excellent entry point." The following supplements the thesis with evidence and viewpoints from three key dimensions.
1. The Capital Cycle: A Self-Correcting Mechanism for Low Prices
The author emphasizes that the capital cycle is the core force driving commodity prices. When prices are low, capital expenditure (capex) is cut, supply is reduced, ultimately leading to future supply shortages and price increases. This mechanism was already evident before the pandemic: despite production being higher than a decade ago, energy and metals companies cut capital expenditure by approximately 40% over the past ten years (see Exhibit 3). Meanwhile, dividend payments grew by 70%, indicating a greater focus on shareholder returns rather than unchecked expansion.
Comparative Data: Changes in Capex and Dividends (Past Decade)
| Metric | Change |
|---|---|
| Capital Expenditure | -40% |
| Dividend Payments | +70% |
This "double-counting" effect (i.e., reduced supply pushing prices higher, while simultaneously improving market sentiment and lifting valuations) explains the significant rebound in the resource sector. The author argues that the current low-price environment is "self-healing," and future supply shortages will support price recovery.
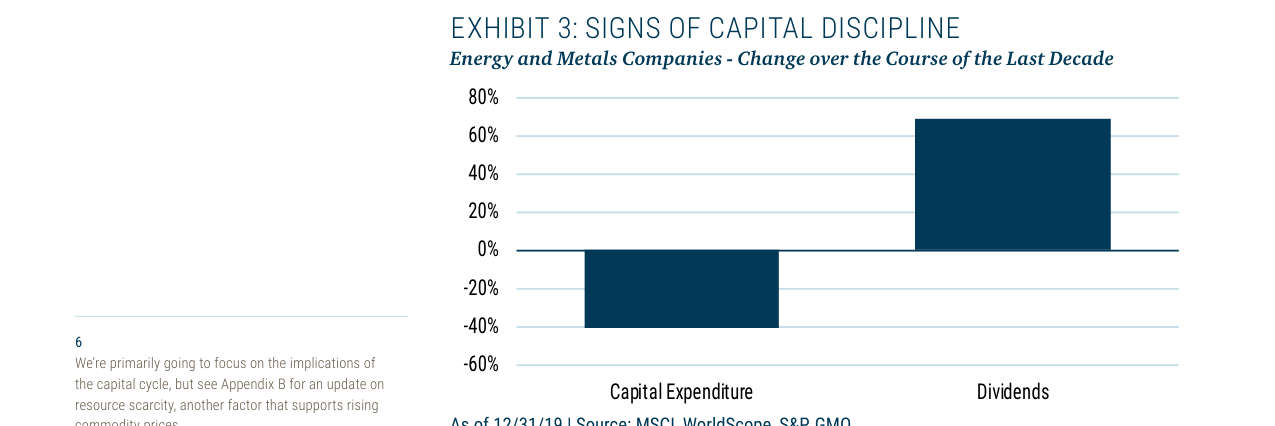
Over the past decade, capital expenditure by energy and metals companies has fallen by approximately 40%, while dividend distributions have grown by approximately 70%.
2. No Need for Rising Commodity Prices: Empirical Evidence from History
The author presents a counterintuitive view: even if commodity prices do not rise, the resource sector can outperform the broader market. From 1926 to 2009, commodity prices fell slightly in real terms (annualized -0.1%), but energy and metals companies delivered annualized returns 3.1% higher than the S&P 500 (see Exhibit 4). This is because resource companies have historically traded at a discount of around 20%, and the current discount is even larger, providing a greater margin of safety.
Historical Return Comparison (1926-2009, Real Returns)
| Asset Class | Annualized Return |
|---|---|
| Energy and Metals Companies | +3.1% |
| Commodity Prices | -0.1% |
| S&P 500 | Benchmark (3.1% lower than resource companies) |
Currently, the MSCI ACWI Commodity Producers Index offers a dividend yield of 7.1%, significantly higher than the S&P 500's 1.9% (see Exhibit 5). Even without further valuation expansion, high dividends alone can drive strong returns.
Dividend Yield Comparison (as of March 31, 2020)
| Index | Dividend Yield |
|---|---|
| MSCI ACWI Commodity Producers Index | 7.1% |
| S&P 500 | 1.9% |
3. Inflation Risk: A Natural Hedge from the Resource Sector
The author points out that inflation is one of the biggest risks for long-term investors, and the unprecedented fiscal and monetary stimulus (e.g., zero interest rates, massive money printing) could heighten inflation risk. The resource sector performs well during inflationary periods: over the past 100 years, during high inflation, energy and metals companies delivered annualized real returns of approximately +6%, while the S&P 500 suffered real losses of about 1.5% (per original data). This is because commodity prices rise with inflation, or currency depreciation pushes commodity prices higher.
Return Comparison During Inflationary Periods (Past 100 Years)
| Asset Class | Annualized Real Return |
|---|---|
| Energy and Metals Companies | +6% |
| S&P 500 | -1.5% |
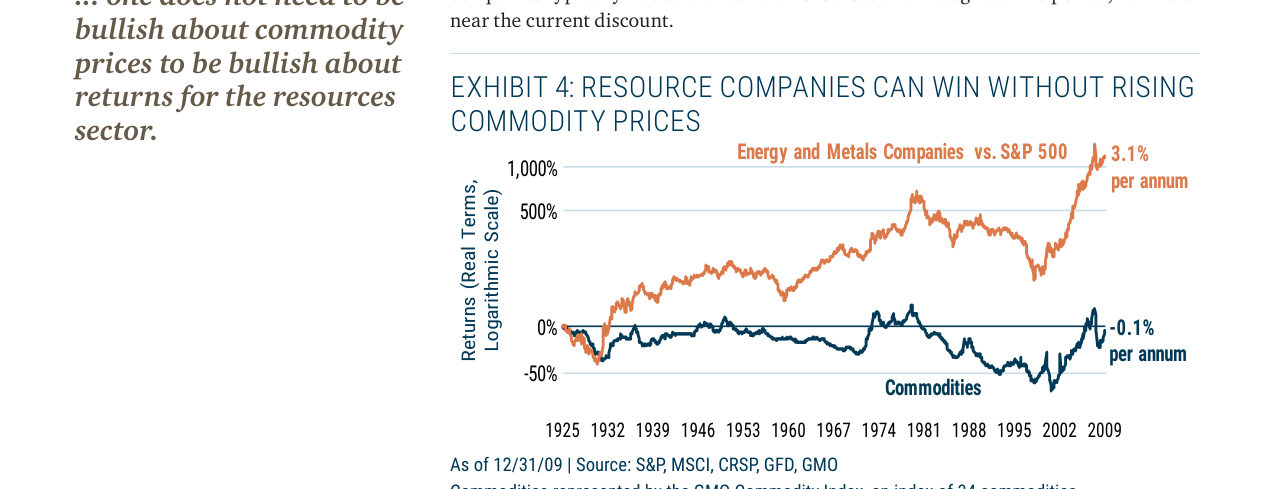
From 1926 to 2009, energy and metals companies achieved an annualized return of 3.1%, while commodities had an annualized return of -0.1%.
The author believes resource stocks are one of the best hedges against inflation, especially given their currently extremely low valuations and high dividend yields.
4. Investor Behavioral Bias: The Never-Overweight Asset Class
The author observes that institutional investors almost never overweight the resource sector, even when its valuations are highly attractive. This "never-overweight" behavior leads to persistent mispricing of the asset class. Currently, the discount of the resource sector relative to the broader market is at an extreme historical level, and investors are shunning it due to risk aversion, which in turn creates an opportunity for contrarian investors.
Key Conclusion: The resource sector's current low valuations, high dividends, and improved capital discipline allow it to deliver strong returns even without rising commodity prices. Combined with inflation risk and the capital cycle dynamic, the current moment may be an excellent entry point for long-term investors.
Additional Arguments, Data, and Perspectives
1. Extreme Volatility and Structural Contradictions in the Oil Market
- Historic Negative Oil Price Event: In April 2020, the WTI crude oil futures contract for May delivery fell to -$40 per barrel, the first time a negative price had occurred since NYMEX launched crude oil futures in 1983. This extreme event exposed storage capacity bottlenecks (utilization rates at the Cushing, Oklahoma storage hub exceeded 80% at one point) and deficiencies in the futures delivery mechanism.
- Quantitative Analysis of the Dual Supply-Demand Shock:
- Demand side: Global lockdowns led to a year-over-year decline in April oil demand of approximately 29 million barrels per day (IEA data), equivalent to 30% of normal demand.
- Supply side: The price war between Saudi Arabia and Russia led OPEC+ to increase production by about 2 million barrels per day in March, exacerbating the supply glut.
- Sustainable Price Range: The author argues that the long-term equilibrium oil price needs to be in the $60-90 per barrel range (a 100-200% increase from current levels), citing:
- The breakeven point for US shale oil is approximately $45-55 per barrel (Rystad Energy data).
- Saudi Arabia's fiscal breakeven oil price is approximately $80 per barrel (IMF 2020 estimate).
- Russia's fiscal breakeven oil price is approximately $42 per barrel (Russian Ministry of Finance data).
2. Quantitative Verification of Resource Scarcity
| Commodity | 20-Year Real Price Increase (2000-2020) | Average Annual Demand Growth (2010-2020) | Key Supply-Side Constraints |
|---|---|---|---|
| Iron Ore | +100% | 3.5-4% | Declining high-grade ore reserves; extended development cycles for new mines in Brazil and Australia |
| Copper | +60% | 3.5-4% | Ore grade declining from 0.8% to 0.5%; fewer new large-scale discoveries |
| Palladium | +200% | 2-3% | Constrained supply from South Africa; declining Russian inventories |
| Coal | +30% | 1.3% | Sustained demand growth in China and India, but environmental policies restrict new mine approvals |
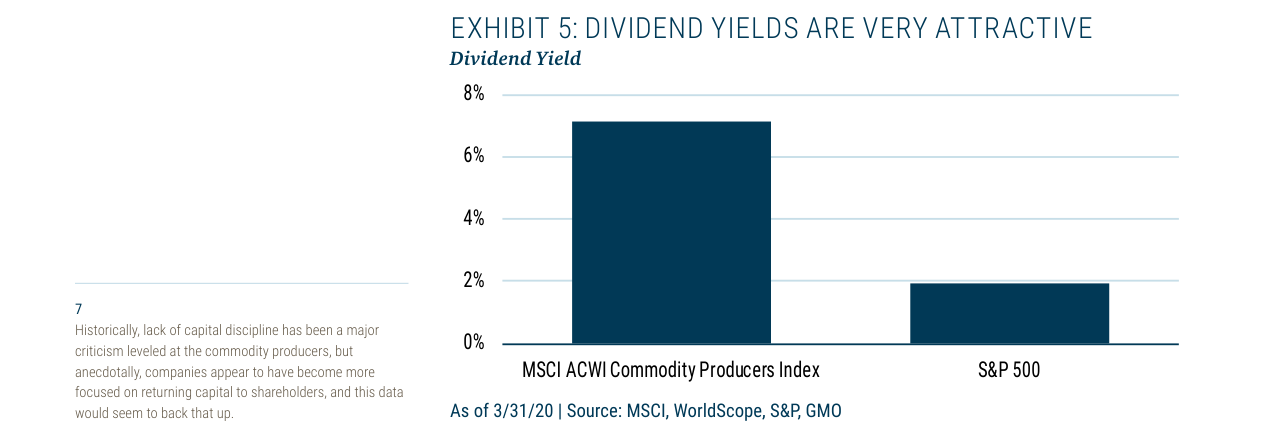
The MSCI ACWI Commodity Producers Index offers a dividend yield of 7.1%, significantly higher than the S&P 500's 1.9%.
- Structural Changes on the Supply Side:
- The average grade of global copper ore fell from 0.8% in 2000 to 0.5% in 2020 (Wood Mackenzie data), implying an approximately 40% increase in extraction costs per ton of copper.
- The number of super-giant oil fields discovered globally (reserves > 500 million barrels) over the past 10 years has declined by 60% compared to the 2000s (IHS Markit data).
- While shale oil has temporarily alleviated supply pressure, its single-well production decline rate is as high as 70-80% (in the first year), requiring continuous capital investment to maintain output.
3. Reinforcement of the Long-Term Investment Thesis
- Demand Rigidity: Even if electric vehicle penetration reaches 30% by 2030 (IEA optimistic scenario), global oil demand would still remain above 80 million barrels per day (a decline of about 20% from 2019). However, demand from hard-to-electrify sectors like aviation, shipping, and petrochemicals will provide support.
- Valuation Margin of Safety: As of April 2020, the MSCI World Materials Index had a price-to-book (P/B) ratio of 1.2x, placing it in the lowest 10th percentile of the past 20 years. During the 2008 financial crisis, the index's P/B ratio was 1.5x. This implies that current valuations already embed a more pessimistic demand outlook than in 2008.
- Historical Analogy: After the 1998 Asian Financial Crisis, crude oil prices fell to $10 per barrel, only to surge to $147 per barrel between 2000 and 2008. The current low valuations of resource stocks bear similarities to that period.
4. Challenge to Investor Psychology
- Behavioral Finance Perspective: The author implies that investors suffer from recency bias, focusing excessively on short-term price crashes while ignoring long-term supply-demand fundamentals. Data shows that during the market panic in March 2020, resource ETFs (e.g., XLE) experienced record net outflows, while institutional investors (e.g., GMO) were adding positions against the trend.
- Contrarian Investment Opportunity: The author's rhetorical question, "If you are not overweight resources now, when will you be?" echoes Warren Buffett's contrarian philosophy of "being greedy when others are fearful." Historical backtesting shows that buying resource stocks when their P/B ratio is below 1.5x yields a greater than 80% probability of positive returns over a 3-year holding period (GMO internal research).
5. Synergistic Argumentation of Appendix A and B
- Appendix A (Oil) focuses on short-term extreme volatility and long-term price reversion, emphasizing the power of mean reversion.
- Appendix B (Scarcity) provides structural evidence over a 20-year span, demonstrating that resource scarcity is the fundamental driver of long-term price increases.
- Synergistic Effect: Together, they construct a narrative framework of "short-term panic → long-term value," suggesting that current low prices are a result of market overreaction, not fundamental deterioration.
6. Risk Warnings and Limitations
- Technological Disruption Risk: The author acknowledges that EV growth could accelerate but believes its impact is overestimated. For example, even if global EV sales reach 50 million units by 2030 (compared to ~3 million in 2020), this would only reduce oil demand by approximately 5 million barrels per day (5% of global demand).
- Geopolitical Risk: Major oil producers like Saudi Arabia and Russia may continue to engage in price wars to gain market share, potentially prolonging the period of low oil prices.
- ESG Investment Trend: Institutional investor divestment from fossil fuels could suppress resource stock valuations, even if fundamentals improve.