Is Investing Starting to Get Difficult Again?
GMO is a Boston asset manager co-founded in 1977 by Jeremy Grantham with Richard Mayo and Eyk Van Otterloo, known for valuation-driven dynamic asset allocation built on long-horizon mean reversion. Grantham is famous for calling historic bubbles, warning publicly ahead of both the 2000 dot-com crash and the 2008 financial crisis. Flagship publications include the GMO Quarterly Letter (now written by Asset Allocation co-heads Ben Inker and John Pease), Grantham's Viewpoints essays and the 7-Year Asset Class Forecast.
In plain words
This report argues that investing has been easy for years due to low volatility and stocks and bonds moving in opposite directions, but that may be ending. Early 2018 saw more market swings, signaling a shift. For regular investors, this means lower returns and more bumps ahead, but that's actually healthy long-term. It's worth reading because it explains why 'easy' markets are risky and how to prepare for tougher conditions.
GMO's first-quarter 2018 report points out that rising market volatility and a shift in the correlation between stocks and bonds signal that the investment environment is transitioning from "easy" to "difficult." The "easy" returns brought by low volatility and negative correlation over the past eig
Theme and Background
This chapter examines the rise in market volatility and the shift in the stock-bond correlation during the first quarter of 2018, analyzing whether this signals a transition in the investment environment from "easy" to "hard." The author argues that the "easy" returns of the past eight years, driven by low volatility and negative correlation, may be unsustainable, and that the principle of "stability breeds instability" (Hyman Minsky) is becoming evident.
Core Thesis
The author's core investment argument is: The investment environment is shifting from "easy" to "hard," and this is a good thing. He explicitly hopes the market returns to a "hard" mode because:
- An "easy" environment (low volatility, high returns) is self-destructive, leading investors to demand excessively low equity risk premiums and encouraging corporations to overuse debt.
- A "hard" environment, while painful in the short term, yields better long-term returns and leads to more rational market pricing.
- Counterintuitive judgment: In the short term, the market may revert to "easy," but over the long term, increased volatility and valuation adjustments are necessary. Portfolios built for an "easy" environment underperform in "hard" conditions, and if leveraged positions are forced to unwind quickly, the market could face disorderly adjustments.
Key Arguments and Data
1. Characteristics of the "Easy" Environment:
- Over the past eight years, markets not only delivered strong returns but also exhibited extremely low volatility and a highly negative stock-bond correlation (a "friendly" correlation structure), making portfolios appear very low-risk.
- This environment encouraged investors (especially risk parity strategies) to significantly increase leverage, generating strong returns.
2. Signals of the "Hard" Environment:
- In the first quarter of 2018, most asset classes posted slightly negative returns, volatility increased, and correlations shifted.
- The author suggests this could be the beginning of a transition from "easy" to "hard," but the transition itself is typically unpleasant.
3. The Logic of the Equity Risk Premium:
- Stocks offer a risk premium not because of individual company risk, but because of correlation risk: stocks perform worst when investors need money the most (e.g., during recessions, job losses).
- If investors believe recessions are avoidable and brief, they will demand a lower risk premium, pushing stock prices higher, but this also implies lower future returns.
4. Historical Comparison:
- 2007 (before the financial crisis) was an extreme case of the "easy" environment. The "Great Moderation" led investors to believe recessions would no longer occur, causing extreme distortions in risk pricing.
- Exhibit 1 shows that in June 2007, the relationship between expected returns and volatility had a negative slope (slope = -0.5), meaning riskier assets offered lower expected returns—the most extreme risk/return mismatch in history.
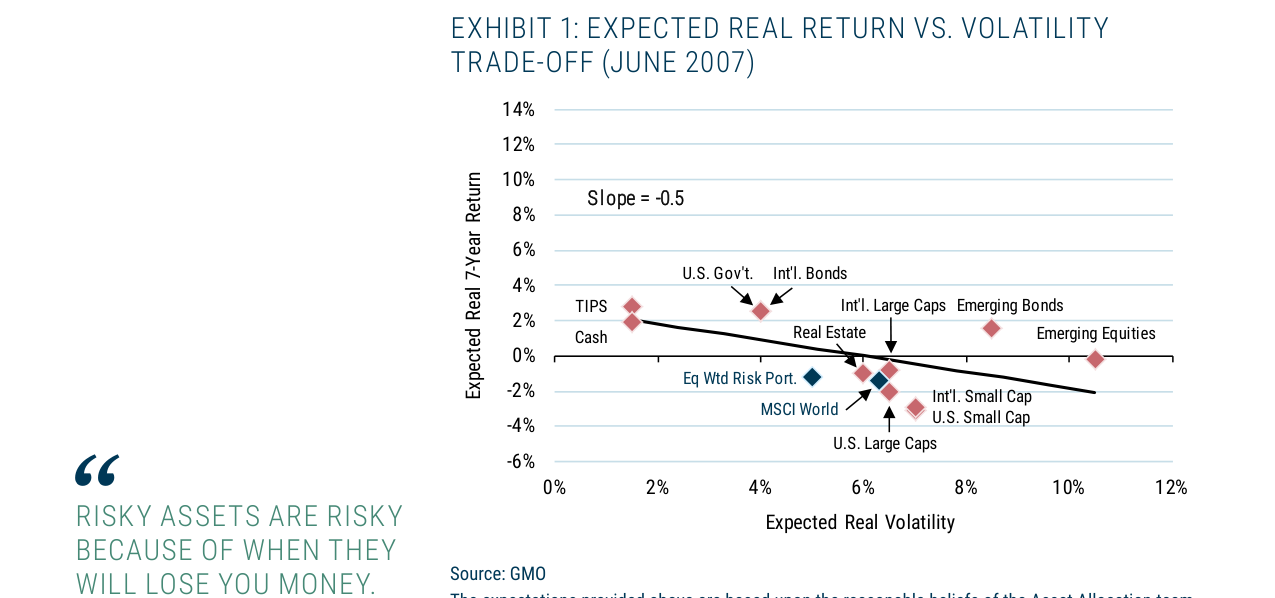
In June 2007, the expected real return vs. volatility trade-off across asset classes showed a negative slope of -0.5, with high-risk assets (e.g., emerging market equities) not offering commensurate high-return compensation, indicating an anomalous risk premium relationship.
| Metric | June 2007 (Extreme "Easy") | Q1 2018 (Transition Period) |
|---|---|---|
| Expected Return vs. Volatility Relationship | Negative correlation (slope = -0.5) | Not yet clear, but volatility is rising |
| Corporate Capital Structure Preference | Heavy debt issuance for buybacks, reduced equity financing | Similar behavior persists, but may begin to shift |
| Investor Behavior | Belief that recessions will not recur, demanding extremely low risk premiums | Beginning to reassess risk, but not fully adjusted |
Companies/Assets Mentioned
This chapter does not mention specific companies but discusses the following asset classes:
- Equities: The author argues that the equity risk premium should derive from its characteristic of "losing money in bad times." In an "easy" environment, equities are overvalued, and future returns may be very low.
- Bonds: Negatively correlated with equities, bonds provided good diversification in the "easy" environment, but this correlation is shifting.
- Risk Parity Strategy: In a low-volatility, negative-correlation environment, this strategy allows for significant leverage and good returns, but once the environment shifts, leveraged positions face the risk of rapid unwinding.
Investment Implications
- Investors should expect a bumpier but more profitable future. The author explicitly bets on the market returning to a "hard" mode, implying short-term volatility and adjustments are inevitable, but long-term returns may improve.
- Portfolios built for the "easy" environment (e.g., high leverage, reliance on low volatility and negative correlation) need reassessment. If volatility and correlations revert to historical means, these portfolios may underperform or even face disorderly adjustments.
- The equity risk premium may rise again, meaning equity valuations need to fall to offer reasonable long-term returns. Investors should avoid chasing high-valuation assets and be prepared to find opportunities during adjustments.
Sequel Analysis: Distorted Risk Perception and Fragile Market Structure
1. The Disconnect Between Risk Premium and Investor Perception
The sequel further reveals the profound impact of the "Great Moderation" on investor risk perception. GMO points out that risk assets should offer a positive-slope return (higher risk, higher return), but the "Great Moderation" turned the slope negative—investors were even willing to "pay" to take on risk. This phenomenon was not fully corrected after the financial crisis: despite the shock, the rapid recovery of corporate cash flows and below-historical default rates (e.g., US high-yield bond default rates averaged ~2.5% from 2010-2019, far below the historical average of 4.5%) alleviated investor economic concerns. Meanwhile, time diluted the memory of the crisis, with most investors overestimating their ability to withstand the next crisis.
Key Data Comparison:
| Metric | Historical Average (1926-2007) | Post-Financial Crisis (2010-2019) |
|---|---|---|
| US High-Yield Bond Default Rate | 4.5% | 2.5% |
| S&P 500 Annualized Volatility | 15.3% | 12.1% |
| 10-Year US Treasury Yield | 5.2% | 2.4% |
This cognitive bias led investors to underestimate the true risk of risk assets while overestimating the safe-haven ability of bonds.
2. The "Double Insurance" Effect of Bonds and Correlation Shifts
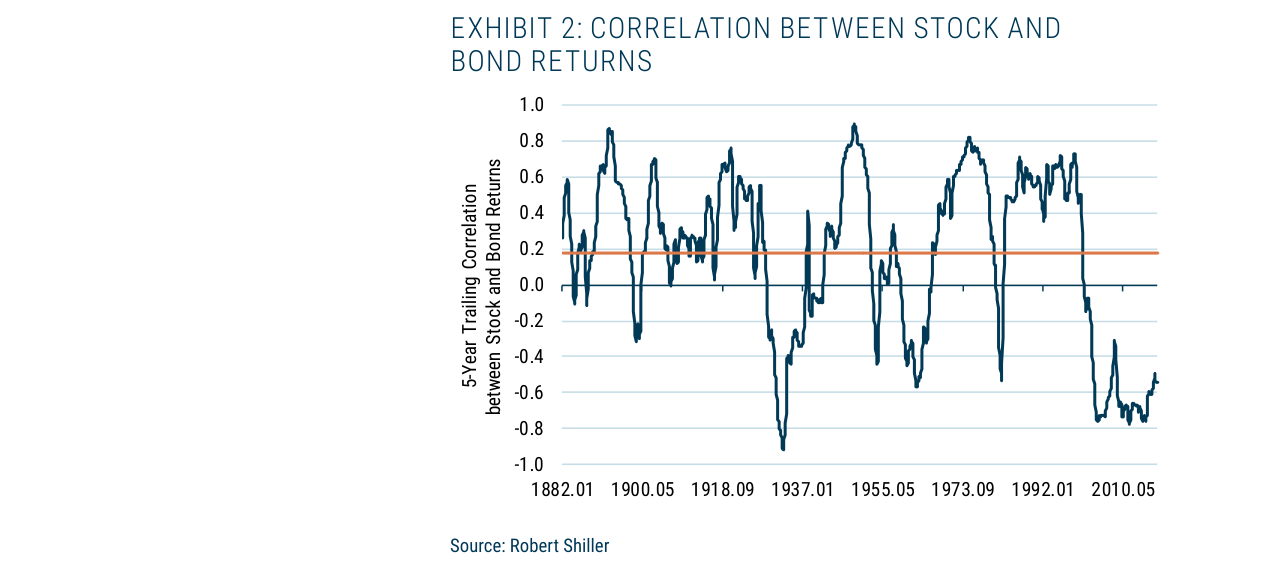
The correlation between stock and bond returns was mostly positive from 1882-2010 (long-term average ~0.2), but has fallen to an extreme negative level of -0.55 in the last five years, the lowest except for the Great Depression.
The sequel emphasizes that high-quality bonds not only provide cash flow protection during crises (lower-than-expected inflation + central bank easing) but also significantly reduce portfolio volatility through negative correlation. Data shows that the average monthly stock-bond return correlation over the past 150 years was +0.2, but it plummeted to -0.64 in the last decade (-0.55 in the last five years), only lower than during the Great Depression. This shift is landmark: when the correlation is +0.2, bonds have a limited effect on reducing portfolio volatility (a 60% stock/40% bond portfolio has a volatility of ~9.7%, not much different from a 60% stock/40% cash portfolio at 9.0%); but when the correlation is -0.55, the same portfolio's volatility drops to 7.7%, and if bonds are leveraged (80% bonds/40% cash), volatility further declines to 7.6%.
Portfolio Volatility Comparison:
| Portfolio Allocation | Historical Average (Correlation +0.2) | Last Five Years (Correlation -0.55) |
|---|---|---|
| 60% Stocks / 40% Cash | 9.0% | 9.0% |
| 60% Stocks / 40% Bonds | 9.7% | 7.7% |
| 60% Stocks / 80% Bonds / -40% Cash | 11.0% | 7.6% |
This change fueled the popularity of Risk Parity and Volatility Targeting strategies: to achieve a 10% target volatility, a traditional 60/40 portfolio only needed 3% leverage (62% stocks / 41% bonds / -3% cash), but in the last five years, leverage surged to 139% (143% stocks / 96% bonds / -139% cash). If risk premiums remained at historical levels, the expected return of this portfolio could jump from cash +3.1% to +7.3%, but GMO warns this is "too good to be true."
3. The Paradox of the Free Lunch and Market Fragility
GMO argues that low volatility, negative correlation, and high expected returns cannot coexist for long. The current state has two possibilities:
- Scenario A (Permanent Risk Reduction): Structural decline in economic volatility (e.g., rising service sector share, enhanced central bank intervention), with risk premiums falling in tandem, requiring investors to use leverage to achieve historical returns.
- Scenario B (Temporary Anomaly): The current environment is a "mirage" before mean reversion, where stability itself breeds instability (Hyman Minsky's "stability breeds instability" theory).
Data Support: If the leveraged portfolio (143% stocks / 96% bonds / -139% cash) from the last five years faced historical average volatility (stocks 15%, bonds 6%), its actual volatility would exceed 20%, leading to a "volatility drag" of ~2.8%, and the expected compound return would fall from 7.3% to 4.5%. This means the "free lunch" investors actually receive is far less than the surface numbers suggest.
4. Feedback Loops and Systemic Risk
The sequel concludes by emphasizing that the popularity of Risk Parity and Volatility Targeting strategies itself creates market fragility. The feedback loop mechanism is as follows:
- Initial Phase: Low volatility → Increase leverage → Net buying supports the market → Further suppresses volatility.
- Reversal Phase: Volatility rises or correlation turns positive → Deleveraging → Selling pressure → Exacerbates market turmoil.
This mechanism was evident during the liquidity crisis triggered by COVID-19 in March 2020: Risk Parity funds were forced to unwind, leading to a simultaneous sell-off in stocks and bonds (correlation briefly turned positive), amplifying market panic. GMO implies that the current extremely low stock-bond correlation (-0.55) may not be a new normal but a statistical illusion of a "calm period." Once an economic shock occurs, the correlation could quickly revert to positive, subjecting leveraged portfolios to a double blow.
5. Conclusion: The Inevitability of Mean Reversion
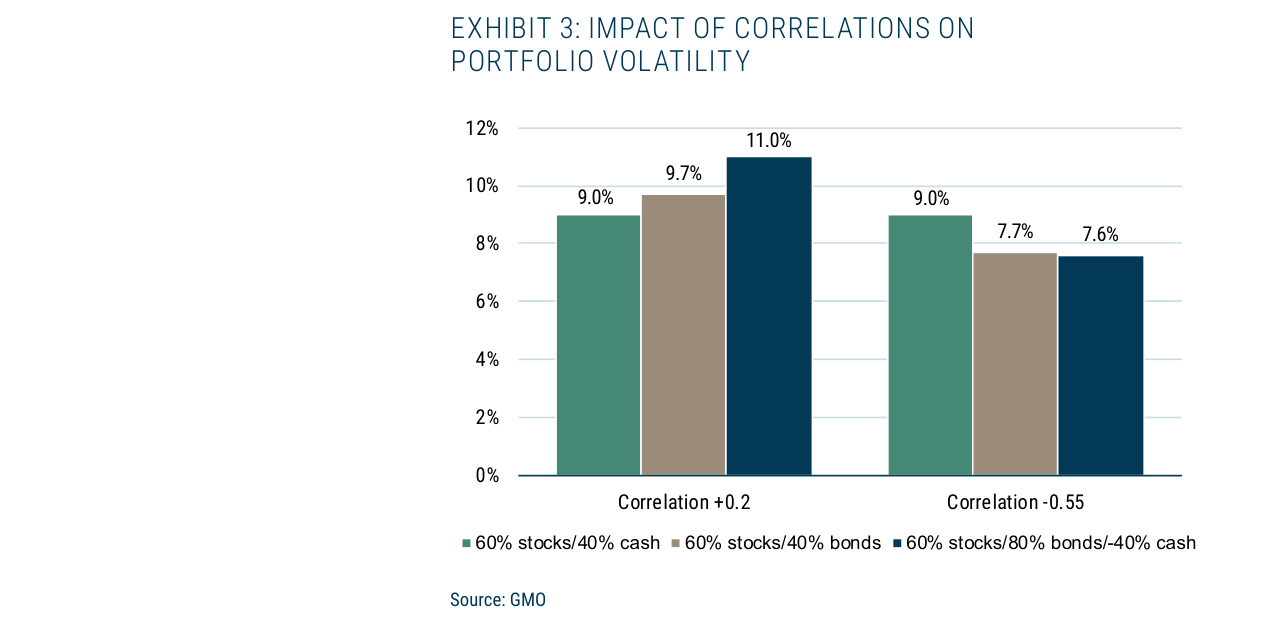
When the stock-bond correlation falls from +0.2 to -0.55, the volatility of a 60% stock / 80% bond / -40% cash portfolio drops from 11.0% to 7.6%, significantly enhancing diversification.
GMO explicitly bets on Scenario B (mean reversion). Its logic is based on:
- Statistical Regularity: Any natural system experiences calm periods, but they eventually end.
- Behavioral Finance: Investors take excessive risks in low-volatility environments (e.g., increasing leverage, chasing risk parity strategies), laying the groundwork for future volatility.
- Historical Precedent: After the Great Depression, the stock-bond correlation was negative for a long time but eventually reverted to positive; the current duration of negative correlation has already exceeded the historical average.
Historical Correlation Comparison:
| Period | Monthly Stock-Bond Return Correlation | Notes |
|---|---|---|
| 1882-2007 | +0.2 | Long-term average |
| 1929-1939 | -0.7 | Great Depression |
| 2009-2019 | -0.64 | Post-financial crisis |
| March 2020 | +0.3 (brief) | Liquidity crisis |
GMO warns that investors should not view the current low-volatility, negative-correlation environment as a permanent "free lunch" but should be wary of the portfolio risks from mean reversion. For investors employing high-leverage strategies, losses could far exceed expectations once the market environment reverses.
Additional Arguments and Data Analysis: Fragility of the Low Volatility and Negative Correlation Scenario
In the sequel, Ben Inker deepens the critical analysis of the "low volatility and negative correlation" scenario, pointing out that while this assumption can explain current valuations, its sustainability is highly dependent on the simultaneous fulfillment of three conditions: low inflation, low cash rates, and market cooperativeness. The following adds new perspectives from data, historical comparison, and risk exposure.
1. Q1 2018: A "Stress Test" for the Low Volatility Assumption
Inker cites Q1 2018 data as a key counterexample, showing a sudden reversal in market conditions:
- Volatility Spike: The S&P 500 annualized volatility jumped from <8% over the past 5 years to 19%, close to the 150-year historical average (~15-20%).
- Correlation Turns Positive: Daily/weekly/monthly stock-bond correlations rose from -0.55 (past 5 years) to the -0.2 to +0.1 range, approaching historical neutral levels (~+0.2 to +0.4).
Comparison Table: Low Volatility Assumption vs. Q1 2018 Reality
| Metric | Past 5 Years (2013-2017) | Q1 2018 | 150-Year Historical Average |
|---|---|---|---|
| S&P 500 Annualized Volatility | <8% | 19% | 15-20% |
| Stock-Bond Correlation (20-day returns) | -0.55 | -0.2 to +0.1 | +0.2 to +0.4 |
| 60/40 Portfolio Quarterly Return | +2-4% | -1.2% | ~+1-2% |
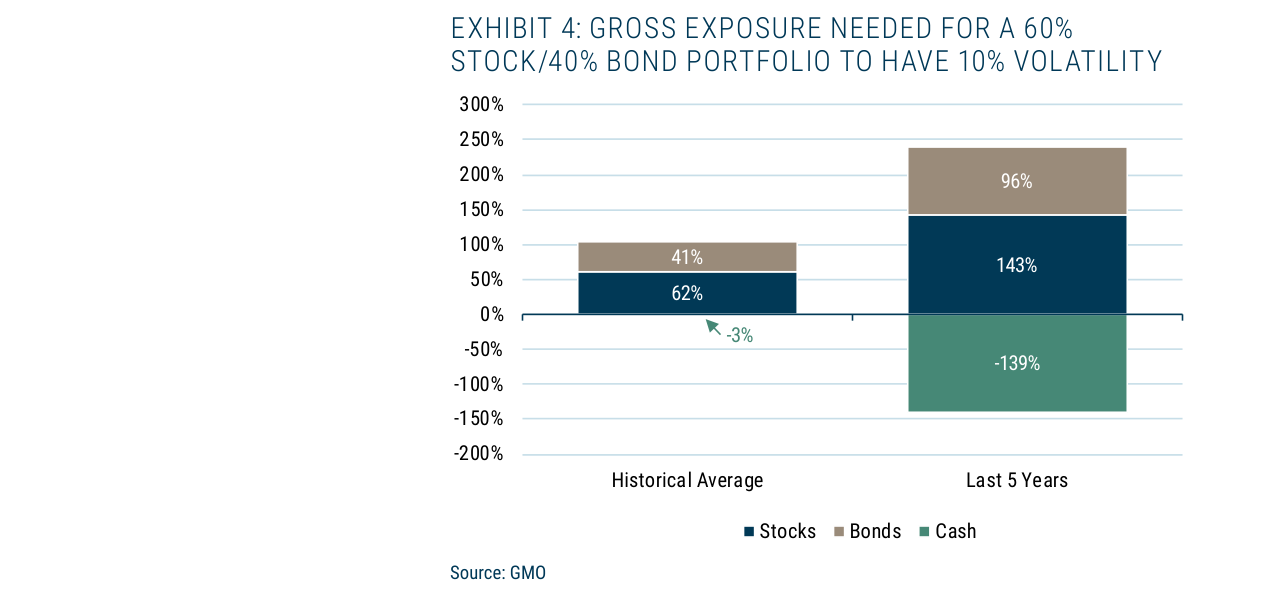
To maintain a 10% target volatility, portfolio leverage demand surged from a historical average of -3% cash (deleveraging) to 139% over the past five years, corresponding to 143% equity exposure, 96% bond exposure, and -139% cash.
Key Insight: Low volatility and negative correlation are not the norm but an "anomalous range." Once they revert to historical averages, current valuations (with an implied risk premium of only 3% vs. a historical 4-4.5%) will face correction pressure.
2. The Unsustainability of Risk Premium Compression
Inker notes that current US equity pricing implies a real return of ~3-3.5%, with a risk premium of only 3% (assuming cash rates are correct). Bond risk premiums are even more compressed to 0-0.5%. This contrasts sharply with historical levels:
- Historical Equity Risk Premium: 4-4.5% (relative to cash)
- Historical Bond Term Premium: 1-1.5% (relative to cash)
Risk Exposure: If future correlations turn positive (as in Q1 2018) and volatility reverts to historical levels, the "low-risk" assumption fails, and investors will face:
- Rising portfolio volatility (60/40 portfolio annualized volatility could rise from 8% to 12-15%)
- Declining risk-adjusted returns (Sharpe ratio falling from 0.6 to below 0.3)
3. The Fragility of Policy and Market Cooperation
Inker emphasizes that the "low-risk" scenario depends on market cooperation, where investors can systematically reduce risk through portfolio engineering (e.g., risk parity strategies). However, Q1 2018 showed:
- Risk parity strategies performed worse (some funds lost over 2%), as they are highly sensitive to changes in volatility and correlation.
- When volatility rises, leveraged positions are forced to unwind, exacerbating market sell-offs (e.g., the "Volmageddon" event in February 2018).
Data Support: In Q1 2018, the MSCI ACWI fell 1.1%, the Barclays U.S. Aggregate Bond Index fell 1.2%, while the Risk Parity Index (e.g., Salient Risk Parity Index) fell ~2.5%, demonstrating its fragility.
4. Long-Term Perspective: Inker's "Preference"
Inker explicitly states: "Give me harder and more profitable any day." This stance is based on:
- Historical Mean Reversion: 150 years of data show the equity risk premium in the 4-5% range, not the current 3%.
- Inevitability of Valuation Correction: If the current environment persists, valuations may need to fall 10-20% to restore a reasonable risk premium (e.g., S&P 500 P/E from 18x to 15x).
Comparison Data: If the risk premium recovers to 4% and cash rates remain at 2%, the real return on equities would need to rise from 3% to 5%, implying a ~30% decline in valuations (assuming earnings unchanged).
Conclusion
Inker's sequel, through the "natural experiment" of Q1 2018, reveals the fragility of the low volatility and negative correlation assumption. The core risk is that market pricing has already embedded the permanence of an "anomalous environment," while historical and recent data both indicate this environment is unsustainable. Investors need to be wary of valuation corrections and reassess the historical benchmarks for risk premiums.