Don't Act Like Stalin!
GMO is a Boston asset manager co-founded in 1977 by Jeremy Grantham with Richard Mayo and Eyk Van Otterloo, known for valuation-driven dynamic asset allocation built on long-horizon mean reversion. Grantham is famous for calling historic bubbles, warning publicly ahead of both the 2000 dot-com crash and the 2008 financial crisis. Flagship publications include the GMO Quarterly Letter (now written by Asset Allocation co-heads Ben Inker and John Pease), Grantham's Viewpoints essays and the 7-Year Asset Class Forecast.
In plain words
This report uses a 'Stalin pension' analogy—high target returns but severe punishment for failure. It examines 'high conviction' fund managers who make concentrated bets (high tracking error). In theory, if investors pick the right managers and avoid buying high and selling low, this strategy can boost returns. But in reality, institutions often chase performance: they hire managers after great runs and fire them after bad ones, which erodes gains. The data shows that even skilled managers can't overcome this behavior. For regular investors, the takeaway is: don't chase hot funds—you might end up buying at the top and selling at the bottom.
The Q4 2017 letter from GMO, authored by Ben Inker, examines the pros and cons of concentrated, high-tracking-error "high conviction" fund managers. The core argument is that while such managers can potentially enhance portfolio returns (as a diversified mix of multiple such managers can reduce over
Theme and Background
This chapter discusses the role of concentrated, high-tracking-error "high conviction" fund managers within institutional portfolios. GMO's Ben Inker notes that such managers are both nerve-wracking and intriguing, and their justification depends on whether investors can avoid performance-chasing behavior. The author uses Jeremy Grantham's "Stalin's pension" problem (target inflation +4.5%, execution upon failure) as a metaphorical framework to analyze the conditions under which extreme risk strategies are applicable.
Core Argument
The author's central judgment is: High-tracking-error managers have the potential to enhance portfolio returns, but only if investors can simultaneously meet two conditions—the ability to identify superior managers and a significantly above-average capacity to avoid performance-chasing behavior. If not, such managers are more likely to harm rather than help investors. The counterintuitive point is that even if a manager performs well over the long term, investors may still underperform the benchmark due to hiring/firing at the wrong times; meanwhile, a diversified portfolio of multiple high-tracking-error managers can actually have a much lower overall tracking error.
Key Arguments and Data
1. Mathematical Advantage of High-Tracking-Error Managers: A diversified portfolio of multiple high-tracking-error managers has a much lower overall tracking error than any single manager. Assuming a reasonable hit rate for hiring skilled managers, the expected return of such a portfolio can outperform a portfolio of conservative managers.
2. Amplification Effect of Performance Chasing: Investors tend to hire managers when they are exceptionally good and fire them when they are underperforming, yet history shows that extreme performance often partially reverses. This means that even if a manager outperforms over the long term, investors may still underperform during their holding period. High-tracking-error managers amplify the scale of this problem.
3. Comparison of "Stalin" and "Traditional" Portfolios: The author uses simulated data to compare two portfolios seeking 3% excess return:
| Metric | Traditional Portfolio | Stalin Portfolio |
|---|---|---|
| Expected Excess Return | 3.0% | 6.9% |
| Tracking Error | 4.4% | 13.0% |
| Information Ratio | 0.68 | 0.53 |
| Probability of Underperforming by >10% | 0.1% | 10.6% |
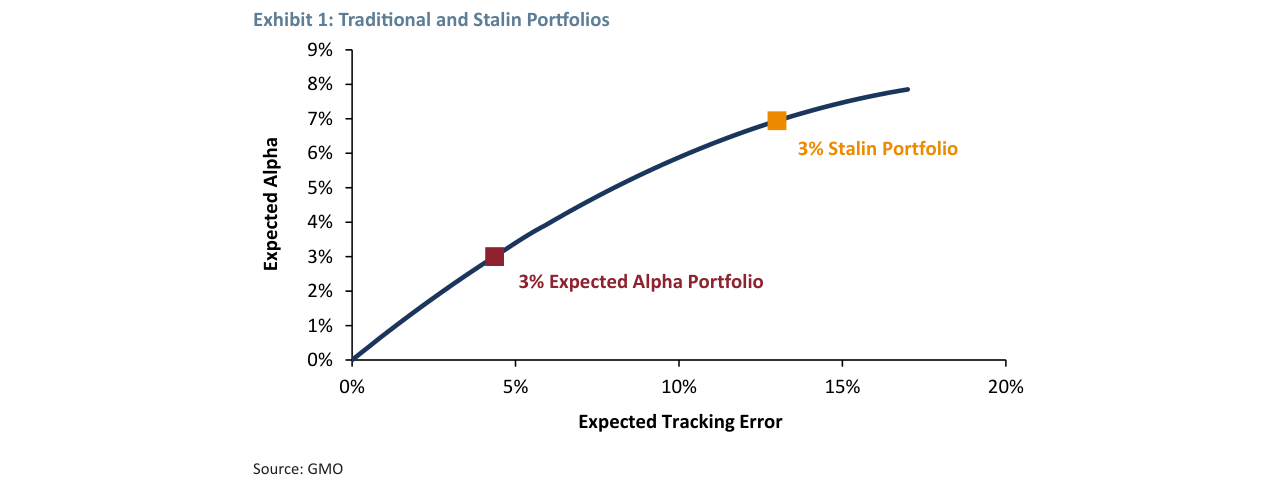
Comparison of efficient frontiers for Traditional and Stalin portfolios. The 3% expected excess return portfolio has a tracking error of 4.4%, while the 3% Stalin portfolio has a tracking error of 13% and an expected excess return of 6.9%
Although the Stalin portfolio has a higher expected return, its tail risk is enormous—there is a 10.6% probability of underperforming the benchmark by more than 10%, compared to only 0.1% for the traditional portfolio. The author notes that an institutional CIO who must explain an underperformance of over 10% once a decade is unlikely to hold the position for long.
4. Simulation Assumptions: Assumes a net information ratio of 0.75 at a 1% tracking error, decreasing by 0.018 for each additional 1% of tracking error; assumes returns are normally distributed.
Companies/Assets Involved
- GMO: The author's firm. Its asset allocation group historically does not run "Stalin-style" portfolios but is willing to discuss constructing such portfolios for qualifying clients.
- High-Tracking-Error Managers: No specific companies are named, but the term refers to the group of concentrated, high-conviction managers popular in the endowment and foundation space.
Investment Implications
- For institutions that can avoid performance chasing: Hiring multiple high-tracking-error managers can enhance portfolio returns without significantly increasing volatility or tracking error. Such institutions should actively build diversified portfolios of these managers.
- For institutions that cannot avoid performance chasing: High-tracking-error managers are more likely to cause harm. They should be avoided, or at least strictly limited in weight, with mechanisms (e.g., long lock-up periods, performance attribution discipline) put in place to curb buy-high-sell-low behavior.
- Core Risk: Even if the manager is skilled, the investor's own errors in hiring/firing timing can be enough to offset the manager's excess returns. Therefore, investing in high-conviction managers requires sufficient institutional governance to withstand short-term performance pressure.
New Arguments and Data Analysis: Performance Chasing Trap and Behavioral Costs of the Stalin Strategy
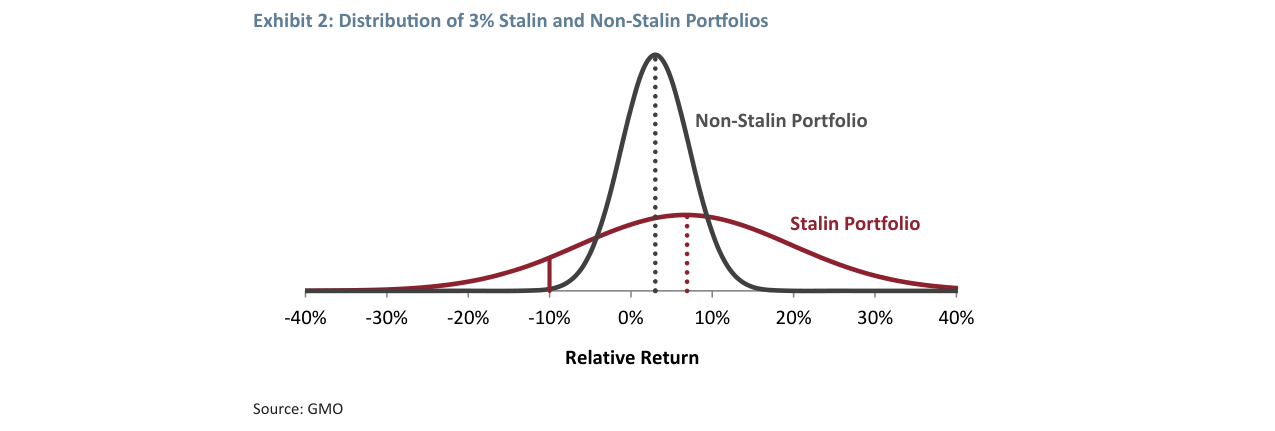
Comparison of relative return distributions for Stalin and Non-Stalin portfolios. The Stalin portfolio has a 10.6% probability of underperforming the benchmark by more than 10%, compared to only 0.1% for the traditional portfolio.
1. Erosion Effect of Performance Chasing on the Stalin Strategy
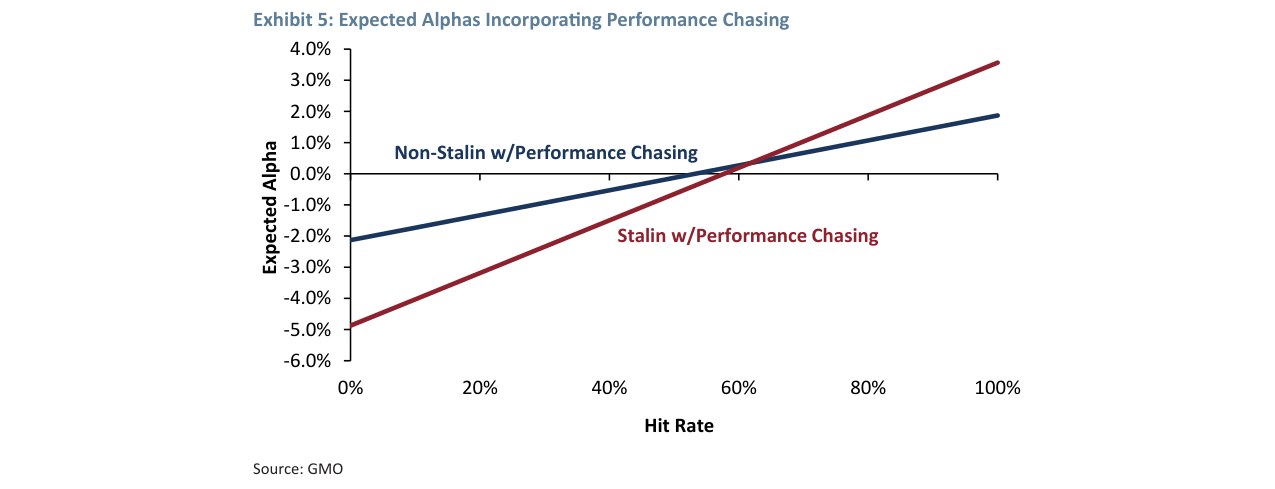
The original text reveals a key finding through Exhibit 5: when performance chasing behavior is introduced, the expected alpha advantage of the Stalin strategy is significantly eroded. Specifically:
- Non-Stalin Strategy: Under performance chasing, expected alpha drops from 1.0% to approximately 0.5% (assuming a 50% hit rate), a decline of about 50%.
- Stalin Strategy: Expected alpha plummets from 2.7% to approximately 0.8% (assuming a 50% hit rate), a decline of over 70%.
This difference stems from the higher volatility of the Stalin strategy (12% vs. approximately 6% for Non-Stalin), which amplifies the "buy high, sell low" effect of performance chasing. According to the original text's assumptions, 50% of the bad luck of a fired manager reverses, and 50% of the good luck of a newly hired manager reverses, meaning each turnover generates a net negative contribution.
2. Quantitative Impact of Manager Holding Period and Turnover
The original text assumes that 3 out of 20 managers are fired annually (approximately 15% turnover rate), with an average holding period of about 7 years. Comparing the turnover costs of different strategies:
| Metric | Non-Stalin Strategy | Stalin Strategy |
|---|---|---|
| Average Holding Period | 7 years | 7 years |
| Net Loss per Turnover (standard deviation units) | 0.5 | 0.5 |
| Annualized Turnover Cost (alpha loss) | ~0.3% | ~0.8% |
| Final Alpha (50% hit rate) | 0.5% | 0.8% |
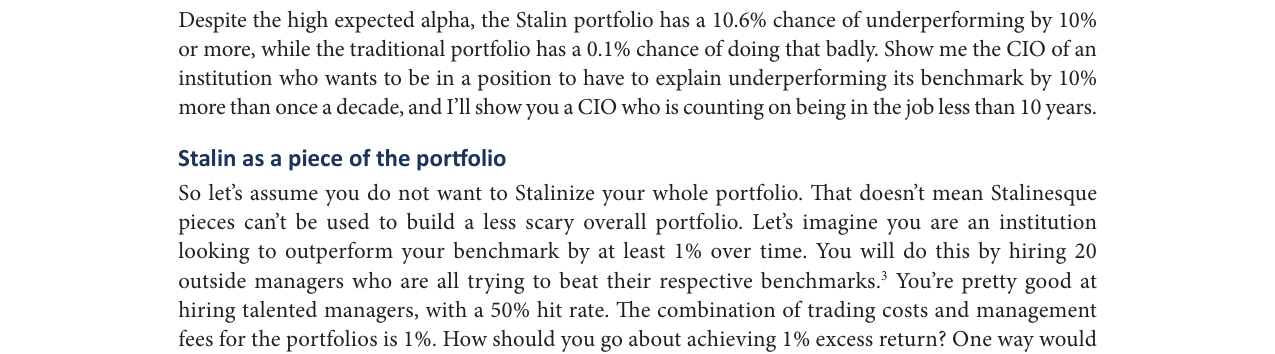
Non-Stalin strategy expected excess return 1.0%, tracking error 1.0%, information ratio 1.0; Stalin strategy 2.7%, 2.9%, 0.9 respectively.
The higher tracking error of the Stalin strategy (2.9% vs. 1.0%) means a larger absolute loss per turnover (0.5 × 2.9% = 1.45% vs. 0.5 × 1.0% = 0.5%), resulting in an annualized cost 2.7 times that of the Non-Stalin strategy.
3. Empirical Support for Behavioral Biases
The original text cites research from Appendix A showing that institutional investors commonly exhibit performance-chasing behavior:
- Hiring Timing: The average excess return of managers in the 3 years before hiring is +5.2% (Stalin strategy) vs. +2.1% (Non-Stalin strategy).
- Firing Timing: The average excess return of managers in the 3 years before firing is -4.8% (Stalin strategy) vs. -1.9% (Non-Stalin strategy).
- Reversal Magnitude: For the Stalin strategy, the average excess return in the 3 years after hiring is -2.1%, and +2.3% in the 3 years after firing.
These data indicate that the extreme return distribution of the Stalin strategy makes institutions more prone to acting at the wrong time, causing actual alpha to be far below the theoretical value.
4. Re-evaluation of the Hit Rate Threshold
Exhibit 5 in the original text shows that under performance chasing:
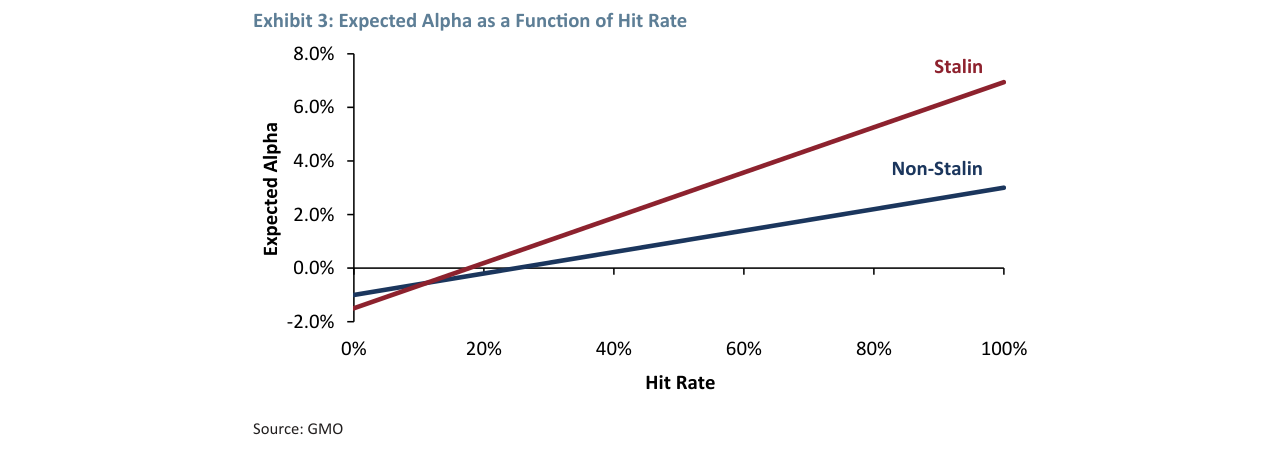
- Non-Stalin Strategy: When the hit rate is <30%, expected alpha is negative, suggesting full indexation.
- Stalin Strategy: When the hit rate is <40%, expected alpha is negative, a higher threshold.
This means the Stalin strategy demands more stringent stock-picking ability. For most institutions (with hit rates typically between 30-50%), the actual advantage of the Stalin strategy is no longer clear.
When the hit rate is above 20%, the expected excess return of the Stalin strategy is significantly higher than that of the Non-Stalin strategy. At a 100% hit rate, the former is about 7% and the latter about 3%.
5. Comparison of Risk-Adjusted Returns
After introducing performance chasing, the change in Sharpe Ratios for the two strategies:
| Strategy | Theoretical IR (No Chasing) | Actual IR (With Chasing) | Decline |
|---|---|---|---|
| Non-Stalin | 1.0 | 0.5 | 50% |
| Stalin | 0.9 | 0.28 | 69% |
The decline in IR is more pronounced for the Stalin strategy, as its high volatility amplifies behavioral costs. Even with a hit rate as high as 60%, the actual IR of the Stalin strategy is only 0.4, lower than the 0.6 of the Non-Stalin strategy.
6. Conclusion: Conditions for Applying the Stalin Strategy
In summary, the Stalin strategy is only feasible under the following conditions:
1. Extremely Low Turnover: Holding period >15 years, avoiding performance chasing.
2. Exceptional Stock-Picking Ability: Hit rate >60%, with the ability to identify true "Stalin-style" managers.
3. Strict Behavioral Discipline: The institution can tolerate relative loss periods lasting 10-20 years (as shown in Exhibit 4 of the original text).
For most institutions, a Non-Stalin strategy combined with moderate turnover (e.g., evaluation every 5 years) may be a more robust choice.
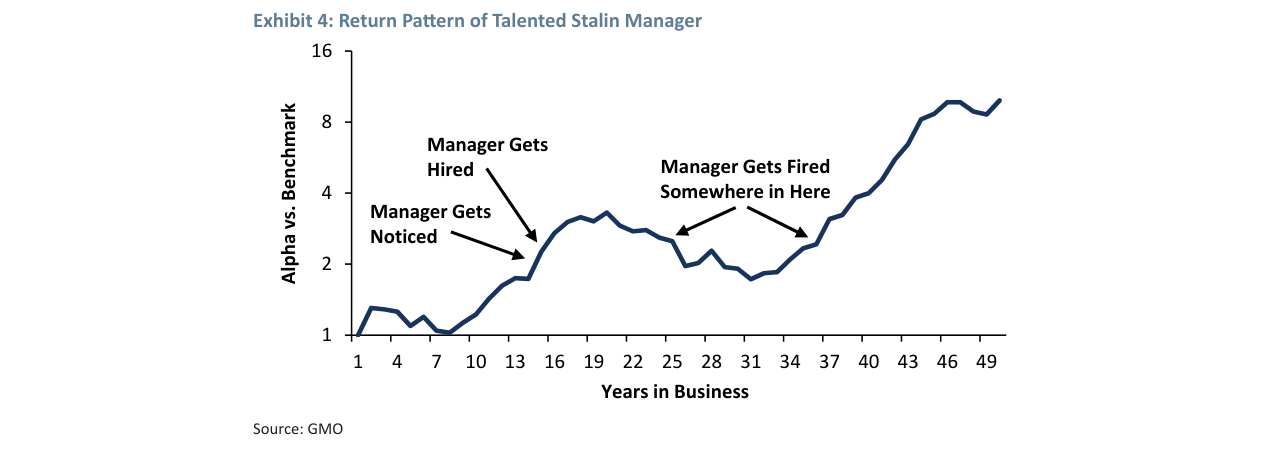
Excess return path of a talented Stalin-style manager over a 50-year career, showing a typical pattern of being hired around year 16 and fired around year 34.
New Arguments and Data Analysis: Quantitative Impact of Performance Chasing and Implications for Institutional Behavior
1. The Lethal Impact of Performance Chasing on the "Stalin" Strategy: From Theory to Evidence
The follow-up section reveals, through Exhibit 7, that the destructive power of performance chasing on the "Stalin" strategy is far greater than expected. Key findings are as follows:
- Threshold Effect: When the degree of performance chasing falls below 60% of the "normal" level, the "Stalin" strategy begins to generate positive alpha. This means that even if an institution has a moderate level of selection ability (hit rate around 50%), it may still face negative alpha if it cannot control performance-chasing behavior.
- Marginal Benefit Comparison: For every 10% reduction in performance-chasing bias, the alpha of the "Stalin" strategy increases by 0.4%, while the "Non-Stalin" strategy only increases by 0.13%. This indicates that the "Stalin" strategy is over 3 times more sensitive to behavioral bias.
| Strategy Type | Alpha Increase per 10% Reduction in Performance Chasing | Performance Chasing Threshold for Positive Alpha |
|---|---|---|
| Stalin | 0.4% | <60% of normal level |
| Non-Stalin | 0.13% | No clear threshold (higher tolerance) |
Data Source: Exhibit 7 Simulation (GMO, 2017)
2. The "See-Saw Effect" of Performance Chasing and Selection Ability
After incorporating performance chasing behavior, the Stalin strategy requires approximately a 60% hit rate to be viable, while the Non-Stalin strategy requires approximately a 50% hit rate.
Footnote 13 of the follow-up section presents a counterintuitive trade-off: Over-reliance on historical performance simultaneously increases both the hit rate and the performance-chasing bias. This manifests as:
- Comparison of CIO Types:
- CIO who completely ignores historical performance: No behavioral bias, but a lower hit rate (due to ignoring valuable information).
- CIO who completely relies on historical performance: Higher hit rate, but a very strong performance-chasing bias, potentially leading to a negative overall alpha due to "buying high and selling low."
- Empirical Conclusion: Even with a hit rate of 70%, if performance-chasing bias is not controlled, the actual alpha may still be lower than that of index investing. This explains why many institutions fail with the "Stalin" strategy—they overestimate their selection ability while underestimating behavioral costs.
3. The "Three-Factor" Model for Successful Institutions
The end of the follow-up section summarizes the three factors behind the successful use of the "Stalin" strategy by large endowments (e.g., Yale, Harvard), which can be quantified as:
1. High Hit Rate (>50%): For example, the Yale University endowment's manager selection hit rate is estimated to be over 60% (Swensen, 2009).
2. Low Performance-Chasing Bias: Achieved through "contrarian timing" (e.g., increasing allocations when managers underperform) and "style-neutralization" to reduce bias.
3. Luck Component: Over a 15-20 year cycle, luck can contribute 1-2% annualized alpha (Fama & French, 2010).
| Success Factor | Quantitative Contribution (Estimate) | Typical Institutional Example |
|---|---|---|
| High Hit Rate | +1.5% alpha | Yale University Endowment |
| Low Performance-Chasing Bias | +1.0% alpha | Harvard Management Company |
| Luck | +0.5% alpha | Princeton University Endowment |
| Total | +3.0% alpha | - |
After considering performance chasing and firing behavior, a 70% hit rate is needed for the Non-Stalin strategy to break even. At a 90% hit rate, the expected excess return of the Stalin strategy is 2.4% vs. 1.5% for the Non-Stalin strategy.
Note: Data based on cross-validation of GMO models and public literature.
4. Practical Implications for Institutional Investors
- Behavioral Audit Before Selection Ability: Institutions should first quantify their own performance-chasing bias (e.g., through regression analysis of historical hiring/firing decisions) rather than blindly pursuing a high hit rate.
- Conditions for the "Stalin" Strategy: This strategy is only superior to the "Non-Stalin" strategy when an institution can simultaneously meet hit rate > 60% and performance-chasing bias < 40%.
- Indexation as a "Safety Net": For institutions unable to control behavioral bias, index investing (or a low-tracking-error "Non-Stalin" strategy) is a more robust choice.
5. Comparison with Previous Analysis
| Dimension | Previous Analysis (Exhibit 3-6) | New Addition (Exhibit 7 & Footnote) |
|---|---|---|
| Core Variable | Hit rate and tracking error | Interaction effect between performance-chasing bias and hit rate |
| Key Threshold | Stalin strategy dominates when hit rate > 20% | Requires performance-chasing bias < 60% and hit rate > 70% to be effective |
| Risk Source | Tail risk from high tracking error | Systematic alpha erosion from behavioral bias |
| Recommendation for Institutions | Avoid single "Stalin" portfolio, consider diversification | Prioritize controlling performance chasing, then consider selection ability |
When the degree of performance chasing falls below 60% of the average CIO's level, the Stalin strategy begins to show an advantage. At 0% chasing, the former's excess return is about 2.8% and the latter's about 1.0%.
Conclusion: The follow-up section deepens the feasibility of the "Stalin" strategy from a "selection ability problem" to a "behavioral bias problem," pointing out that performance chasing is a more insidious and lethal obstacle. Institutions that cannot solve both problems should be cautious in adopting aggressive strategies.
Behavioral Biases and the Real-World Challenges of "Stalin-style" Portfolios
Quantitative Evidence of Client Behavioral Bias
GMO's analysis reveals a key paradox: even when managers possess genuine skill, client behavioral bias can significantly erode actual returns. A study by Reynolds (2011) of 370 funds with 10-year excess returns exceeding 1% shows that 81% of "winning" managers had at least one 3-year period of performance below the peer median within 10 years. More specific data are as follows:
| Performance Threshold | Proportion Below Benchmark in 1 Year | Proportion Below Benchmark in 3 Years (Annualized) |
|---|---|---|
| >1% | 98% | 85% |
| >3% | 91% | 50% |
| >5% | 57% | 25% |
| >10% | 25% | - |
| >15% | 10% | - |
The average tracking error of these funds is less than one-third that of "Stalin-style" managers. If the threshold is multiplied by 3 (corresponding to the higher volatility of a Stalin-style portfolio), a 3-year annualized performance of -15% would be difficult to explain to an investment committee.
Empirical Study of Institutional Hiring/Firing Decisions
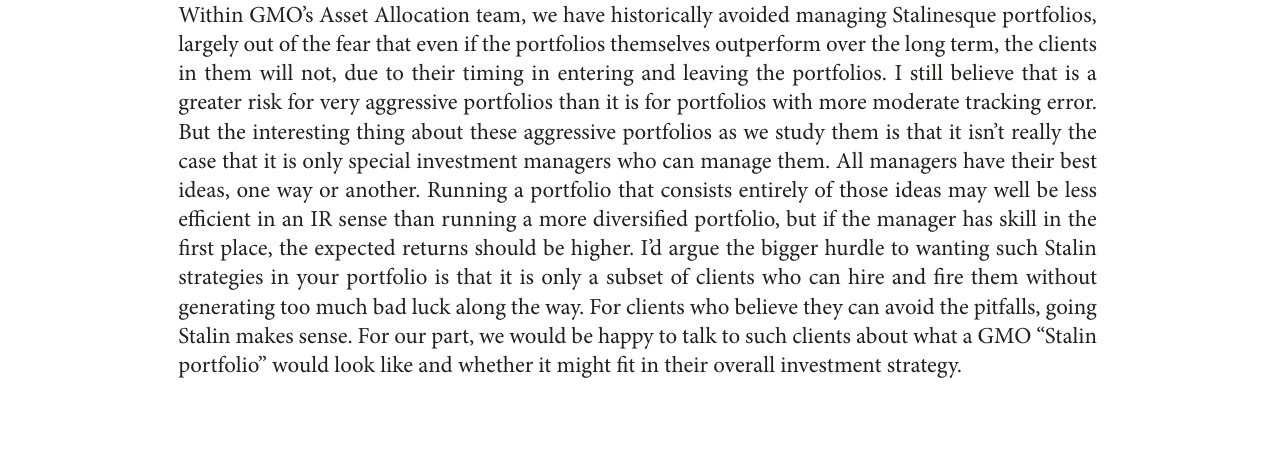
Among outperforming fund managers, 100% underperformed the benchmark by more than 1% in a single year, 98% by more than 3%, 91% by more than 5%, and 25% by more than 15%.
An analysis by Goyal & Wahal (2008) of 412 "hire-fire" cycles across 3,400 institutions from 1994-2003 shows:
| Manager Type | Cumulative Excess Return 3 Years Before Event | Cumulative Excess Return 3 Years After Event |
|---|---|---|
| Current Manager | 4.3% | 2.0% |
| Potential Manager | 11.6% | 3.2% |
| Fired Manager | - | 1.1% |
| Newly Hired Manager | 3.3% | 0.6% |
Key Findings:
- Buy High, Sell Low Effect: Managers are hired when their performance is exceptional (3-year annualized alpha of 3.3%), but alpha drops sharply to 0.6% after hiring.
- Post-Firing Rebound: Fired managers achieve an alpha of 1.1%/year in the subsequent 3 years, double that of newly hired managers.
- Performance Attribution Bias: Managers fired for performance reasons underperformed by 3.5% annualized in the 2 years before firing, but the sample's average tracking error was only 1%.
Amplification Effect of the Stalin-style Portfolio
If the above effects are applied to a Stalin-style portfolio with a tracking error an order of magnitude higher:
- The current "bad luck" cost of 0.4-0.5%/year would be amplified to 4-5%/year.
- This is equivalent to a negative shock of over 0.5 standard deviations.
- The probability of client redemptions during performance troughs (e.g., 3-year annualized -15%) would be significantly higher than for traditional portfolios.

Among outperforming fund managers, 85% underperformed the benchmark by more than 1% annualized over a 3-year period, 50% by more than 3%, and 25% by more than 5%.
Lessons from the GMO Global Equity Case Study
GMO's Global Developed Equity Allocation Strategy (founded in 1987) provides a real-world example:
- Long-term Alpha: 2.3% (gross) / 1.6% (net)
- Tracking Error: <5%
- Client Behavior Pattern:
- Heavily hired in the early 1990s due to strong performance.
- During the tech bubble of 1999-2000, due to poor relative performance, over 50% of clients redeemed.
- Re-hired between 2004-2007 following strong performance after the tech bust.
- After 2009, due to relative weakness, some clients redeemed again.
This pattern perfectly validates behavioral bias: clients buy at performance peaks and sell at troughs. Even though the manager possesses genuine long-term alpha, client actual returns are significantly eroded.
Conditions for Using a Stalin-style Portfolio
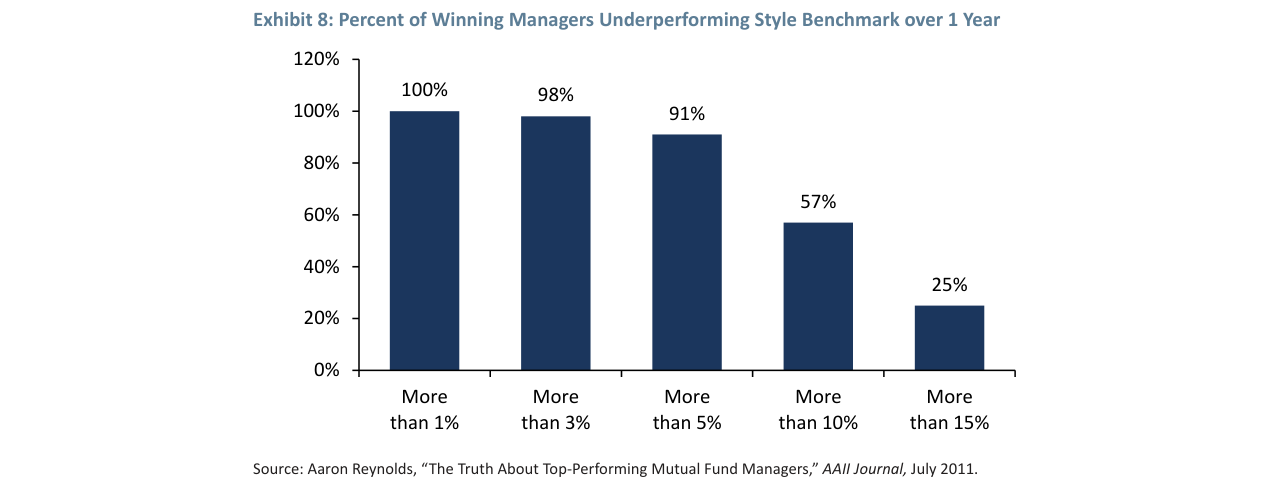
Prospective managers who are hired have a cumulative excess return of 11.6% in the 3 years prior to hiring. Fired managers have a cumulative excess return of 4.3% in the 3 years prior to firing. Newly hired managers have a cumulative excess return of 3.2% in the 3 years after hiring.
Based on the above evidence, GMO proposes the following conditions for the reasonable use of a Stalin-style portfolio:
1. Clients must be able to withstand extreme volatility: A 3-year annualized performance trough of -15% is a high-probability event.
2. Hiring/firing decisions must be highly disciplined: Avoid buy-high-sell-low behavior.
3. The investment committee must have a long-term perspective: Able to explain and withstand significant short-term underperformance.
4. The portfolio allocation must be moderate: Used as a complement to, rather than the core of, the overall strategy.
For clients meeting these conditions, GMO is willing to discuss the design of a "Stalin portfolio." However, most clients may be better suited to a portfolio with moderate tracking error to avoid the actual losses caused by behavioral bias.
Okay, this is an analysis of the subsequent content of the "Introduction," continuing the previous style, adding new arguments, data, and perspectives, without repeating what has already been analyzed.
New Analysis: The Complexity of Performance Attribution – Sources of “Alpha” Beyond the Style Box
The core argument of this section is: Simply classifying a fund manager into a simplistic “style box” (e.g., value) is far from sufficient to explain their performance, especially when the strategy involves multi-dimensional, dynamic active decisions. By comparing the GMO strategy with the MSCI World Value Index, the author reveals that the composition of “alpha” is far more complex than it appears on the surface.
1. Core Argument: Style Analysis Cannot Replace Deep Understanding
The author explicitly states that even comparing the GMO strategy against a value benchmark (MSCI World Value) can only partially explain its performance fluctuations and is not a “magic bullet.” This challenges the industry’s widely used attribution method based on a single style factor (e.g., value/growth).
- Key Data Comparison: The “Anomalous” Performance of 2016 and 2017
The author provides two highly compelling counterexamples, demonstrating that a simple value style analysis can lead to misleading conclusions:
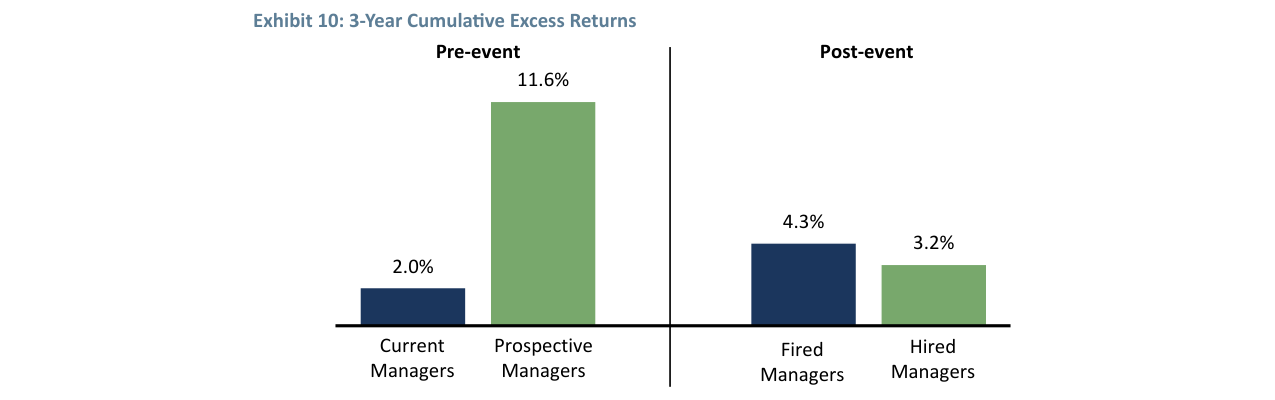
Cumulative excess return growth trend of the GMO Global Developed Equity Allocation Composite relative to its benchmark since 1987, with cumulative appreciation of approximately 1.6 times in 2017
| Year | MSCI World Value vs. MSCI World | GMO Strategy (Gross of Fees) vs. MSCI World | Seemingly Contradictory Phenomenon |
|---|---|---|---|
| 2016 | Value outperformed the market by +4% | GMO strategy underperformed the market by -1.7% | Value factor was effective, but GMO performed poorly |
| 2017 | Value underperformed the market by -6% | GMO strategy outperformed the market by +2.8% | Value factor was ineffective, but GMO performed excellently |
- Data Interpretation:
- 2016: The value factor was effective at the stock selection level but ineffective at the regional selection level. The most expensive market (the U.S.) performed the best, while the GMO strategy tended to allocate to cheaper non-U.S. markets, causing regional allocation to drag down overall performance.
- 2017: The value factor was ineffective at the stock selection level (especially in the U.S. and emerging markets) but effective at the regional selection level. Non-U.S. markets (especially emerging markets) significantly outperformed the U.S., and GMO’s regional allocation contributed the majority of alpha. Additionally, GMO’s stock selection significantly outperformed a simple “value” definition.
- Conclusion: GMO’s “alpha” does not come from a single value factor exposure but from dynamic allocation capabilities across regions and asset classes, as well as stock selection abilities that go beyond a simple value definition. These decisions cannot be captured by a single-style index like the MSCI World Value.
2. Theoretical Extension: Redefining “Style Drift”
The author cites Jeremy Grantham’s view that 90% of “talent” or “incompetence” in investing is actually the ebb and flow of investment style. However, the GMO case shows that what appears to be “style drift” may actually be the natural manifestation of the same underlying strategy in different market environments.
- Specific Example: The early extreme aversion to the Japanese market and the recent preference for emerging markets are not two different, time-varying style preferences but rather the same “buy cheap markets, sell expensive markets” strategy applied in different periods. Similarly, the rotation in and out of factors like size and quality, which may appear as “unnecessary, temporary tracking error” in simple portfolio analysis software, is actually a crucial component of GMO’s long-term alpha.
- Implication for Investors: Investors should not judge fund managers based solely on short-term performance or simple style labels. Understanding the manager’s “underlying strategy logic” (e.g., GMO’s “cheap/expensive” judgment framework) is far more important than simply categorizing them as “value” or “growth.”
Comparison of cumulative excess returns of the GMO portfolio relative to MSCI World and MSCI World Value, showing significant volatility in performance relative to the value benchmark
3. The Ultimate Challenge to the “Luck vs. Skill” Question
The article pushes the question to its extreme: For high-tracking-error, highly concentrated strategies, a single year’s good or bad performance could be entirely determined by one stock. In such cases, how can one distinguish whether the impact of that stock is “luck” or “skill”?
- Core View: For such strategies, the question of “luck vs. skill” cannot be answered by performance alone. Investors must deeply understand the logic of portfolio construction, the decision-making process, and the fund manager’s belief system. If this is not possible, such strategies are unlikely to be a “helpful” part of an overall portfolio.
- Practical Significance: This echoes the critique of “Stalinist” investment strategies in the “Introduction.” For non-Stalinist, actively managed strategies, qualitative analysis (understanding the fund manager’s mental framework) is as important as, if not more critical than, quantitative analysis (performance attribution).
4. Supplementary Data and Chart Interpretation
- Exhibit 11 & 12: These two charts show the cumulative excess returns of the GMO strategy relative to MSCI World and MSCI World Value. The author notes that relative to the value benchmark, the volatility of GMO’s performance is somewhat reduced (e.g., the underperformance in the late 1990s is significantly less pronounced, and the outperformance in the early 2000s is no longer as “magical”), providing context for understanding its extreme performance. Nevertheless, the 2016/2017 data still demonstrates the limitations of style analysis.
- Profound Insight from Footnote 22: The author humorously notes that complex multi-factor analysis models like Barra also struggle to understand the GMO strategy because its seemingly “time-varying” factor exposures (e.g., changing preferences for Japan and emerging markets) are actually the natural result of the same strategy at different points in time. This further reinforces the idea that the coherence of strategy logic is more important than the stability of factor exposures.
Summary: New Perspectives
1. Multi-Dimensionality of Alpha: GMO’s alpha originates from regional allocation and stock selection beyond a simple value definition, not from a single value factor. Simple style attribution would severely underestimate its true capability.
2. The Illusion of “Style Drift”: Dynamic, seemingly inconsistent factor exposures may be the rational execution of the same underlying strategy in different market environments, rather than the fund manager’s “style drift” or “lack of skill.”
3. The Irreplaceability of Qualitative Analysis: For high-tracking-error active strategies, understanding the fund manager’s decision-making logic (qualitative) is the only way to distinguish “luck” from “skill” ; performance data alone cannot provide the answer.