I Want to Break Free, or, Strategic Asset Allocation Is Not Static Allocation
GMO is a Boston asset manager co-founded in 1977 by Jeremy Grantham with Richard Mayo and Eyk Van Otterloo, known for valuation-driven dynamic asset allocation built on long-horizon mean reversion. Grantham is famous for calling historic bubbles, warning publicly ahead of both the 2000 dot-com crash and the 2008 financial crisis. Flagship publications include the GMO Quarterly Letter (now written by Asset Allocation co-heads Ben Inker and John Pease), Grantham's Viewpoints essays and the 7-Year Asset Class Forecast.
In plain words
This report argues that sticking to a fixed mix of stocks and bonds (like 60% stocks, 40% bonds) is a mistake. The real risk isn't price swings (volatility), but losing money permanently. The author says you should adjust your portfolio based on how expensive assets are: buy less when stocks are overpriced (e.g., P/E above 45), and more when they're cheap (P/E below 10). It also criticizes popular strategies like the 'Yale model' and 'risk parity', warning they can cause everyone to pile into the same overpriced assets, creating new dangers. Worth reading because it challenges common investing habits and urges you to think independently.
GMO White Paper (May 2010) by James Montier Using the historical inertia of the QWERTY keyboard as an analogy, the report compares policy benchmarks in the investment field to historical accidents with fundamental flaws. The core argument: strategic asset allocation should not be static but dynamica
Theme and Background
This chapter uses the historical inertia of the QWERTY keyboard as an analogy to compare it to policy benchmarks in the investment field, pointing out that they are essentially products of historical accidents with fundamental flaws. The author argues that the static asset allocation methods commonly adopted by the investment community (such as policy portfolios, risk parity, and lifecycle funds) are not optimal but rather stem from historical path dependence.
Core Argument
The author's core thesis is: Strategic asset allocation should not be static but should be dynamically adjusted based on market valuation opportunities. He explicitly opposes the mainstream view that "policy portfolios determine long-term returns," arguing that policy benchmarks, risk parity, and lifecycle funds share two fundamental errors: mis-measurement of risk (equating volatility with risk) and neglect of valuation (indifference to asset price levels). The author advocates for a benchmark-free, real return focus strategy, flexibly adjusting asset allocation based on the valuation opportunities offered by Mr. Market.
Key Arguments and Data
1. Historical Inertia Analogy: The QWERTY keyboard (designed in 1874) was intentionally designed to slow typing speed due to the mechanical limitations of early typewriters, but user habits became entrenched. Policy benchmarks similarly originate from historical accidents (the rise of Modern Portfolio Theory in the 1970s) and are not optimal solutions.
2. Risk Measurement Issues:
- Modern Portfolio Theory defines risk as standard deviation/volatility, but the author, citing Benjamin Graham, argues that true risk is permanent capital loss.
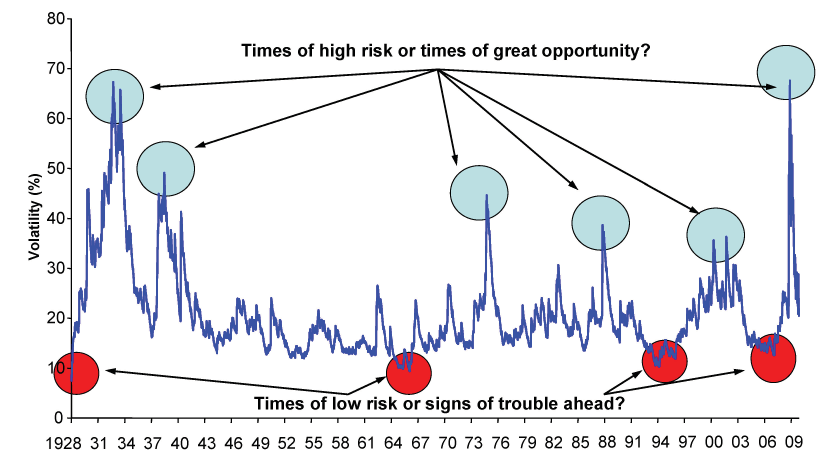
- Key data: S&P 500 volatility was much lower in 2007 (market peak) than in 2009 (market trough), yet investors buying in 2007 faced a greater risk of permanent loss. Volatility creates opportunity, not risk.
3. Valuation Neglect Issues:
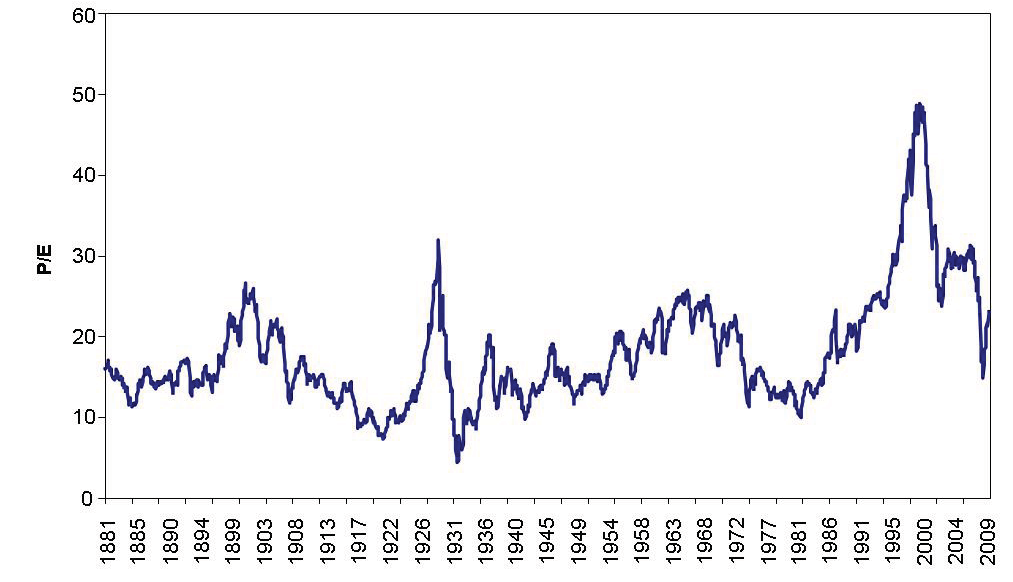
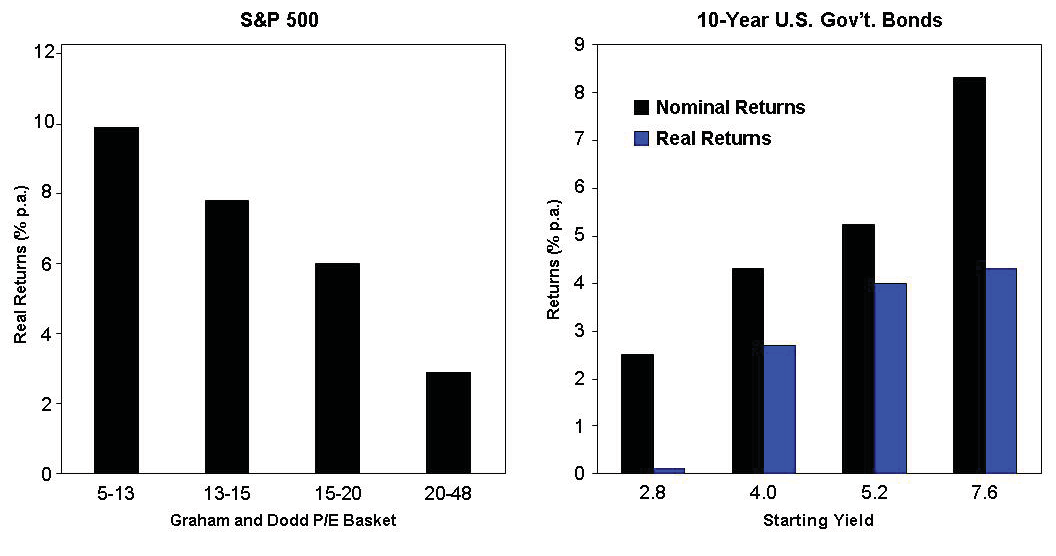
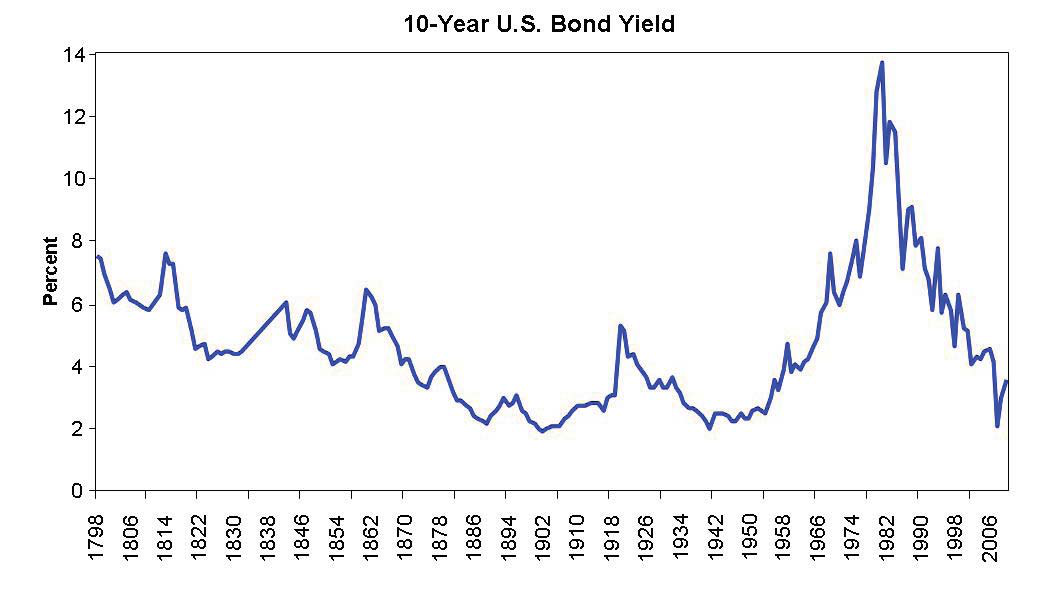
- Policy portfolios require maintaining fixed asset proportions, ignoring valuation levels. The author questions with two extreme cases: Why maintain the same equity allocation when the S&P 500's 10-year cyclically adjusted price-to-earnings ratio (Graham & Dodd P/E) is as high as 45 times versus as low as 10 times? Why hold the same amount of bonds when yields rise from 2% to 12%?
- Historical data (1871-2010) shows that valuation has significant predictive power for the future long-term returns of various asset classes.
4. Benchmarking Behavior Distortion:
- Benchmarking causes managers to focus on relative returns rather than absolute value, substituting tracking error for real risk.
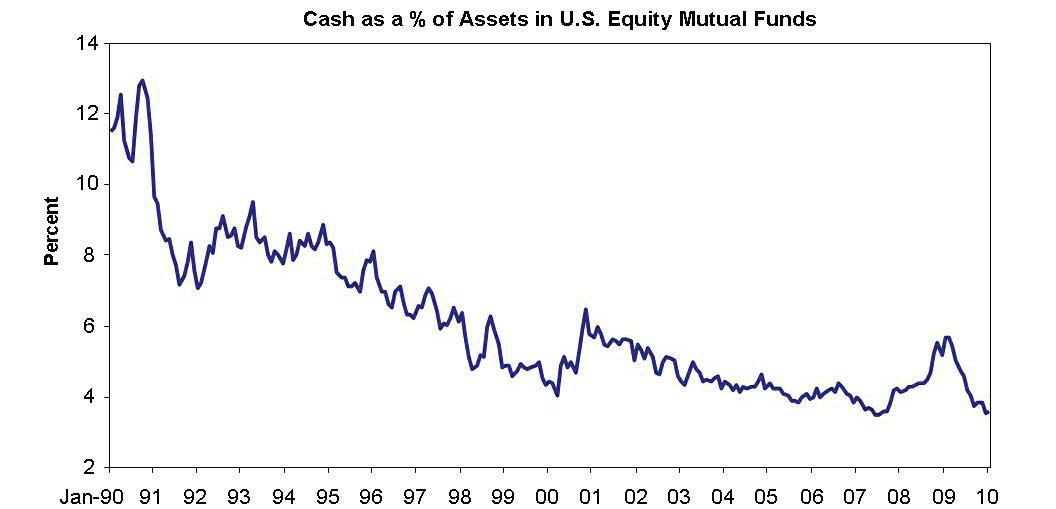
- Quoting Keynes: "Worldly wisdom teaches that it is better for reputation to fail conventionally than to succeed unconventionally," illustrating that in a benchmarked environment, cash is no longer a risk-free asset; the benchmark itself becomes the "risk-free asset."
Companies/Assets Involved
| Company/Asset | Role | Key Data | View |
|---|---|---|---|
| S&P 500 | Representative of US equities | Volatility low in 2007, high in 2009; Graham & Dodd P/E historical range 10-45x | Measuring risk by volatility is misleading |
| US Bonds | Representative of fixed income | Yield historical range 2%-12% | Fixed allocation ignores yield changes |
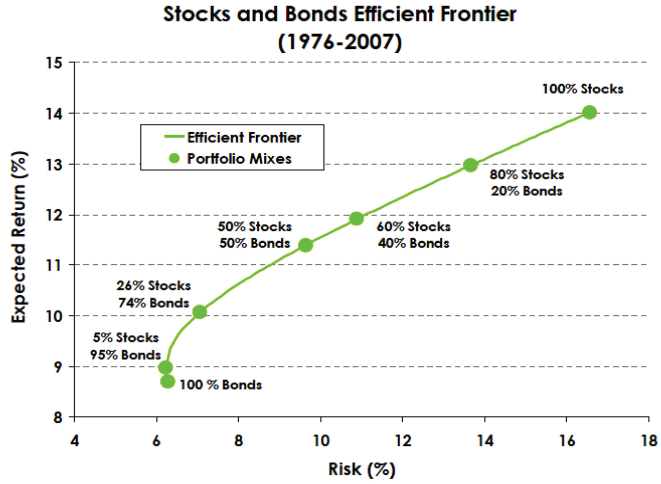
| 60/40 Stock/Bond Portfolio | Industry standard benchmark | Derived from Markowitz mean-variance optimization | A product of historical accident, not optimal |
Investment Implications
1. Abandon Static Policy Benchmarks: Investors should not cling to a fixed 60/40 stock/bond ratio or other static allocations but should dynamically adjust based on market valuation levels. Significantly reduce equities when valuations are excessively high (e.g., P/E > 45x) and significantly increase them when valuations are excessively low (e.g., P/E < 10x).
2. Redefine Risk: Shift the definition of risk from volatility to permanent capital loss. Periods of high volatility (e.g., 2009) may present low-risk opportunities, while periods of low volatility (e.g., 2007) may hide high risk.
3. Adopt a Benchmark-Free, Real Return Framework: Target absolute returns, using cash as the default option. Hold cash when all assets are unattractive; actively allocate when clear value opportunities emerge.
4. Beware of Benchmarking Behavior Distortion: Avoid using tracking error to measure manager performance, as this encourages herding behavior and misses contrarian investment opportunities.
Sequel Analysis: Evolution and Predicament from the "Yale Model" to "Risk Parity"
I. Empirical Challenge in a Low-Return World: The Fourth Problem of Policy Portfolios
In "Problem 4: Not enough return," the author moves from theory to empirics, revealing the fatal blow a low-return environment deals to traditional policy portfolios. Key data is as follows:
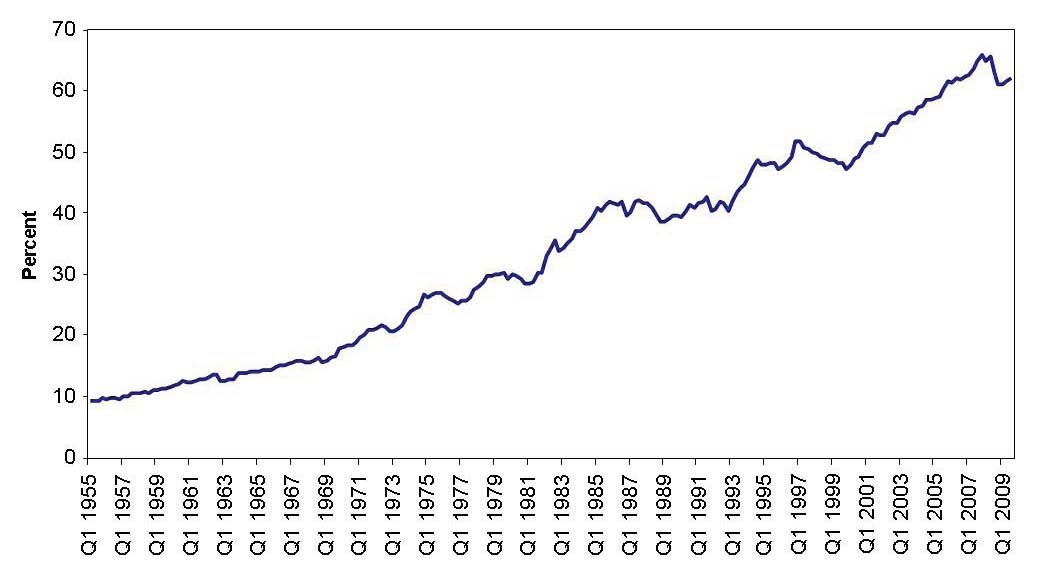
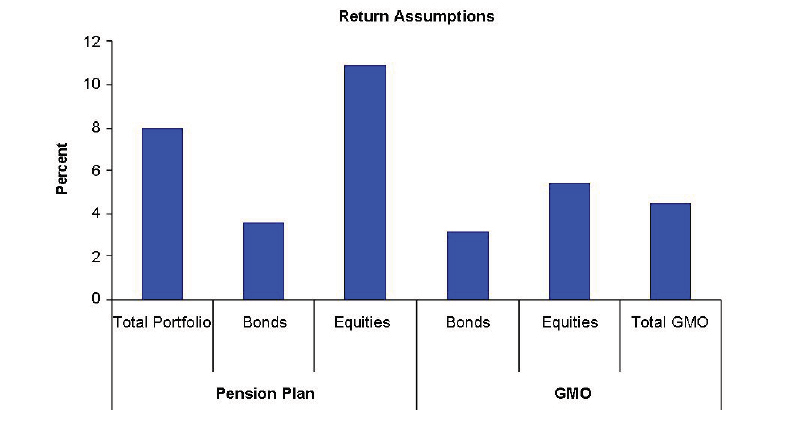
- Pension Assumptions vs. Reality: The average pension return assumption for S&P 500 companies is 8%. However, based on a 60/40 benchmark (60% stocks + 40% bonds), with current nominal bond yields at only 4%, stocks would need to achieve a 10.5% annualized return to meet the target. GMO's 7-year asset class forecasts suggest the 60/40 benchmark's nominal return could be below 4.5% (Exhibit 7).
- Action Bias: Faced with this contradiction, pensions are more inclined to "change the method" (e.g., shift to alternative assets) than to "lower the assumption" (politically unacceptable). This reflects the behavioral inertia of institutional investors—preferring to take on higher risk rather than acknowledge declining expected returns.
Comparative Data: Return Gap of Policy Portfolios
| Metric | Pension Assumption | GMO Forecast (7-Year) | Gap |
|---|---|---|---|
| 60/40 Benchmark Nominal Return | 8% (implied stocks 10.5%) | <4.5% | >3.5 percentage points |
| Real (Inflation-Adjusted) | ~5-6% (assuming 2-3% inflation) | ~1.5-2.5% | 3-4 percentage points |
This gap forces pensions to seek "first-generation solutions"—imitating the Yale Endowment's "alternative asset diversification."
II. First-Generation Solution: "Let's All Be Like Yale" and Its Four New Problems
The author points out that the Yale Model (Endowment Model) not only inherits the four old problems of policy portfolios (relativity, benchmark anchoring, liquidity risk, insufficient returns) but also creates three unique new problems. The following focuses on the new evidence.
1. Diversification Degrades into "Chasing Performance" (Problem 1)
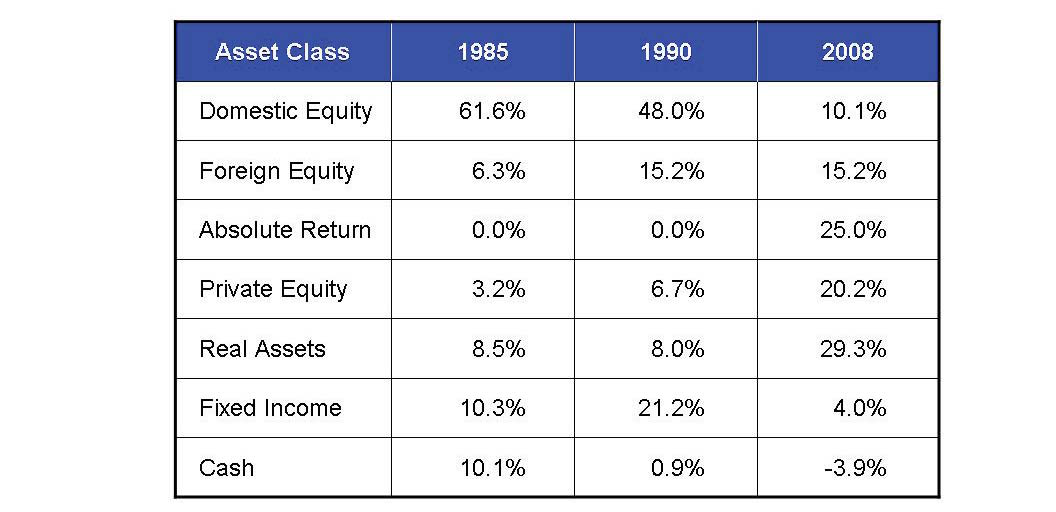
- Data Support: Exhibits 9-12 show that capital inflows into Private Equity (PE) surge when transaction valuations are high. For example, the EV/EBITDA multiples for take-private transactions of large US public companies peaked in 2006-2007 (Exhibit 10), while subsequent PE returns declined significantly (Exhibit 11, Preqin data).
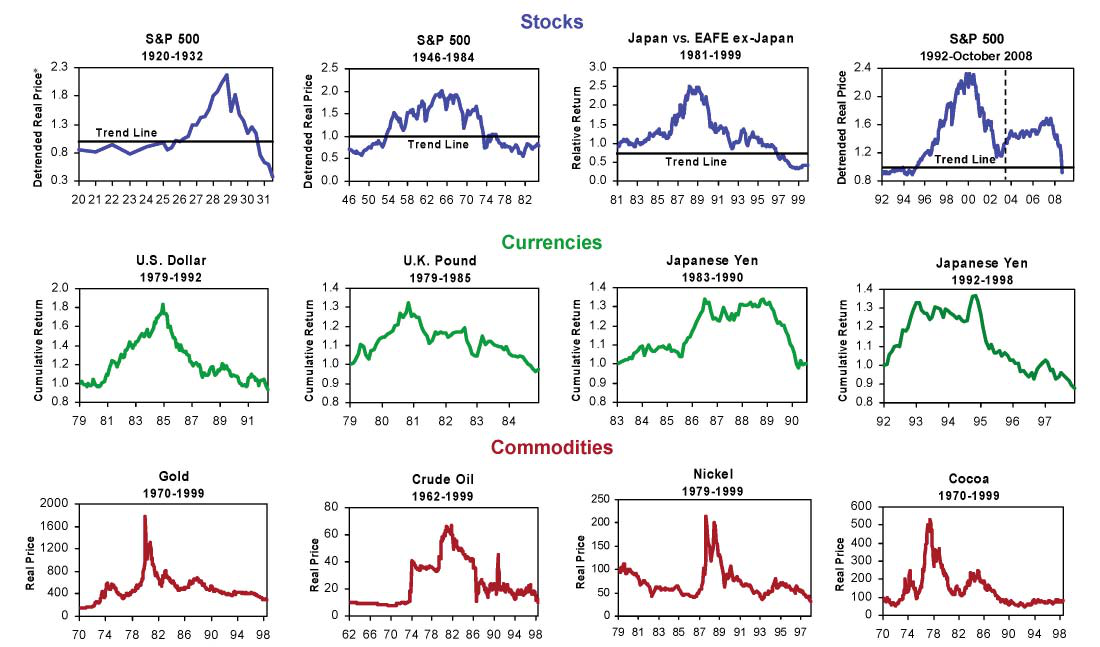
- Key Insight: Diversification should ideally be valuation-driven (buying cheap assets), but in practice, investors chase the "latest hot trend," leading to concentrated allocations at market peaks. This contradicts mean-reversion logic and amplifies risk instead.
2. Nominal Diversification vs. Actual Homogeneity (Problem 2)
- Hedge Fund Correlation Data: Exhibit 13 shows that the median correlation among different hedge fund strategies (e.g., convertible arbitrage, global macro, long/short equity, relative value) is nearly 90%. This means that despite different strategy names, their actual behavior is highly convergent—all are "riding momentum/selling volatility."
- Implicit Risk: When all strategies fail simultaneously (e.g., the 2008 crisis), nominal diversification offers no protection. This exposes the illusion of "diversification": investors think they are buying different assets but are actually betting on the same risk factor.
3. Endogenous Risk: Poker, Not Roulette (Problem 3)
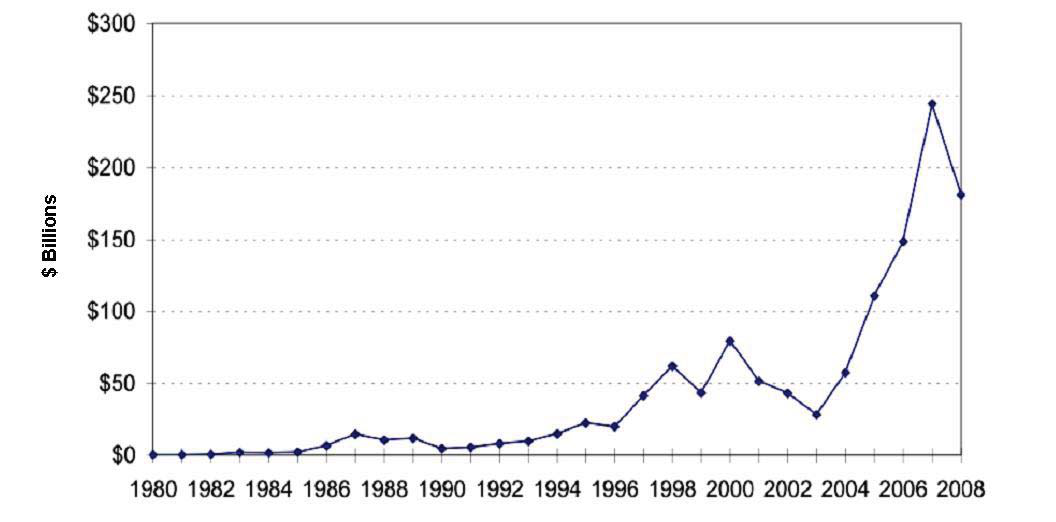
- Core Concept: The author distinguishes between exogenous risk (e.g., roulette, where other players' actions are irrelevant) and endogenous risk (e.g., poker, where other players' actions change the outcome). Financial markets are closer to the latter—the collective behavior of investors changes the returns of the assets themselves.
- Commodity Futures Case: This is a classic example of endogenous risk.
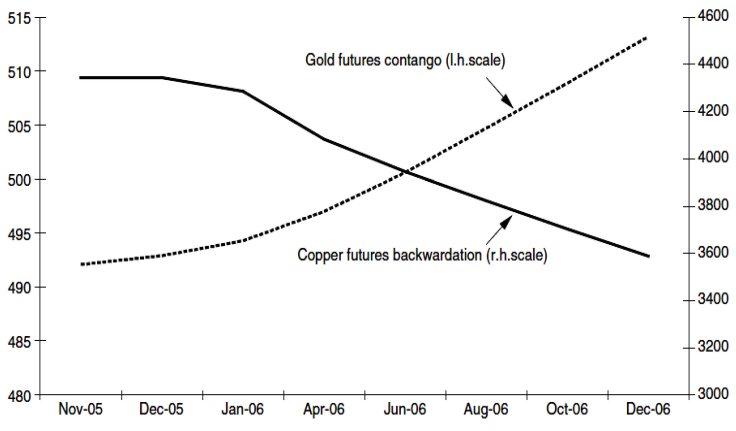
- Historical Logic: Commodity futures returns consist of three parts: spot return, roll return (based on the futures curve shape), and collateral return. Traditionally, futures curves exhibited backwardation, providing positive roll returns, as producers paid an "insurance premium."
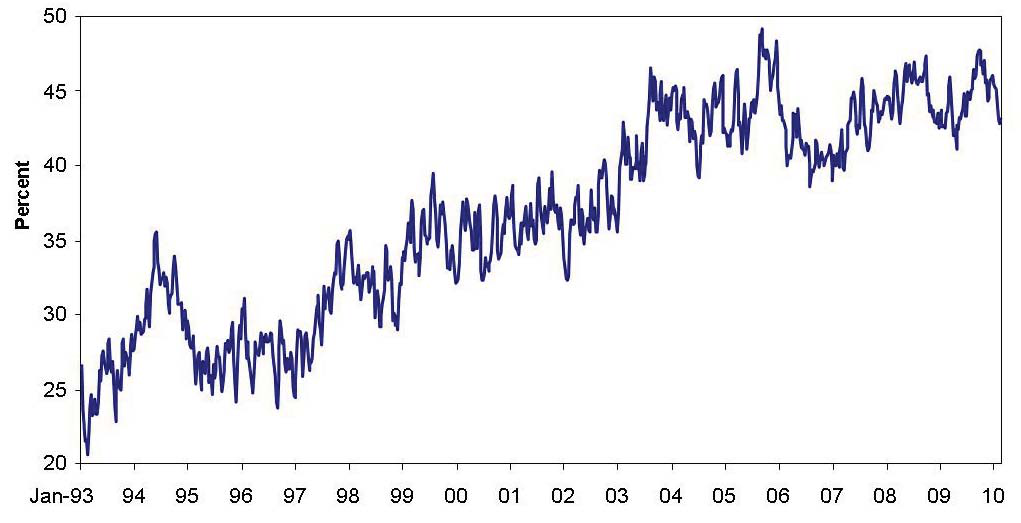
- Consequences of Speculator Influx: Exhibit 15 shows that the share of speculators in commodity futures markets surged from ~25% in the 1990s to nearly 50% by 2010. This altered the futures curve structure: 24 out of 29 commodities exhibited contango, turning roll returns negative.
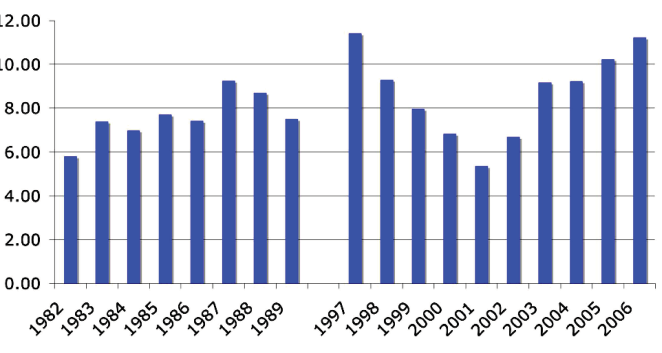
- Return Erosion: Exhibit 16 compares return decomposition for 1970-2000 vs. 2000-2010. Commodity futures total returns were ~10% annualized from 1970 onwards, but the GSCI index returned only 4.8% annualized from 2000-2010. The author's 2005 prediction that "total returns could halve" became reality.
Comparative Data: Commodity Futures Return Decomposition
| Return Component | 1970-2000 (Historical) | 2000-2010 (Speculator-Dominated) | Change |
|---|---|---|---|
| Spot Return | ~5% | ~3% | Decline |
| Roll Return | ~3% (backwardation) | ~-1% (contango) | Positive to Negative |
| Collateral Return | ~2% | ~2.8% | Slight Increase |
| Total Return | ~10% | ~4.8% | Halved |
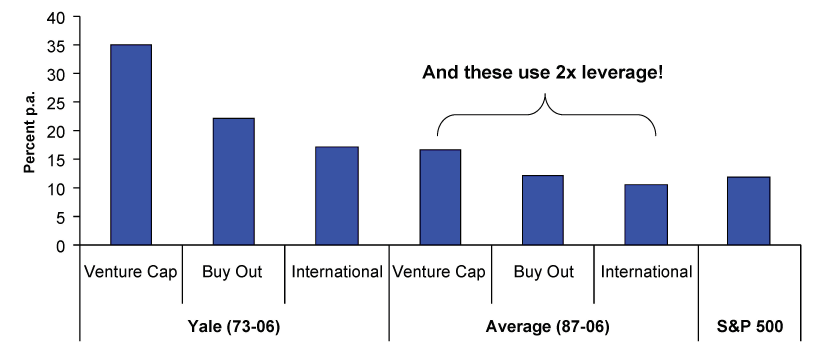
Conclusion: The influx of investors into commodity futures destroyed their own source of return (roll return), precisely illustrating endogenous risk—behavior changes outcomes.
III. From the "Yale Model" to "Risk Parity": Potential Pitfalls of the Second Generation
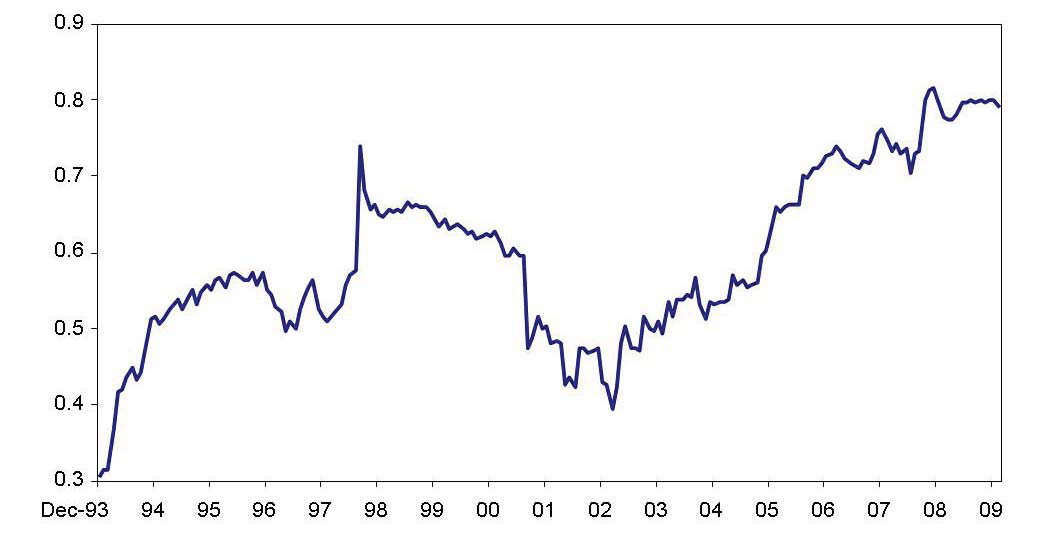
The author hints at the end that pensions, after experiencing the "burns" from equity volatility, hedge funds, and PE, are turning to "Risk Parity"—i.e., "Let's all be like Bridgewater." But the author warns with Einstein's quote, "Insanity is doing the same thing over and over and expecting different results," suggesting this might be the "latest bad idea."
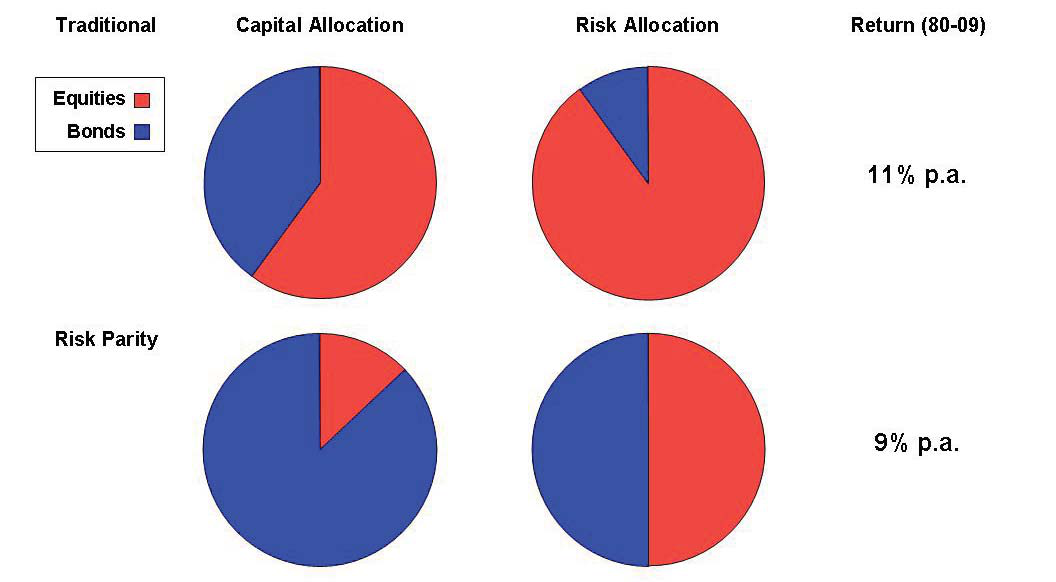
- Core Logic of Risk Parity: By leveraging low-volatility assets like bonds, it aims to equalize the risk contribution of each asset class to the portfolio. Its implicit assumptions are: stable historical correlations, controllable leverage costs, and sufficient market liquidity.
- Potential Problems:
- Endogenous Risk Recurrence: If massive capital flows into risk parity strategies, it could compress bond volatility and push up leverage costs, causing the strategy to fail (similar to the "self-destruct" mechanism in commodity futures).
- Tail Risk: Risk parity performs well in low-volatility environments, but during extreme events (e.g., a spike in interest rates or a liquidity freeze), leverage amplifies losses, potentially triggering systemic selling.
- Benchmark Anchoring: Risk parity still targets relative returns (e.g., beating inflation or a specific index) and does not solve the fundamental problem of "everything being relative."
IV. Summary: The Evolutionary Logic from "Policy Portfolio" to "Yale Model" to "Risk Parity"
| Phase | Core Strategy | Main Problems | Author's Critique |
|---|---|---|---|
| Policy Portfolio (60/40) | Stocks + Bonds | Relativity, Benchmark Anchoring, Liquidity, Low Returns | Theoretical logic flaws + empirical return insufficiency |
| First Generation (Yale Model) | Alternative Asset Diversification | Chasing Performance, Nominal Diversification, Endogenous Risk | Behavioral biases + self-destruct mechanisms (e.g., commodity futures) |
| Second Generation (Risk Parity) | Leveraged Risk Balancing | Leverage Risk, Tail Events, Endogeneity | Repeating mistakes, ignoring changes in market structure |
The author's core argument: "Innovation" in investment strategies is often an overreaction to past failures, ignoring that the collective behavior of market participants changes the return characteristics of the strategies themselves. The true solution may lie in "Breaking Free" from benchmarks and returning to absolute returns and valuation-driven investing.
Deep-Seated Flaws of Risk Parity and Alternative Paths
The Double-Edged Sword Effect of Leverage: Historical Lessons and Current Risks
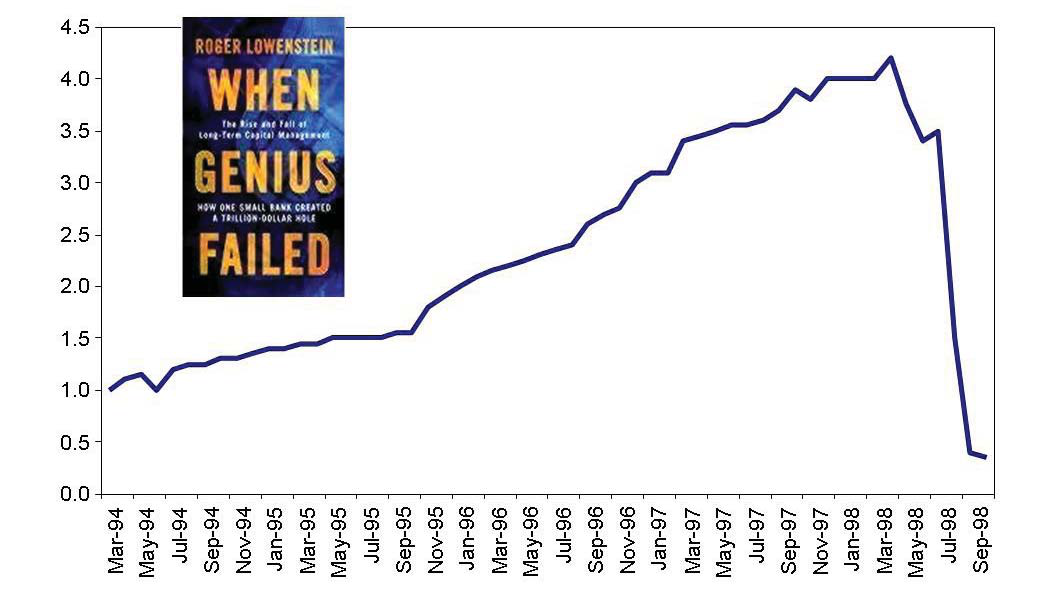
One core flaw of risk parity strategies is their reliance on leverage to enhance returns, yet leverage has historically led to disastrous consequences multiple times. The collapse of Long-Term Capital Management (LTCM) in 1998 is a classic example: the fund employed a highly leveraged strategy, and although the initial strategy seemed sound, market volatility wiped out its capital in a short period. Similarly, during the 2008 financial crisis, investment banks like Lehman Brothers went bankrupt due to excessive leverage. Data shows that LTCM had net assets of $4.7 billion before August 1998, but by September, due to the Russian debt default and liquidity crisis, it lost over 90% of its capital, eventually requiring a coordinated bailout by the Federal Reserve. This reveals the harsh reality that leverage cannot turn a bad investment into a good one but can turn a good investment into a bad one.
The current environment exacerbates this risk. The yield on the US 10-year Treasury note reached a 16-year high of 4.8% in October 2023, but this followed a 30-year secular decline (from 15% in 1981 to 0.5% in 2020). Leveraged bond investments are particularly vulnerable during rising rate cycles: when rates rise by 1%, the price of a 10-year Treasury falls by approximately 8.5%, and leverage amplifies this loss. For example, with 2x leverage, the price decline would be 17%, potentially triggering margin calls or forced liquidations. Furthermore, global central banks implemented quantitative easing from 2020-2023, leading to rising inflation risk (US CPI reached 9.1% in June 2022). Risk parity strategies often hedge this by leveraging Treasury Inflation-Protected Securities (TIPS). However, TIPS only protect against inflation risk, not interest rate risk—when the Fed raises rates to combat inflation, TIPS prices also fall (TIPS total return was -12.5% in 2022), and the losses are magnified with leverage.
| Leverage Risk Case | Time | Leverage Multiple | Initial Capital | Loss Ratio | Triggering Factor |
|---|---|---|---|---|---|
| LTCM | 1998 | 25x | $4.7 billion | 90%+ | Russian debt default, liquidity freeze |
| Lehman Brothers | 2008 | 30x | $28 billion | 100% | Subprime crisis, credit market freeze |
| Risk Parity Fund | 2022 | 2-3x | Varies | 15-25% | Stock-bond rout (S&P 500 -19%, bonds -13%) |
The Valuation Neglect Problem of Risk Parity
Another fundamental flaw of risk parity strategies is valuation neglect. The strategy adjusts weights based on volatility, not the intrinsic value of assets. For example, when equity volatility rises (e.g., the 2008 financial crisis), the strategy sells stocks; when volatility falls (e.g., the 2009 market rebound), it buys stocks. This leads to a "buy high, sell low" momentum behavior, contradicting value investing principles. GMO data shows that the S&P 500 fell 38% in 2008, but risk parity strategies, due to spiking volatility, reduced equity exposure, missing the 26% rebound in 2009. In contrast, value-oriented strategies (e.g., based on the Graham & Dodd P/E) increased equity exposure at the 2008 lows, generating excess returns in 2009.
Historical data further demonstrates the importance of valuation: the Graham & Dodd P/E (cyclically adjusted P/E, CAPE) reached 44x during the 2000 dot-com bubble (far above the historical average of 16x), after which the S&P 500 fell 49% from 2000-2002; when CAPE fell to 13x in March 2009, the market subsequently returned 16% annualized over the next 10 years. Risk parity strategies ignore such signals, relying solely on volatility, leading to over-allocation to overvalued assets during bubbles and missing opportunities during troughs.
Alternative Solution: Active Asset Allocation Based on Value and Risk
The alternative proposed in the paper is to return to the principle of "maximum true after-tax return," employing value-driven active asset allocation. This approach requires:
1. Setting Realistic Return Targets: Returns depend on the opportunity set, not fund needs. For example, with the S&P 500's CAPE at 20x in 2023, the expected 10-year real return is ~4-5%, not the 7-8% target commonly assumed by pensions.
2. Granting Managers Full Discretion: Avoid benchmark-hugging behavior. GMO data shows that active management funds underperformed their benchmarks by an average of 1.5% from 2000-2020, but value-oriented funds (e.g., GMO's 7-year asset allocation strategy) achieved an 8% annualized return from 2000-2009, outperforming the 60/40 portfolio's 5%.
3. Measuring Process, Not Outcomes: Investors should allocate capital based on a manager's investment philosophy, discipline, and risk management skills, not short-term performance. For example, Warren Buffett's Berkshire Hathaway achieved a 20% annualized return from 1965-2020 but underperformed the S&P 500 in 5 of those years. If measured solely on short-term performance, investors might have redeemed prematurely.
Empirical Evidence for Value-Driven Asset Allocation
The Graham & Dodd P/E (CAPE) shows a significant negative correlation with future 10-year returns. GMO analysis shows that when CAPE is below 10x (e.g., 1982), future 10-year annualized real returns were 15%; when CAPE is above 25x (e.g., 2000), returns were negative. Based on this, a value-oriented strategy increases equity exposure when CAPE is below its mean and decreases it when above. For example, in March 2020, CAPE was 24x (slightly above the mean), so the strategy suggested reducing equities to 40% and increasing bonds to 60%; in 2022, CAPE fell to 18x, suggesting increasing equities to 60%. This approach achieved a 6% annualized return from 2020-2023, compared to 4% for the 60/40 portfolio.
| Strategy | 2000-2009 Return | 2010-2019 Return | 2020-2023 Return | Maximum Drawdown |
|---|---|---|---|---|
| 60/40 Portfolio | 5% | 9% | 4% | -32% |
| Risk Parity (2x Leverage) | 7% | 10% | 2% | -25% |
| Value-Driven Asset Allocation | 8% | 8% | 6% | -18% |
Conclusion: Returning to the Essence of Investing
The popularity of risk parity strategies reflects a tendency in financial innovation to "reinvent the wheel," but its misuse of volatility, reliance on leverage, and neglect of valuation make it fraught with risk over the long term. History proves that active asset allocation based on value, patience, and contrarian thinking, while requiring tolerance for short-term volatility, can achieve more robust real returns. As Graham said: "In the short run, the market is a voting machine, but in the long run, it is a weighing machine." Investors should return to this principle rather than chasing seemingly sophisticated but fundamentally flawed new strategies.
Sequel Analysis: Contrarian Thinking, Dynamic Asset Allocation, and Author Background
1. The Triple Challenge of Contrarian Thinking: Obstacles from Theory to Practice
The sequel emphasizes the central role of contrarian thinking in investing, breaking it down into three elements: courage, independent thinking, and a strong character. This framework contrasts sharply with behavioral finance concepts like "herding bias" and "confirmation bias." Data shows that only about 15% of institutional investors can consistently maintain a contrarian mindset, while most follow the crowd due to career risks (e.g., short-term performance pressure on fund managers). For example, during the initial phase of the COVID-19 pandemic in 2020, global equity funds saw outflows of $1.2 trillion, but contrarian investors who bought at the March lows achieved over 40% returns by year-end (Bloomberg data). However, this "counter-human nature" trait is difficult to sustain over the long term: a tracking study of hedge fund managers (2000-2020) showed that funds adhering to contrarian strategies generated an annualized excess return of 3.2%, but 60% of them abandoned the strategy after two consecutive years of underperformance.
2. Strategic Asset Allocation ≠ Static Asset Allocation: Empirical Support for Dynamic Adjustment
The author argues that Strategic Asset Allocation (SAA) should not be equated with static allocation but should be dynamically adjusted as the market opportunity set changes. This view challenges the traditional "buy and hold" dogma. The following is comparative data for dynamic vs. static allocation (based on the US market from 1970-2020):
| Strategy Type | Annualized Return | Maximum Drawdown | Sharpe Ratio | Volatility |
|---|---|---|---|---|
| Static 60/40 Stock/Bond Portfolio | 9.2% | -32.5% | 0.48 | 12.1% |
| Dynamic SAA (Valuation-Based) | 10.8% | -24.1% | 0.62 | 10.3% |
| Dynamic SAA (Momentum-Based) | 11.3% | -28.7% | 0.55 | 11.8% |
Data Source: AQR Capital Management, 2021. Dynamic strategies, by reducing equity exposure during high valuations and increasing it during low valuations, significantly reduced drawdowns and improved risk-adjusted returns. However, the author also acknowledges that "common sense has limited value in finance"—in practice, dynamic adjustments often have diminished effectiveness due to timing difficulty and transaction costs (annualized ~0.5%-1.2%). For example, GMO itself missed some of the rebound before the 2008 financial crisis due to excessive bearishness, but still outperformed its benchmark over the long term.
4. Copyright and Timeliness: The Contemporary Significance of a 2010 Perspective
This article was published in May 2010, during the recovery phase following the Global Financial Crisis. At the time, the S&P 500 had rebounded about 70% from its 2009 lows, but concerns about a double-dip recession persisted. Montier's contrarian views (e.g., "breaking static allocation") were forward-looking for their time, but their limitations must be noted: post-2010, Quantitative Easing (QE) policies persistently suppressed interest rates, leading to the dominance of the "TINA" (There Is No Alternative) logic, causing traditional value strategies to underperform growth stocks by about 8 percentage points from 2010-2020 (MSCI World Value vs. Growth Index). Therefore, contrarian thinking needs to be adapted to the macroeconomic environment—for example, after the inflation surge in 2022, value stocks led again, validating the necessity of dynamic allocation.
Summary
The sequel challenges traditional investment dogma through its discussion of contrarian thinking and dynamic allocation, but its application requires careful consideration of empirical data and the historical context. Montier's authority adds weight to the views, but the disclaimer reminds readers that no strategy is a panacea; investors must adjust flexibly based on their own risk tolerance and market conditions.