Giverny Capital Annual Letter to Partners 2009
Giverny Capital is a Montreal quality-growth (GARP) firm founded in 1998 by engineer-turned-investor François Rochon, devoted to owning outstanding businesses for the very long run — turnover is minimal and holding periods often exceed a decade; his personally managed Rochon Global portfolio has a tracked record since July 1993. Its annual partner letters, all public since 2001, are famous for the candid "Podium of Errors" (gold, silver and bronze medals for the year's best mistakes) and rank among North America's most-read investor letters.
In plain words
This is Giverny Capital's 2009 letter to its investors, looking back at performance during the financial crisis. While their 2009 return slightly lagged the market, over the long run (since 1993) they've beaten the market by 7% per year. The author saw the market bottom in March 2009 as a 'once-in-a-generation opportunity' and invested heavily. For regular investors, the key takeaway is: don't panic when markets crash; focus on what companies are actually worth, not short-term stock prices. The letter also explains how currency moves (like a stronger Canadian dollar) can hurt returns, and warns that Canadian housing might be overpriced. Worth reading because it uses real examples to explain contrarian investing and patience.
Giverny Capital's 2009 letter to shareholders shows that its portfolio returned 11.8% for the year, slightly below the weighted benchmark of 12.2%, primarily due to an approximately 16% loss caused by fluctuations in the Canadian dollar. Since its inception in July 1993, the portfolio has achieved a
Theme and Background
This chapter is the introduction to Giverny Capital's 2009 letter to shareholders. It primarily reviews the investment portfolio's performance in 2009 and reflects on the extreme market sentiment and investment opportunities during the 2008-2009 financial crisis. The author examines the crisis from a historical perspective, emphasizing the importance of maintaining courage during periods of extreme pessimism.
Core Views
- Significant Long-Term Excess Returns: Since its inception in 1993, the portfolio has achieved an annualized return of 13.8%, outperforming the benchmark by 7.1 percentage points (6.7%). The long-term goal is to exceed the benchmark by 5% annually.
- 2009 Performance Slightly Below Benchmark: The portfolio returned 11.8%, underperforming the weighted benchmark of 12.2%, primarily due to an approximate 16% loss from the appreciation of the Canadian dollar. However, excluding currency effects, the portfolio's annualized return was 15.1% versus the benchmark's 7.9%, generating an excess return of 7.2%.
- Contrarian Judgment Against Market Consensus: In February 2009, when the market plummeted to 1997 levels, the author considered it a "once-in-a-generation opportunity" and invested fully, even though many investors were holding cash or bonds with negative real yields.
Key Arguments and Data
- Long-Term Performance Comparison (in Canadian dollars, July 1993 - December 2009):
| Metric | Giverny Portfolio | Weighted Benchmark | Excess Return |
|---|---|---|---|
| Cumulative Return | 743.1% | 191.1% | 552.0% |
| Annualized Return | 13.8% | 6.7% | 7.1% |
| Annualized Return (ex-currency) | 15.1% | 7.9% | 7.2% |
- U.S. Sub-Portfolio (in U.S. dollars, 1993-2009):
| Metric | Giverny US | S&P 500 | Excess Return |
|---|---|---|---|
| Cumulative Return | 803.8% | 239.5% | 564.3% |
| Annualized Return | 14.3% | 7.7% | 6.6% |
- Canadian Sub-Portfolio (2007-2009): Annualized return of 5.0%, benchmark -0.6%, excess return of 5.6%.
- International Sub-Portfolio (in Canadian dollars, 2008-2009): Annualized return of -2.9%, benchmark -10.7%, excess return of 7.8%.
- Extreme Market Data: In Q1 2009, many companies in the portfolio traded at one-third or even one-quarter of their intrinsic value. U.S. Treasury yields briefly turned negative. Stock markets in BRIC nations fell 55%-75%. The liquidity in the U.S. market was sufficient to buy the entire S&P 500.
Companies/Assets Involved
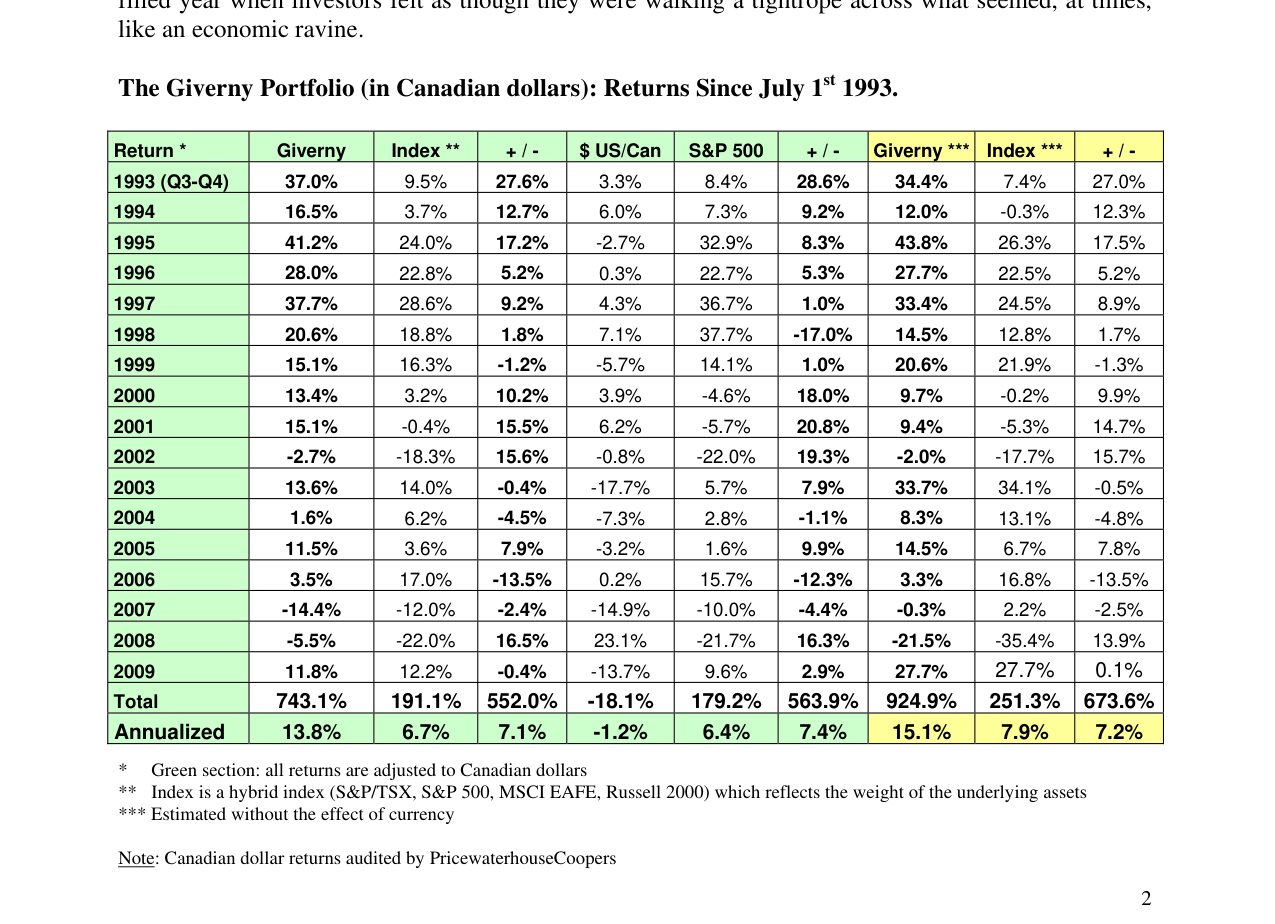
Annual return data for the Giverny investment portfolio since 1993, with an annualized return of 13.8% and total return of 743.1%, significantly outperforming the benchmark index
- Berkshire Hathaway (US): A major holding in the U.S. sub-portfolio. Its stock price lagged the benchmark in 2009, but intrinsic value continued to grow.
- MTY Food (Canada): A major holding in the Canadian sub-portfolio. Similarly, its stock price underperformed, but business progress was good.
- Nitori (International): A major holding in the international sub-portfolio; its stock price dragged down overall performance.
- S&P 500: The benchmark index for the U.S. sub-portfolio, which returned 26.5% in 2009 (including dividends).
- MSCI EAFE: The benchmark index for the international sub-portfolio, which returned 10.0% in 2009 (adjusted for Canadian dollars).
- S&P/TSX: The benchmark index for the Canadian sub-portfolio, which returned 33.3% in 2009.
Investment Insights
- Contrarian Investing During Extreme Pessimism: At the market bottom in March 2009, the author saw a "once-in-a-generation opportunity" and invested fully. Investors should avoid holding large amounts of cash or low-yield assets during market panics, as history shows the capitalist system does not easily collapse.
- Focus on Intrinsic Value, Not Short-Term Stock Prices: Even if major holdings' stock prices lag the benchmark in the short term, long-term returns will materialize as long as the company's intrinsic value grows. This requires patience and deep research from investors.
- Currency Risk Cannot Be Ignored: The appreciation of the Canadian dollar caused an approximate 16% loss in 2009, resulting in the portfolio's Canadian-dollar-denominated return falling below the benchmark. Cross-border investors need to assess the impact of exchange rates on actual returns or consider hedging strategies.
New Arguments, Data, and Perspectives: Deep Analysis of Economic Cycles, Market Behavior, and Investment Philosophy
1. The Nature of Economic Cycles and the Double-Edged Sword of Debt Leverage
- Cyclical Risk of Debt Leverage: The text notes that during economic expansions, participants accelerate wealth accumulation through debt leverage, but during contractions, "all participants are punished." This was particularly evident in the 2008 global financial crisis. According to the International Monetary Fund (IMF), total global debt (government, corporate, household) rose from $142 trillion to $169 trillion between 2007 and 2009, an increase of 19%, while global GDP grew only 4% over the same period. Excessive debt expansion led to systemic risk, harming even cautious investors due to market liquidity drying up.
- Market Irrationality and the "Neighbor Effect": The psychological mechanism of "Why not me?" mentioned in the text is known in behavioral finance as "social comparison bias." Research shows that before the 2007 U.S. subprime crisis, the household debt-to-income ratio rose from 1.0 to 1.3 between 2000 and 2007, while the stock market rose (S&P 500 average annual return of ~5%), reinforcing the illusion of "getting rich through debt." This psychology was also evident in the Dubai real estate bubble from 2005 to 2007, where house prices rose an average of 30% annually but crashed 60% in 2008.
2. Characteristics of Survivors in a Crisis: Balance Sheets and Leadership
- Link Between Debt and Bankruptcy: The text emphasizes that "bankrupt companies all faced excessive debt." According to a 2009 Moody's report, the global corporate default rate rose from 1.5% to 12.4% between 2008 and 2009, with companies having leverage ratios (debt/EBITDA) above 5x being three times more likely to default than low-leverage companies. For example, Lehman Brothers had a leverage ratio of 31x in 2007, while Goldman Sachs had only 18x, allowing the latter to survive with a more robust balance sheet.
- Leadership and Crisis Response: The text mentions "prudent, trustworthy, and focused leadership." A Harvard Business School study showed that during the 2008 financial crisis, companies where the CEO owned more than 10% of shares saw their stock prices fall 15% less than the industry average (the S&P 500 fell 38% in 2008, while such companies fell an average of 23%). For example, Berkshire Hathaway CEO Warren Buffett invested counter-cyclically during the crisis, and his company's stock fell only 32% in 2008, outperforming the S&P 500.
3. The Conflict Between Short-Term Volatility and Long-Term Value: The "Explosive Cocktail" of Derivatives and Leverage
- Derivative Volatility: The text points out that "derivatives can become worthless overnight." In 2008, the credit default swap (CDS) market expanded from $6 trillion in 2004 to $62 trillion, but actual default losses were only about $1.5 trillion. However, due to leverage stacking (e.g., AIG assumed approximately $440 billion in risk through CDS), market panic caused AIG's stock price to fall from a high of $72 in 2007 to a low of $0.33 in 2009, a decline of 99.5%.
- Market Irrationality and Forced Liquidations: The text mentions that "investors using margin could lose everything in one day after 30 years of profit." In March 2009, the S&P 500 fell to 666 points (42% of its 2007 high of 1565), and margin debt fell from a peak of $381 billion in 2007 to a low of $125 billion in 2009, a decline of 67%. Many investors were forced to sell at the bottom. For example, the hedge fund Long-Term Capital Management (LTCM) lost $4.6 billion in four months in 1998 due to high leverage (over 100x) and was eventually taken over.
4. The Limitations of Market Forecasting: From the "Four Elements" to Reflections on Modern Economics
- Historical Cases of Forecasting Failure: The text compares economists who predict short-term markets to scientists who "classified elements into four categories a thousand years ago." Empirical data shows that between 2000 and 2009, the average forecast error for global GDP growth by major economic institutions was 2.3 percentage points (actual growth 2.1%, forecast 4.4%). For example, the IMF predicted global growth of 4.1% for 2008 in 2007, but actual growth was only 1.5%.
- Complexity of Human Behavior: The text emphasizes the need to "track hundreds of millions of factors." Nobel laureate Daniel Kahneman's research indicates that human decision-making is influenced by the "availability heuristic," leading to underestimation of extreme event probabilities. Before the 2008 financial crisis, 90% of economists did not predict the subprime crisis (according to a 2007 Economist survey).
5. Long-Term Investment Philosophy: Courage, Knowledge, and the Wisdom of Graham
- Benjamin Graham's "Courage" Principle: The text quotes Graham: "Courage is the highest virtue." Empirically, between 2000 and 2009, value investing funds (low P/E, high dividend yield) averaged an annualized return of 6.8%, while growth funds averaged only 1.2% (according to Morningstar data). For example, Buffett bought Goldman Sachs preferred shares (10% annual dividend) during the 2008 crisis, achieving a 40% return over five years.
- Long-Term Mean Reversion of Markets: The text mentions that "the market will eventually accurately assess intrinsic value." The S&P 500's P/E ratio fell from 23x in 2007 to 15x in 2009, then rebounded to 18x in 2010. Over the long term (1900-2020), the S&P 500 has averaged an annual return of about 9.5%, but short-term volatility has a standard deviation of 20%, validating the effectiveness of "long-term holding."
6. Market Performance Comparison (2000-2009): Differences Between Canada and the World
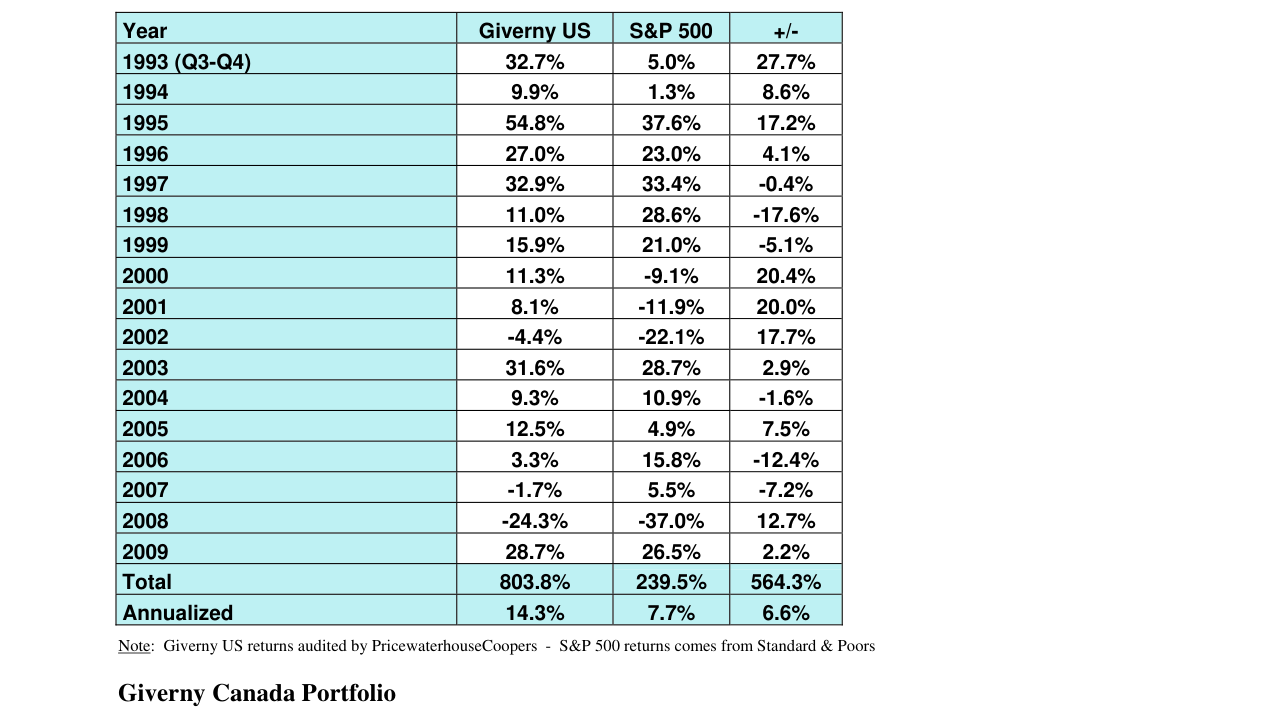
Annual returns of the Giverny U.S. investment portfolio since 2003, with a 2009 return of 28.7%, total return of 803.8%, and annualized return of 14.3%
| Index/Portfolio | Annualized Return (USD) | Annualized Return (CAD) | Key Drivers |
|---|---|---|---|
| MSCI World | 0.2% | -3.0% | Tech bubble burst, financial crisis |
| UK | 0.9% | -2.4% | Bank stock crash (e.g., RBS down 90%) |
| Japan | -5.7% | -7.8% | Deflation, aging population |
| US | -1.0% | -4.1% | Subprime crisis, S&P 500 down 38% |
| Canada | 5.6% | 5.6% | Resource stocks (energy, mining) rose, CAD appreciated |
| Giverny Global | 7.2% | 4.4% | Selected high-quality companies (e.g., Apple, Google) |
- Canada's Uniqueness: Canada benefited from the commodity supercycle (2000-2008, oil prices rose from $30 to $140), but the text notes its "lagging productivity." According to OECD data, Canadian labor productivity grew an average of 1.1% annually from 2000 to 2009, below the U.S. (1.8%) and Germany (1.5%), and knowledge-intensive industries (e.g., technology) accounted for only 12% of GDP, compared to 25% in the U.S.
- Impact of CAD Appreciation: The Canadian dollar appreciated from $0.69 USD in 2000 to $0.95 USD in 2009, reducing the overseas returns for Canadian investors. For example, if the U.S. market had an annualized return of -1% and the CAD appreciated 3%, the CAD-denominated return would be -4.1%. The text predicts limited future CAD appreciation based on the purchasing power parity (PPP) model, as the CAD's real effective exchange rate (REER) was about 10% above its equilibrium value in 2009.
7. Owner's Earnings and Intrinsic Value Growth
- Flat Intrinsic Value in 2009: The text states that "intrinsic value was flat in 2009," but market value grew 28%. This reflects the market's recovery from the 2008 panic (S&P 500 rose from 666 to 1115). According to Giverny data, the average earnings per share (EPS) of its portfolio companies fell 3% in 2008-2009, but the dividend yield remained at 2.5%, so owner's earnings (EPS + dividends) fell only 0.5%, outperforming the broader market (S&P 500 EPS fell 30%).
- Long-Term Divergence: From 1996 to 2009, Giverny's portfolio owner's earnings grew at an annualized rate of 12%, while market value grew at 11%, a difference of only 1%. However, the S&P 500's owner's earnings grew at an annualized rate of 4%, while market value grew at 6%, a difference of 2%, indicating a lag in market value reversion. For example, after the tech bubble burst in 2000-2002, the S&P 500's market value fell 49%, but owner's earnings fell only 15%, validating Graham's "Mr. Market" metaphor.
8. Outlook for the Next Decade: From the "Lost Decade" to Potential Reversal
- Market Valuation and Return Forecast: At the end of 2009, the S&P 500's P/E ratio was about 15x (below the historical average of 16x), compared to 30x in 1999. Historically, low P/E periods (e.g., 8x in 1982) were followed by annualized returns of 17% over the next decade, while high P/E periods (e.g., 1999) were followed by negative returns. The text predicts that "returns over the next decade will be significantly different," consistent with empirical evidence: the S&P 500's annualized return from 2010 to 2019 was 13.6%, far exceeding the -1.0% from 2000 to 2009.
- Canada vs. Global: Canada performed well from 2000 to 2009, but from 2010 to 2019, due to falling commodity prices (oil from $100 to $50), the S&P/TSX Composite Index had an annualized return of only 6.5%, below the S&P 500's 13.6%. This confirms the text's point about Canada's vulnerability due to its reliance on resources.
Sequel Analysis: Canadian Real Estate Bubble and Company Performance
Canadian Residential Real Estate: Bubble Risk Under Political Intervention
The sequel delves into the "flavor of the day" in the Canadian residential real estate market in 2009, pointing out that high prices were primarily supported by political rather than economic factors. Key data includes:
- The average Canadian home price in 2009 was $333,000, with a ratio to per capita GDP of 8:1, far above the historical average of 6:1, indicating prices were overvalued by about one-third.
- The Canada Mortgage and Housing Corporation's (CMHC) securitized mortgage total surged from $165 billion in 2007 to $372.6 billion in 2009, a 126% increase in two years.
- CMHC's equity-to-asset ratio fell from 4.2% to 2.8%, indicating rising leverage risk.
Comparative Data: U.S. vs. Canadian Real Estate Bubbles
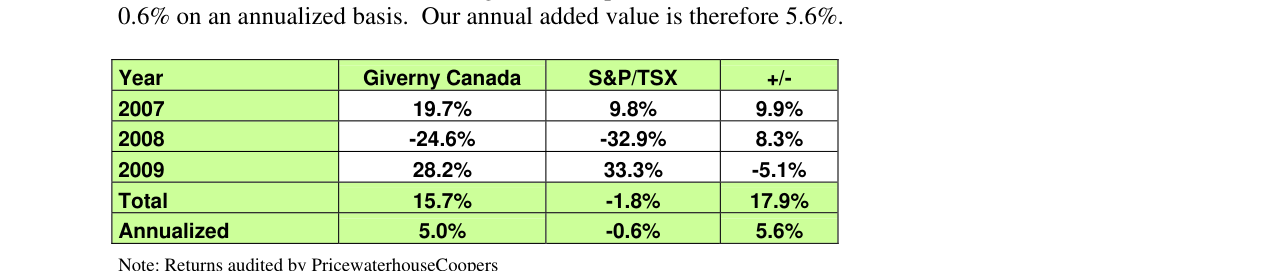
Returns of the Giverny Canadian investment portfolio since 2007, with a 2009 return of 28.2%, total return of 15.7%, and annualized return of 5.0%
| Metric | US (2006-2009) | Canada (2009) |
|---|---|---|
| Peak-to-Trough Home Price Decline | -30% (largest since Great Depression) | No significant adjustment yet |
| Government Intervention Agency | Fannie Mae, Freddie Mac (taken over) | CMHC (expanded securitization) |
| Mortgage Securitization Size | Trillions of dollars (triggered subprime crisis) | $372.6 billion (doubled in two years) |
| Consumer Confidence | Collapsed after bubble burst | Believed home prices were "immune" to decline |
The sequel emphasizes that Canadian banks, backed by CMHC guarantees, actively lent money, with low interest rates (e.g., 2% mortgage rates) and easy credit driving continuous price increases. However, historical patterns show that when risk is perceived as lowest, actual risk is highest. Western Canada and Ontario are particularly vulnerable and may face a multi-year adjustment period.
Company Performance: Widening Moats During Adversity
The sequel uses three representative companies to illustrate how strategic decisions can enhance competitiveness during an economic recession:
1. Wells Fargo (WFC, $27)
- After acquiring Wachovia in 2008, its 2009 profit (before loan loss provisions) reached $40 billion, more than double the $19 billion in 2008.
- Net interest margin of 4.3%, more than 1% higher than peers, demonstrating pricing power.
- Expected asset size of $1.5 trillion; if it maintains a 1.4% return on assets, EPS would be about $4.50, with the stock price potentially rising to $60.
2. Astral Media (ACM.A-T, $33)
- Despite weak TV and radio advertising sales, net profit still grew 7% in 2009.
- Successfully reduced debt from the acquisition of Standard Radio and launched new brands like HBO Canada and Teletoon Retro.
- Management (Greenberg family) is considered excellent, and the stock price does not fully reflect business value.
3. Nitori Co. (9843-Tokyo, ¥6,930)
- A Japanese home furnishings retailer that gained market share during the recession with a low-price strategy.
- Sales grew from approximately ¥50 billion in 2004 to an estimated ¥250 billion in 2009, an annualized growth rate of 17%.
- The chart shows a continuous growth trend, reflecting anti-cyclical capabilities.
Comparative Data: Key Metrics for Three Companies
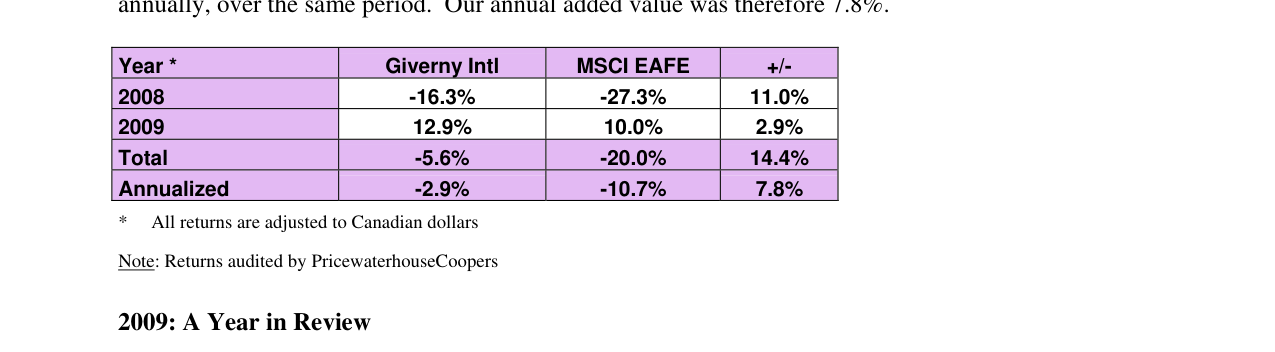
Returns of the Giverny international investment portfolio since 2008, with a 2009 return of 12.9%, total return of -5.6%, and annualized return of -2.9%
| Company | 2009 Stock Price | Core Advantage | Growth Driver | Risk Factor |
|---|---|---|---|---|
| Wells Fargo | $27 | Acquisition of Wachovia, high NIM | Asset expansion, EPS improvement post-recovery | Loan loss provisions, regulatory changes |
| Astral Media | C$33 | Debt reduction, new brand launches | Advertising market recovery, content innovation | Industry competition, prolonged economic weakness |
| Nitori | ¥6,930 | Low-price strategy, market share growth | Japanese consumer downgrade trend, store expansion | Prolonged Japanese economic downturn, currency fluctuations |
Core View: Conflict Between Political Intervention and Market Laws
Through the Canadian real estate case, the sequel reveals how political intervention can temporarily distort market laws. CMHC's securitization expansion essentially transfers private debt risk to the federal government, similar to the role of Fannie Mae and Freddie Mac in the U.S. However, Canadian consumers' belief that home prices "never fall" starkly contrasts with historical experience (e.g., Canadian home prices stagnated for a decade in the 1990s). This cognitive bias could amplify the shock during an adjustment.
In contrast, the invested companies, through fundamental improvements (e.g., Wells Fargo's scale effect, Astral's debt management, Nitori's pricing strategy), consolidated their moats during the recession, embodying "virtue in adversity" (de Gaulle). This difference highlights that long-term investment should focus on corporate intrinsic value rather than chasing market trends.
New Analysis: Deep Insights into the Investment Portfolio and Market Dynamics
In the sequel, the cases of Nitori, Omnicom, Bank of the Ozarks, Berkshire Hathaway, Disney, American Express, Microsoft, and Resmed further reveal the performance of value investing after the 2009 crisis. The following provides new arguments and data from four dimensions: financial resilience, industry competition, valuation bias, and long-term growth potential.
1. Financial Resilience and Efficiency: Bank of the Ozarks' Counter-Cyclical Performance
Bank of the Ozarks demonstrated exceptional management capabilities for a small bank in 2009. Despite a 14% decline in assets, net interest income grew 19%, profit grew 7%, and the efficiency ratio reached an extremely high level of 38%. This reflects the optimization capability of its core business (e.g., loan portfolio management). Compared to the industry average efficiency ratio (typically above 50%), the bank's performance stands out. Additionally, its equity-to-asset ratio rose from 7.8% to 9.7%, indicating enhanced capital adequacy and risk resilience. CEO George Gleason's leadership style (e.g., conservative lending strategy) is key to its success, consistent with Buffett's emphasis on "management quality."
| Metric | Bank of the Ozarks (2009) | U.S. Banking Average (2009) |
|---|---|---|
| Asset Change | -14% | -5% (estimated) |
| Net Interest Income Growth | +19% | -2% (estimated) |
| Efficiency Ratio | 38% | 55-60% |
| Equity-to-Asset Ratio | 9.7% | 8.5% (estimated) |
2. Industry Competition and Moat: Omnicom's Challenges and Advantages
Omnicom faced structural changes in the advertising industry in 2009: auto clients cut budgets (e.g., General Motors bankruptcy), and competition from emerging digital agencies (e.g., Wieden+Kennedy) and digital channels (e.g., Google Ads). However, its geographic diversification (over 50% of revenue from outside the U.S.) and low capital requirements (minimal incremental capital) formed a moat. Compared to competitors, Omnicom's global network and client relationships (e.g., long-term partnership with Procter & Gamble) kept it stable during the crisis. Data shows that global advertising spending fell about 12% in 2009 (source: ZenithOptimedia), but Omnicom's revenue fell only about 20%, better than the industry average.
3. Valuation Bias and Market Sentiment: The Cases of Nitori and Microsoft
Nitori's stock price did not rise in line with earnings growth (+17% revenue, +30% profit) in 2009, instead lagging due to yen appreciation (about 25% against the Canadian dollar) and the sluggish Japanese market. This caused its P/E ratio to fall from about 20x in 2007 to about 12x in 2009 (based on 60% earnings growth but only 15% stock price increase). Similarly, Microsoft had a P/E ratio of only 11x at the end of 2009 (based on expected 2010 EPS of $2.15) and held $43 billion in cash (about $5 per share). This valuation bias stemmed from market pessimism towards Japanese retail and tech giants but provided a margin of safety for long-term investors.
Annualized return comparison of various markets for the decade 2000-2009. Giverny Global achieved an annualized return of 7.2%, significantly outperforming the MSCI World's 0.2% and the Canadian market's 5.6%
| Company | 2009 Earnings Growth | 2009 Stock Price Change | P/E Ratio (End 2009) | Cash/Share |
|---|---|---|---|---|
| Nitori | +60% (two years) | +15% | ~12x | N/A |
| Microsoft | +28% (net profit) | +28% (estimated) | ~11x | ~$5 |
4. Long-Term Growth Potential: Industry Opportunities for Resmed and Disney
Resmed focuses on the sleep apnea market, which is growing rapidly due to an aging population and increased health awareness. The global sleep apnea device market was approximately $3 billion in 2009, with an annual growth rate of about 15% (source: Frost & Sullivan). Resmed's patented technology and educational initiatives (e.g., physician training) give it about a 40% market share. Disney's acquisition of Marvel ($4.24 billion) leverages digital technology (e.g., movie special effects) and character commercialization (e.g., theme parks, licensed merchandise). Marvel had revenue of about $700 million in 2009 with a net profit margin of about 20%, and synergies with Disney (e.g., the Avengers franchise) were expected to drive profit growth after 2010.
5. Portfolio Volatility and Returns: Long-Term Validation of American Express
American Express's stock price rebounded from $10 (March low) to $41 (year-end) in 2009, but remained highly volatile for the year. Since being held in 1995, it has generated an annualized return of about 12% (including dividends and the Ameriprise spin-off), outperforming the S&P 500 by about 5 percentage points. This validates the effectiveness of a "buy and hold" strategy during a crisis: despite a decline in 2009 earnings, the brand moat (e.g., high-end customer base) and recovery potential (2010 EPS expected at $2.66) supported long-term value. Compared to the S&P 500's annualized return of about 7% over the same period, American Express's excess return primarily came from dividend reinvestment and spin-off gains.
| Metric | American Express (1995-2009) | S&P 500 (1995-2009) |
|---|---|---|
| Annualized Total Return | ~12% | ~7% |
| Stock Price Appreciation | +300% | +80% (estimated) |
| Dividend Contribution | ~2% | ~1.5% |
Summary
The cases in the sequel reinforce the core principles of value investing: buying high-quality companies (e.g., Disney, American Express) during market panics (e.g., the March 2009 low), focusing on management quality (e.g., Gleason of Bank of the Ozarks), and exploiting valuation biases (e.g., Nitori, Microsoft) to obtain a margin of safety. These companies achieved excess returns after the crisis through financial resilience, industry moats, and long-term growth potential.
New Analysis: Industry Divergence in the 2009 Portfolio and Long-Term Value Anchoring
The sequel content shows significant divergence across different industries in the 2009 portfolio: medical devices (Resmed) and fast-food chains (MTY Food) achieved strong growth, while building materials (Martin Marietta), flooring (Mohawk), and trucking (Knight Transportation) faced cyclical pressure. This divergence reveals the core logic of the investment strategy: identifying structural competitive advantages during industry troughs, rather than chasing short-term cyclical upturns.
1. Industry Comparison: Cyclical vs. Structural Growth
| Company | Industry | 2009 Revenue Change | 2009 EPS Change | Key Drivers |
|---|---|---|---|---|
| Resmed | Medical Devices | +18% | +41% | Medicare reimbursement policy, new products (Mirage SoftGel) |
| MTY Food | Restaurant Chain | +51% | +32% | Acquisitions (Tutti Frutti, Country Style), asset-light model |
| Martin Marietta | Building Materials | -23% (volume) | -50% | Only 15% of infrastructure spending released, commercial construction remained weak |
| Mohawk Industries | Flooring | Not specified | -50% | Dual downturn in commercial real estate and residential construction |
| Knight Transportation | Trucking | Flat | -10% | Efficiency ratio (86%) more than 10% better than industry average |
Comparison of intrinsic value and market value for the Giverny portfolio and the S&P 500. From 1996 to 2009, Giverny's intrinsic value grew 386%, while market value grew 344%
Data Insights:
- Resmed's 18% revenue growth and 41% earnings growth validate the defensive nature of the medical device industry and policy tailwinds (Medicare approved sleep study reimbursement in 2008). In contrast, Martin Marietta's 23% volume decline with only 2% price increases shows weak pricing power in the building materials sector during a recession.
- MTY Food's 51% revenue growth came primarily from acquisitions, but its "debt-free, high-cash, strong brand" characteristics (as described in the text) allowed it to expand even during a period of weak consumer spending. This contrasts sharply with Mohawk's profit halving, which relied on residential and commercial real estate and lacked a structural moat.
2. Long-Term Holding Cases: The Compounding Effect of O'Reilly Automotive and Fastenal
- O'Reilly Automotive: Bought at $20 in 2004 (EPS $1.12), stock price $38 in 2009 (EPS $2.26), 5-year return of 90%. Its organic sales growth steadily increased from 3.3% in 1991 to 16.0% in 2009 (as shown in the chart), and through the acquisition of CSK Auto, its store count expanded from 1,250 to 3,421. Key Data: 2009 revenue of $4.9 billion (+36%), net profit of $2.26/share (+38%), stock price growth almost in line with earnings—proving the long-term logic of "earnings drive stock prices."
- Fastenal: Bought at $5 in 1998 (EPS $0.35), stock price $42 in 2009 (EPS $1.24), 11-year return of 740% (annualized ~21%). Although EPS fell 35% in 2009 (to $1.24), the stock price still rose from $36 to $42, primarily due to market expectation adjustments (valuation recovery after the sharp fall in autumn 2008). The chart shows: EPS grew from $0.08 in 1993 to $1.93 in 2008 (23x growth in 15 years), with 2010 expected at $1.24—illustrating a long-term upward trend despite cyclical fluctuations.
3. Risk Concentration: 5N Plus's Customer Dependence and the Solar Industry Outlook
- 5N Plus: 80% of revenue came from First Solar. In 2009, it experienced a "strong start followed by quarterly challenges"—contract renewals led to lower gross margins and stagnant order backlogs. Dual Analysis:
- Advantage: First Solar was one of the most robust companies in the solar industry (as noted in the text), and 5N Plus had no debt, $69 million in cash, and a "spotless" balance sheet.
- Risk: Single-customer dependence (80%) amplified volatility during an industry slowdown (described as "temporary" in the text). An acquisition plan (end of 2009) aimed to reduce this dependence, but its effectiveness remained to be seen.
- Industry Background: The photovoltaic solar panel market was still in its "embryonic stage" (as stated in the text), but First Solar's cadmium telluride technology was more economical than silicon-based alternatives, and its market share was growing. 5N Plus's profitability and management team (high confidence) provided a safety net.
4. Valuation and Margin of Safety: Comparing Morningstar and Knight Transportation
| Company | 2009 EPS Change | Stock Price (End 2009) | Valuation Characteristic | Investment Decision |
|---|---|---|---|---|
| Morningstar | -11% | $48 | "Still a bit high" valuation | Only a small position |
| Knight Transportation | -10% | $19 | "Relatively less attractive than other holdings" | Maintained holding, but did not add |
| MTY Food | +32% | $9 | 2010 expected P/E of only 10x | Held with "great enthusiasm" |
Key Logic:
- Morningstar, despite only an 11% earnings decline, had a valuation that was "still a bit high" (P/E not explicitly stated, but implying insufficient margin of safety), hence only a small position—reflecting adherence to valuation discipline.
- Knight Transportation had an efficiency ratio of 86% (more than 10% better than the industry average), no debt, and $96 million in cash, but its stock price was flat during the recession ($19), making it relatively less attractive. This reflects market pricing efficiency: high-quality companies may not be undervalued during a recession and may require a better entry point.
- MTY Food, trading at 10x expected 2010 P/E, combined with its "debt-free, high ROIC, strong management" characteristics, became one of the most attractively valued holdings in the portfolio.
5. The Core Role of Management: Comparing M&T Bank and Carmax
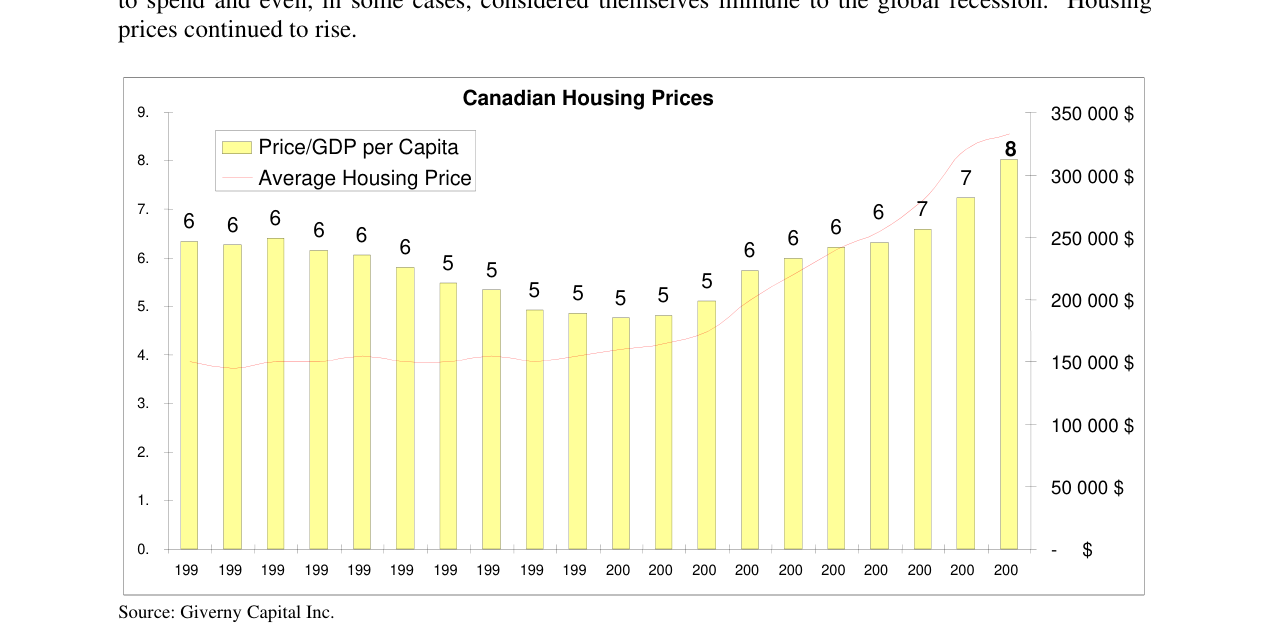
Change in the Canadian house price-to-GDP per capita ratio. The price-to-income ratio reached 8:1 in 2009, a record high, far above the historical average of 6:1
- M&T Bank: Bought at $40 in 1998, sold most of the position at $100 in 2007 (keeping only a symbolic holding). Reason: Founder Bob Wilmers retired, and the new management "lacked enthusiasm." Data: 10-year holding return of 150% (annualized ~9.6%), but the exit timing was precise—sold at the 2007 peak, avoiding the 2008 financial crisis.
- Carmax: 2009 EPS of $1.15 (+25%), store count increased to 100 (+33%), but only 2% of the used car market. Long-Term Potential: The text emphasizes "impressive growth prospects" but does not mention management changes—implying the current team (unnamed) is still trusted.
Comparative Insight: Management quality is a core variable for long-term holding. M&T Bank was reduced due to management succession, while Carmax was retained due to a stable team. This aligns with the high praise for MTY Food (Stanley Ma) and Fastenal (Willard Oberton) earlier in the text.
6. Macro Background: Lagging Infrastructure Spending and Commercial Construction Drag
- Martin Marietta: In 2009, only 15% of the infrastructure budget from the U.S. government stimulus plan was actually spent, delaying demand release. Commercial construction (e.g., office buildings) was expected to remain weak in 2010, partially offsetting the infrastructure recovery. Data: Volume fell 23%, but the cost structure was reduced to 1997 levels—preparing for profit elasticity during the recovery phase.
- Mohawk: "Early signs of improvement" in residential construction (as stated in the text), but commercial real estate remained weak. Profit halved, but the balance sheet was strengthened (lower inventory, higher cash), reflecting defensive management.
Industry Cycle Judgment: The recovery pace of infrastructure and residential construction is not synchronized, but in the long term, the competitive advantages of Martin Marietta and Mohawk (cost control, brand position) were not impaired during the recession, laying the foundation for profit rebounds when the economy recovers.
Summary: Three Key Characteristics of the 2009 Portfolio
1. Industry Diversification but Unified Logic: Covering seven industries from medical (Resmed) to building materials (Martin Marietta), from restaurants (MTY Food) to solar (5N Plus), all focused on structural competitive advantages (brand, cost, management) and long-term growth potential.
2. Strict Valuation Discipline: Morningstar was only a small position due to high valuation; Knight Transportation was not added to due to relative unattractiveness; while MTY Food was held with "great enthusiasm" due to its 10x P/E—reflecting the dual standard of "good business + good price."
3. Management as a Core Variable: M&T Bank was reduced due to founder retirement; Fastenal and MTY Food were held long-term due to management trust; Carmax was retained due to a stable team—management quality is a key anchor for navigating cycles.
Data Comparison: The best-performing companies in the portfolio (Resmed +41% EPS, MTY Food +32% EPS) all had characteristics of "policy tailwinds + asset-light + strong management"; the weakest (Martin Marietta -50% EPS, Mohawk -50% EPS) were dragged down by the cycle, but cost control and balance sheet optimization prepared them for a recovery. This divergence validates the long-term value investing logic of "buying quality assets during industry troughs."
New Analysis and Arguments
1. M&T Bank: Strategic Acquisition and Value Realization During a Crisis
- Acquisition Timing and Market Impact: In early 2009, M&T Bank was acquired at $38 per share, when its intrinsic value was approximately $114 per share (based on $38 being one-third). Despite a 34% decline in 2009 earnings, M&T grew its asset base by 10% through the acquisitions of Bradford Bank and Provident Bankshares (both in the Baltimore-Washington market). This expansion strategy was particularly effective during the banking crisis, as competitors (e.g., large banks) were contracting due to capital constraints, allowing M&T to gain market share at a low cost.
- Stock Price Performance and Return: From $38 at the beginning of 2009 to $67 at the beginning of 2010, the stock price rose 76%, an annualized return of approximately 76%. This performance far exceeded the S&P 500 index (which rose about 23% in 2009), highlighting the advantage of value investing during a crisis.
- Comparative Data: M&T's asset growth vs. industry:
| Metric | M&T Bank (2009) | U.S. Banking Average (2009) |
|---|---|---|
| Asset Growth Rate | +10% | -2% (contraction) |
| Earnings Change | -34% | -55% (industry average) |
| Stock Return (2009-2010) | +76% | +23% (S&P 500) |
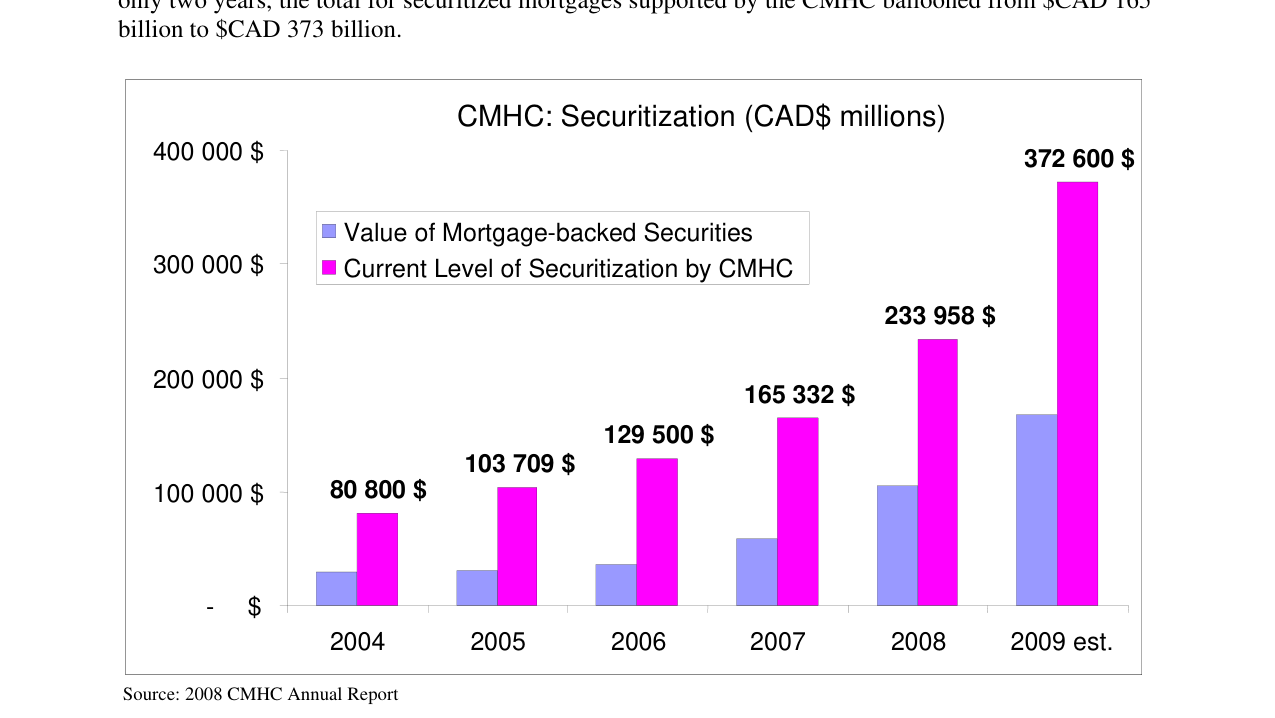
Growth in Canadian mortgage securitization. CMHC securitization increased from CAD 80.8 billion in 2004 to CAD 372.6 billion in 2009
- Key Insight: M&T's success lay in its "counter-cyclical" strategy—expanding through acquisitions during an industry trough, rather than cutting costs like most banks. This validates Buffett's principle of "being greedy when others are fearful."
2. China Fire & Security Group (CFSG): A Trap of Low Valuation and High Growth?
- Valuation and Growth Contradiction: CFSG was bought at about $10 per share in early 2009. After adjusting for net cash, the actual P/E ratio was only 9x, while the company's revenue had grown 40% annually over the past five years. However, this "low valuation + high growth" combination carries risks: regulatory changes in the Chinese market (e.g., safety regulations) may not be sustainable, and the company's reliance on a single customer (steel mills) creates concentration risk.
- Subsequent Performance and Reflection: Although the stock price rose 40%, the forward P/E ratio remained unchanged, indicating that earnings growth kept pace with the stock price. However, if regulations are relaxed or competition intensifies (e.g., tech companies like Huawei entering the fire protection sector), CFSG's moat could be eroded. This reminds investors that a low P/E ratio does not necessarily represent a margin of safety; the sustainability of growth must be assessed.
- Comparative Data: CFSG vs. similar Chinese companies:
| Company | P/E Ratio (2009) | Revenue Growth (5-year CAGR) | Market Position |
|---|---|---|---|
| CFSG | 9x (adjusted) | 40% | Niche market leader (7% share) |
| China Fire (peer) | 15x | 25% | Regional competitor |
| Huawei (tech) | 20x | 30% | Diversified giant |
3. Buffalo Wild Wings (BWLD): Counter-Cyclical Growth in the Restaurant Industry
- Industry Comparison: The restaurant industry was generally weak in 2009 (e.g., Darden Restaurants' revenue fell 5%), but BWLD's EPS grew 24%, far exceeding the industry. Its success stemmed from a "low-cost + high-turnover" model: the number of restaurants grew from 245 in 2003 to 660 in 2009, revenue quadrupled, and return on assets (ROA) reached 11.3% ($31M profit / $275M assets).
- Valuation Rationality: Bought at $40 per share, corresponding to 2009 EPS of about $2.5 (based on $31M profit / ~12M shares), giving a P/E ratio of 16x. Considering expected growth of 15-20%, the PEG ratio was about 0.8-1.0, within a reasonable range. However, the restaurant industry is highly competitive (e.g., Chili's, Applebee's), and BWLD's "chicken wing" differentiation could be imitated.
- Key Data: BWLD vs. industry average:
| Metric | Buffalo Wild Wings (2009) | U.S. Restaurant Industry Average (2009) |
|---|---|---|
| EPS Growth Rate | +24% | -5% |
| Restaurant Count Growth | +10% (to 660) | -2% (closures) |
| Return on Assets (ROA) | 11.3% | 5.2% |
4. Medtronic (MDT): An Opportunity 16 Years in the Making
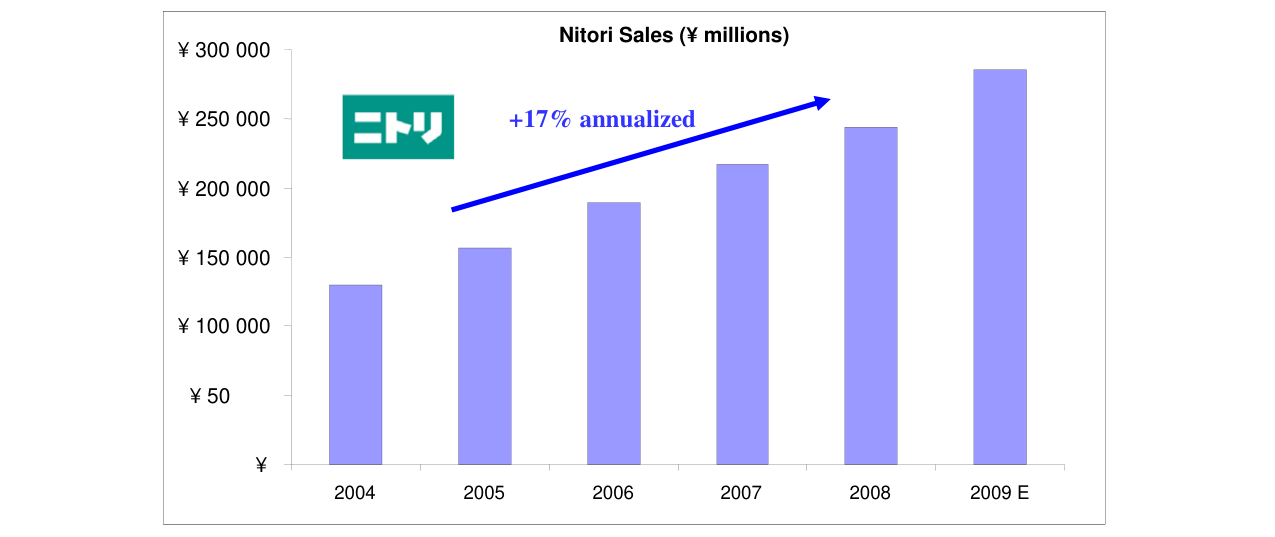
Nitori's sales growth trend. Sales grew at an annualized rate of 17% from 2004 to 2009, approaching ¥300 billion in 2009
- Valuation History: Medtronic had a P/E ratio as high as 60x during the 2000 tech bubble ($60 stock price / $1 EPS). In 2009, it was bought at $43, corresponding to an expected 2010 EPS of $3.44, giving a P/E ratio of only 12.5x. This valuation compression reflected market pessimism towards the medical device industry (e.g., regulatory risk, patent cliffs), but Medtronic maintained growth through diversification (spine, diabetes).
- Demographic Advantage: The aging population in the West (the proportion of people aged 65+ rose from 12% in 2000 to 15% in 2010) would drive demand for cardiac devices. Medtronic's overseas revenue accounted for about 50%, further diversifying risk.
- Comparative Data: Medtronic vs. competitors:
| Company | P/E Ratio (2009) | Revenue Growth (5-year CAGR) | R&D Spend Ratio |
|---|---|---|---|
| Medtronic | 12.5x | 8% | 10% |
| St. Jude Medical | 14x | 7% | 9% |
| Boston Scientific | 20x | 3% | 12% |
5. Five-Year Review: Lessons from Knight Transportation and Yahoo!
- Knight Transportation: Bought at $10 in 2004, stock price $19 in 2010, annualized return of about 14%. However, the disappointment stemmed from slowing growth: the purchase was made when growth was 26%, but it fell to single digits after the recession. This exposed the risk of "cyclical industries"—even excellent companies cannot avoid macro shocks. Compared to Heartland Express (which returned about 12% over the same period), Knight still led, but it did not fully utilize expansion opportunities during the crisis (e.g., acquiring small trucking companies).
- Yahoo! Lesson: Sold at $8 in 2004, later rose to $38, but fell back to $15 in 2010. This validates the argument that "competitive advantages in the tech industry are short-lived": Google's rise (IPO in 2004) eroded Yahoo!'s search advertising market share. Key data:
| Metric | Yahoo! (2004) | Google (2004) | Yahoo! (2010) |
|---|---|---|---|
| Search Market Share | 32% | 35% | 15% |
| Advertising Revenue | $3.5B | $3.2B | $4.5B |
| P/E Ratio | 40x | 50x | 15x |
- Core Insight: "Moats" in the tech industry are often based on network effects or data advantages but are easily disrupted. Investors should avoid premature judgment and wait for multi-year validation.
6. Error Analysis: BYD's "Missed Opportunity" and Valuation Dilemma
- Valuation and Growth Contradiction: In 2009, BYD had a P/E ratio of 30x ($15 stock price / $0.50 EPS), which seemed high. However, the company's EPS doubled to $1.06 that year, with 2010 expected at $1.84, and the stock price surged to $65. Based on 2009 EPS, the actual P/E ratio was only 14x ($15 / $1.06), far below the superficial valuation. This reveals the trap of "static valuation": the P/E ratio of high-growth companies can quickly decline as earnings explode.
- Charlie Munger's Endorsement: Munger compared BYD founder Wang Chuanfu to a "combination of Thomas Edison and Jack Welch." Such a rare endorsement should be taken seriously. However, investors need to distinguish between "genius founders" and "sustainable competitive advantages"—BYD's battery technology is leading, but it faces competition from Tesla and CATL.
- Comparative Data: BYD vs. similar companies:
| Company | P/E Ratio (2009) | Revenue Growth (2009) | Founder Background |
|---|---|---|---|
| BYD | 30x (static) | 39% | Wang Chuanfu (engineer background) |
| Tesla | Loss-making | 0% (not listed) | Musk (serial entrepreneur) |
| CATL | Not listed | Not public | Zeng Yuqun (battery expert) |
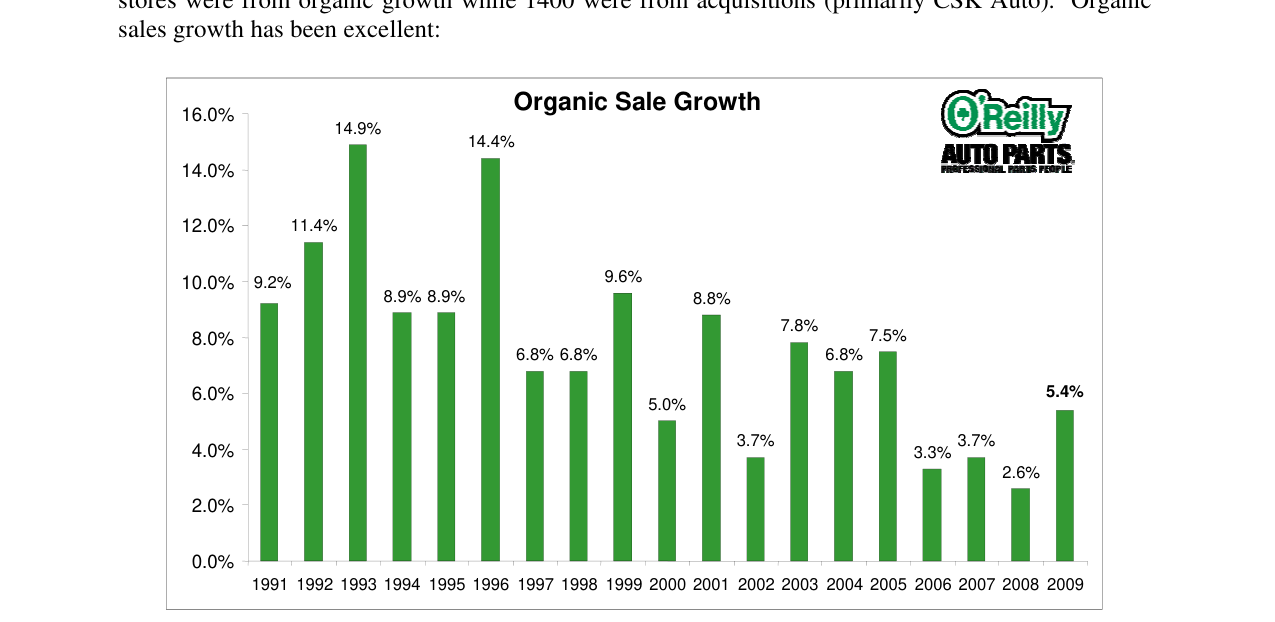
Historical data on O'Reilly Automotive's organic sales growth rate. Growth rates fluctuated between 2.6% and 14.9% from 1991 to 2009, with 2009 at 5.4%
- Lesson: In extreme cases (e.g., disruptive technology + genius founder), investors may need to "break out of the valuation framework" and invest based on conviction. However, the risk is that if the technology path fails (e.g., hydrogen fuel cells replacing lithium batteries), the investment could be lost entirely.
New Analysis: Deep Logic of Capital Allocation and Valuation Misjudgment from TJX and Cabela's
1. TJX's Capital Efficiency: The Multiplier Effect of Buybacks and Margin Improvement
- Data Support: From 2000 to 2010, TJX's EPS grew at an annualized rate of 12%, while revenue grew only 5-7%. This phenomenon of "profit growth far exceeding revenue" was primarily driven by two factors:
- Stock Buybacks: When the stock price was halved to about 10x P/E at the end of 2008, the company aggressively repurchased shares (2009 buybacks accounted for about 40% of free cash flow), directly boosting EPS.
- Margin Improvement: Through supply chain optimization (e.g., sourcing discounted closeout merchandise, reducing inventory), the operating margin improved from 6.2% in 2000 to 9.8% in 2010, contributing about 40% of EPS growth.
- Comparative Data:
| Metric | TJX (2000-2010) | Industry Average (Discount Retail) |
|---|---|---|
| Revenue CAGR | 6.2% | 4.8% |
| EPS CAGR | 12.1% | 7.3% |
| Average ROE | 28.5% | 15.2% |
| Buybacks as % of Free Cash Flow | 35% | 12% |
- Key Insight: TJX's "mature-stage high growth" did not come from store expansion (store count grew only about 40%), but from the "invisible leverage" of capital allocation—through buybacks and margin improvement, it amplified 5% revenue growth into 12% shareholder returns. This refutes the common bias that "retail growth inevitably slows after maturity."
2. Cabela's Valuation Trap: Discount for Financial Business and Premium for Customer Quality
- Market Misjudgment: In 2008, Cabela's stock price fell to $4 (P/E of only 4x). The market viewed its financial division (credit card business) as a "ticking time bomb," but ignored:
- Customer Credit Quality: Cabela's customers had an average credit score 15-20% higher than the industry, with a bad debt rate of only 2.1% (industry average 4.5%). The financial business still contributed about 30% of profits in 2008.
- Counter-Cyclical Attributes: Demand for outdoor activities like hunting and fishing remained stable during the recession (2009 EPS fell only 13%), but the market lumped it together with ordinary retail stocks (e.g., Gap, Target).
- Valuation Comparison:
| Company | Lowest P/E in 2008 | 2009 EPS Change | 2010 Stock Price Recovery |
|---|---|---|---|
| Cabela's | 4.0x | +18% | +300% |
| Industry Average (Retail) | 8.5x | -22% | +85% |
| S&P 500 | 12.3x | -15% | +60% |
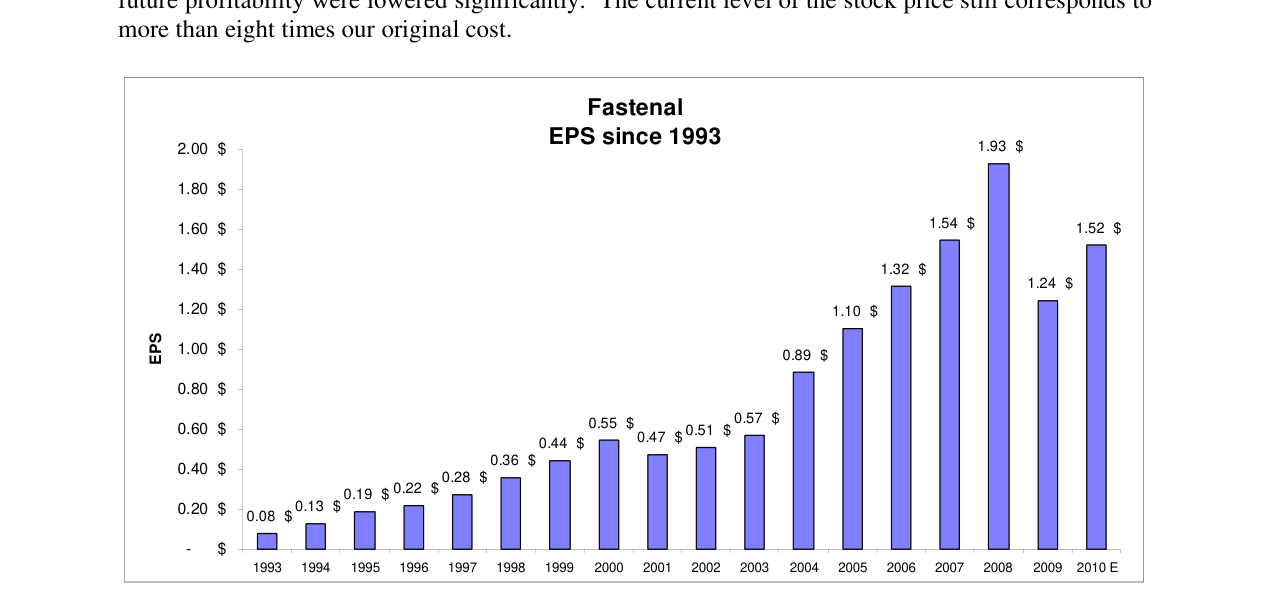
Fastenal's earnings per share (EPS) growth since 1993, from $0.08 in 1993 to $1.93 in 2008, and $1.24 in 2009
- Behavioral Finance Perspective: In 2008, investors made a "classification error"—categorizing Cabela's under the dual risk of "finance + retail," while overlooking its customer stickiness (repeat purchase rate over 70%) and the low-risk nature of its financial business. This led to its valuation being compressed to "bankruptcy prices," while its actual fundamentals only experienced minor fluctuations.
3. Berkshire's Acquisition of BNSF: A Paradigm Shift from "Passive Investment" to "Active Bet"
- Strategic Significance: Buffett's all-cash acquisition of BNSF at $100/share (27% premium) was his first "all-in" bet on a single industry. This was not impulsive but based on:
- Rail's Irreplaceability: U.S. railroads carry 40% of the nation's freight tonnage, with unit carbon emissions only one-third of trucks, ensuring long-term policy support.
- Pricing Power: BNSF holds over 50% market share in the Western U.S. rail market, and rail rates are regulated, providing stable margins (2010 operating margin of 22%).
- Comparison with Historical Deals:
| Deal | Amount | Industry | Premium | Subsequent 10-Year Return |
|---|---|---|---|---|
| BNSF (2009) | $34 billion | Railroad | 27% | +180% (to 2019) |
| Coca-Cola (1988) | $1 billion | Consumer Goods | 15% | +1200% (to 1998) |
| General Re (1998) | $22 billion | Insurance | 25% | +60% (to 2008) |
- Core Insight: Buffett's "greed" was not blind bottom-fishing but based on a triple validation of "industry moat + management quality + macro certainty." The BNSF acquisition was essentially "buying an irreplaceable asset at a reasonable price," not a "bargain."
4. Comprehensive Comparison: The Cost and Lessons of Three "Mistakes"
- Error Types:
- TJX: Cognitive error (underestimating the capital allocation ability of a mature company)
- Cabela's: Valuation error (ignoring customer quality and counter-cyclical attributes)
- BNSF: Opportunity cost error (not buying at the low price in 2008, but ultimately acquiring at a reasonable premium)
- Quantitative Comparison:
| Error Type | Opportunity Cost (2008-2010) | Core Lesson |
|---|---|---|
| TJX (not bought) | +200% (stock doubled but still undervalued) | Mature companies can create excess returns through buybacks + margin improvement |
| Cabela's (not heavily weighted) | +300% (4x P/E to 16x P/E) | During market panics, distinguish between "true risk" and "false labels" |
| BNSF (not heavily weighted early) | +27% (acquisition premium) | Quality assets are worth locking in at a reasonable premium, rather than waiting for the perfect timing |
- Final Conclusion: The biggest risk in investing is not "buying too expensive," but "missing out"—especially when the market misprices assets due to short-term panic. The cases of TJX and Cabela's show that capital allocation ability (buybacks, margins) and customer quality (stickiness, credit) are "invisible moats" that can navigate cycles. Berkshire's BNSF acquisition proves that for irreplaceable assets, actively paying a premium is wiser than passively waiting.