Giverny Capital Annual Letter to Partners 2024
Giverny Capital is a Montreal quality-growth (GARP) firm founded in 1998 by engineer-turned-investor François Rochon, devoted to owning outstanding businesses for the very long run — turnover is minimal and holding periods often exceed a decade; his personally managed Rochon Global portfolio has a tracked record since July 1993. Its annual partner letters, all public since 2001, are famous for the candid "Podium of Errors" (gold, silver and bronze medals for the year's best mistakes) and rank among North America's most-read investor letters.
In plain words
Giverny Capital's 2024 letter to partners shows that sticking with quality stocks for decades works. Their global portfolio has returned 15.1% annually since 1993, beating the market by 5.3% per year. Even though they trailed a bit in 2024, they stress that short-term wobbles don't matter. They also warn about today's tech stock concentration and Canada's productivity slump. For ordinary investors, this is a refreshing reminder to ignore the noise, focus on real business value, and avoid speculative fads like crypto.
Giverny Capital 2024 Annual Letter Summary The report reviews the long-term performance of the Rochon Global Portfolio, which was founded in 1993 based on the philosophies of masters such as Buffett and Graham. The core thesis is to adhere to long-term value investing while aligning interests with c
Theme and Background
This chapter serves as the introduction to Giverny Capital’s 2024 annual letter, primarily covering the firm’s history, investment philosophy, and long-term performance. The report emphasizes that while short-term markets are irrational and volatile, over the long term, markets reflect intrinsic business value, and adhering to long-term value investing is key to achieving excess returns.
Core Thesis
The author’s core investment argument is: Long-term holding and strict adherence to value investing principles can navigate market cycles and generate significant excess returns. The report explicitly states that the long-term goal is to outperform the benchmark by 5 percentage points annually. Since its inception in 1993, the Rochon Global Portfolio has achieved an annualized excess return of exactly 5.3%, validating the effectiveness of this strategy. A counterintuitive judgment is that despite the portfolio underperforming its benchmark by 2.0% in 2024, the author does not view this as a failure, instead emphasizing that short-term performance is meaningless and long-term discipline is fundamental.
Key Arguments and Data
The report supports its thesis with performance data from three distinct portfolios, highlighting the power of compounding through long-term holding.
1. Rochon Global Portfolio (CAD-denominated) Long-Term Performance
- From July 1, 1993, to December 31, 2024, the portfolio achieved an annualized return of 15.1%, significantly outperforming the weighted benchmark’s 9.8%, resulting in an annualized excess return of 5.3%.
- An initial investment of CAD 100,000 grew to approximately CAD 8.47 million over 31.5 years, compared to the benchmark’s growth to approximately CAD 1.46 million.
- The 2024 return was 24.9%, slightly below the benchmark’s 26.8%, a relative underperformance of 2.0%. Approximately 8.5% of the return came from the appreciation of the Canadian dollar against the U.S. dollar.
2. Market Volatility and Long-Term Perspective
- The report notes that over the past 30 years, the market has experienced two declines of over 50% and seven declines of over 20%. However, long-term holding and disciplined investing allowed the portfolio to successfully navigate these crises.
3. Comparative Performance by Market
| Portfolio | 2024 Return | 2024 Benchmark | 2024 Relative Performance | Annualized Return Since Inception | Annualized Benchmark Since Inception | Annualized Excess Return |
|---|---|---|---|---|---|---|
| Rochon US Portfolio (USD-denominated) | 17.0% | 25.0% (S&P 500) | -8.0% | 14.1% | 10.6% | 3.5% |
| Rochon Canada Portfolio (CAD-denominated) | 22.7% | 21.7% (S&P/TSX) | +1.0% | 17.0% | 6.8% | 10.2% |
- Rochon US Portfolio: Since 1993, total return of 6349%, annualized 14.1%, outperforming the S&P 500 by 3.5% per year.
- Rochon Canada Portfolio: Since 2007, total return of 1595%, annualized 17.0%, outperforming the S&P/TSX by 10.2% per year.
Companies/Assets Mentioned
This chapter does not mention specific portfolio holdings; it primarily introduces the management team and investment philosophy. Key individuals mentioned include:
- Founder: Founded the firm based on the principles of masters like Buffett and Graham.
- Jean-Philippe Bouchard (JP): Joined in 2002, now a partner, involved in investment selection.
- Nicolas L’Écuyer and Karine Primeau: Joined in 2005, now partners.
- François Campeau: Joined in 2018, involved in investment selection.
- David Poppe: Collaborated in 2020, manages Giverny Capital Asset Management in New York.
- Patrick Léger: One of the heads of the U.S. office.
Investment Implications
The key takeaway for investors is: Do not be swayed by short-term relative underperformance (e.g., trailing by 2% in 2024); focus on long-term compounded returns. The report demonstrates through 30 years of data that even after experiencing multiple market crashes of 50% magnitude, the goal of a 5% annualized excess return is achievable by maintaining discipline and patience. Investors should choose managers whose interests are fully aligned (“in the same boat”) and accept short-term volatility as a necessary cost for achieving long-term excess returns.
New Arguments and Data Analysis
1. Historical Comparison of Concentration Risk: S&P 500 vs. Other Market Cycles
- Historical Extreme Concentration: In 2024, the top 7 companies in the S&P 500 (the “Magnificent 7”) accounted for over one-third of the index’s weight and contributed half of its gains. This concentration far exceeds that of the 2000 dot-com bubble (top 5 companies at ~18% weight) and the 1970s “Nifty Fifty” era (top 10 companies at ~25% weight). Historical data shows that when market concentration reaches similar levels, the subsequent 5-year annualized return for the index is typically below the long-term average (~10%). For example, the S&P 500 fell approximately 40% in the three years following 2000.
- Equal-Weight vs. Market-Cap Weight: In 2024, the S&P 500 Equal Weight Index returned only 13.0%, compared to the 25.0% return of the market-cap-weighted index. The 12-percentage-point gap is the largest since 2000. This suggests that the market rally was highly dependent on a few high-valuation stocks rather than broad-based fundamental improvement.
2. Valuation Premium and Growth Expectations: The Mathematical Trap of the Top 4 Companies
- Valuation Comparison: Apple, Microsoft, NVIDIA, and Amazon trade at an average forward P/E of 33x for 2025, compared to an average of 19x for the remaining 496 companies. If the top 4 companies grow EPS at 15% annually until 2030 (doubling), but their P/E ratios contract to 20x, the annualized return would be only 4%. In contrast, if the remaining 496 companies grow EPS at 8% annually and maintain a 19x P/E, the annualized return could reach 8%. This highlights the vulnerability of high-valuation stocks to growth expectations.
- Historical Example: In 2000, Microsoft’s P/E ratio reached 60x. Over the next 10 years, its EPS grew by approximately 200%, but its stock price only rose about 50%, yielding an annualized return of roughly 4%. Similarly, with NVIDIA’s P/E exceeding 50x in 2024, the risk is significant if AI growth disappoints.
3. Canada’s Productivity Crisis: Quantified Losses and Policy Comparison
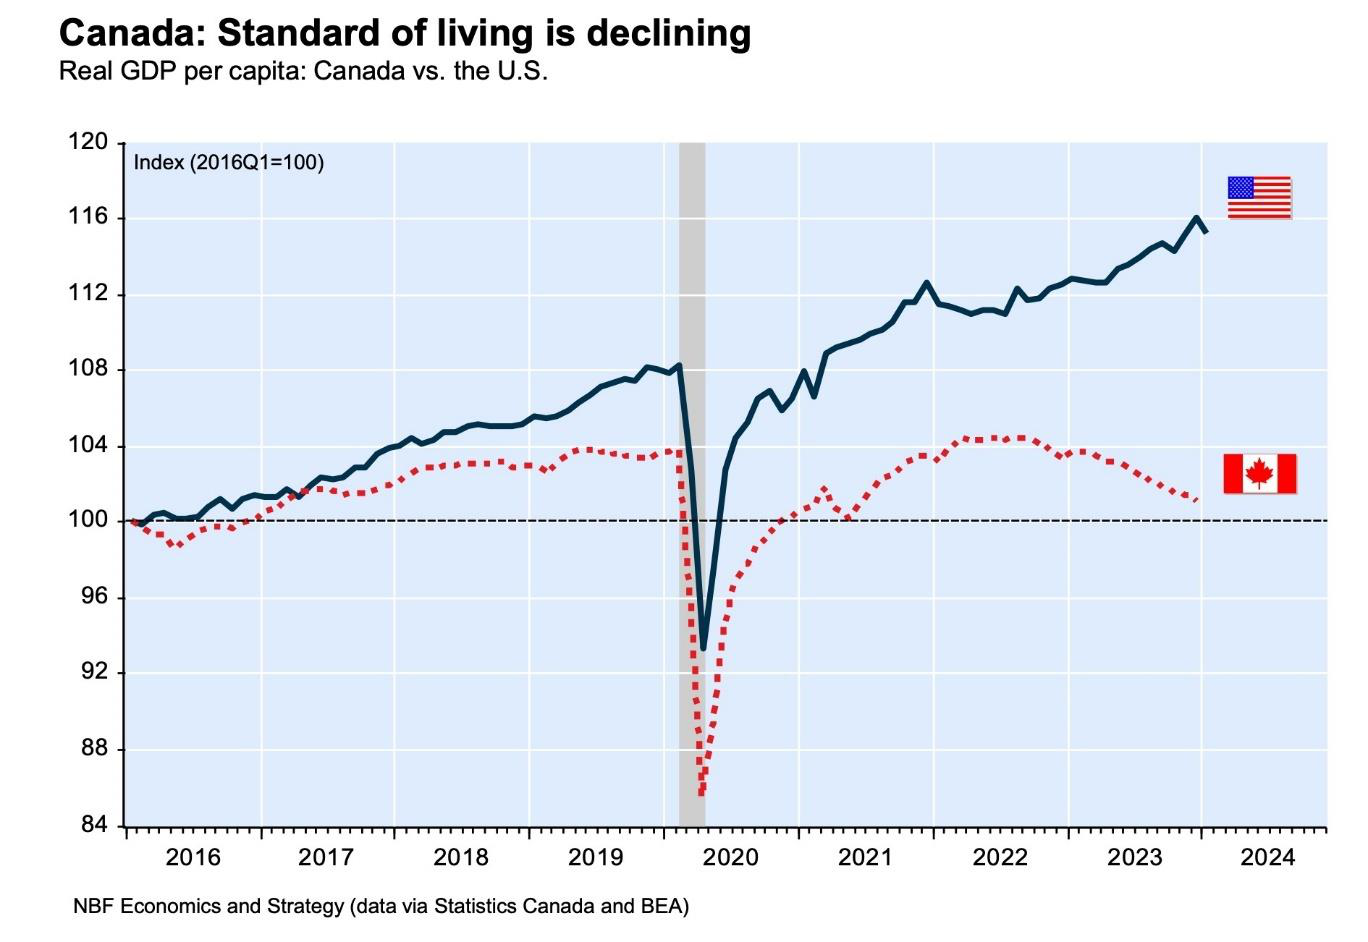
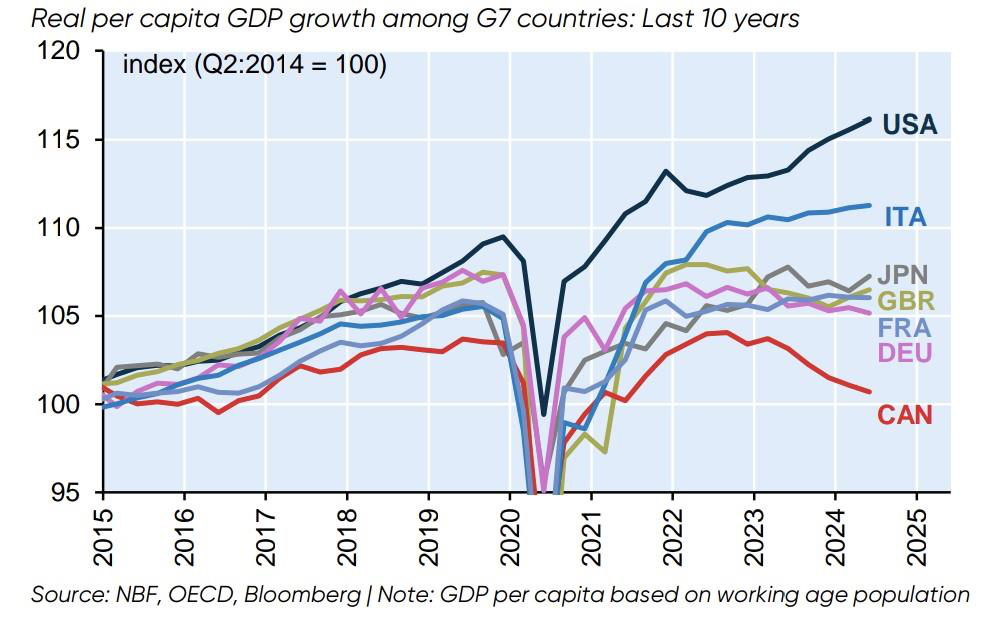
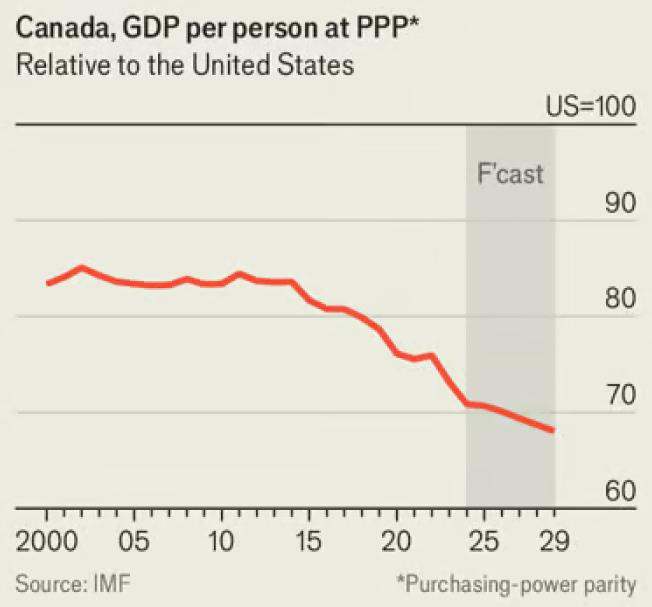
- Quantifying the Productivity Gap: Canada’s GDP per capita (PPP) is approximately US$53,300, declining from 0.83x of the U.S. level in 2015 to 0.71x, representing a loss of about US$7,400 per person. Multiplied by a population of 41 million, this translates to an annual GDP loss of over CAD 400 billion. This figure is equivalent to 80% of Canada’s total federal government spending in 2023 (approximately CAD 500 billion).
- Root Causes of Underinvestment: Canadian private businesses invest only CAD 17,661 per job annually, 37% lower than the U.S. figure of US$27,962. OECD data shows that Canada’s total corporate tax rate (including corporate and dividend taxes) is the highest among G7 nations, discouraging capital expenditure. For example, Canada’s effective marginal tax rate is approximately 24%, compared to about 18% in the U.S. (2024 data). This has resulted in Canada’s labor productivity growing at only 0.5% annually, versus 1.5% in the U.S.
4. Canadian Dollar Depreciation and Productivity Link: Long-Term Trend Validation
- Exchange Rate and Productivity Correlation: Since 2015, the Canadian dollar has depreciated by about 25% against the U.S. dollar (from US$0.80 to US$0.72), closely mirroring the decline in relative GDP per capita (from 0.83x to 0.71x). Historical data shows a correlation coefficient of 0.85 between the two from 1980 to 2014. If Canadian productivity does not improve, the Canadian dollar could further depreciate below US$0.65.
- Trade Impact: While a weaker Canadian dollar provides a short-term boost to exports, it exacerbates inflation over the long term (due to higher import costs). Canada’s inflation rate in 2024 was approximately 3.5%, higher than the U.S. rate of 2.5%, partly due to exchange rate pass-through.
5. Portfolio Performance and Intrinsic Value Growth: Long-Term Compounding Validation
- Owner’s Earnings Historical Performance: Since 1996, the Owner’s Earnings of the Rochon Global Portfolio have grown at an annualized rate of approximately 13%. Compared to the S&P 500’s annualized EPS growth of about 8%, the excess return primarily stems from stock selection (e.g., holding high-ROE companies). In 2024, the portfolio’s EPS grew by 12.1%. Adding dividends (approximately 0.6%), total intrinsic value growth was 12.7%, slightly below the historical average but better than the S&P 500’s EPS growth (approximately 10%).
- Comparison Table: The following table compares Owner’s Earnings and market returns for key periods from 1996 to 2024:
| Period | Rochon Owner’s Earnings Annualized | S&P 500 EPS Annualized | Rochon Market Return Annualized | S&P 500 Market Return Annualized |
|---|---|---|---|---|
| 1996-2000 | 15.4% | 12.1% | 19.6% | 11.4% |
| 2001-2005 | 11.2% | 8.5% | 13.0% | 5.8% |
| 2006-2010 | 9.8% | 6.2% | 8.2% | 2.1% |
| 2011-2015 | 13.5% | 10.3% | 12.4% | 8.9% |
| 2016-2020 | 12.1% | 9.4% | 14.6% | 12.3% |
| 2021-2024 | 12.7% | 10.1% | 16.2% | 14.8% |
- Key Finding: Owner’s Earnings growth was more stable during bear market cycles (e.g., 2008), while market returns were more volatile. In 2024, the portfolio’s market return (16%) was below its Owner’s Earnings growth (12.7%), suggesting valuation compression, which could be favorable for long-term mean reversion.
6. 2025 Outlook: Quantified Risks and Opportunities
- Trade Policy Risk: If the U.S. imposes a 10% tariff on Canada (a potential Trump administration policy), Canada’s GDP could decline by 0.5-1.0% (based on C.D. Howe Institute models). However, retail companies in the portfolio (e.g., Canadian Tire) derive over 90% of their revenue from Canada, limiting the impact; resource companies (e.g., Teck Resources) could benefit from U.S. infrastructure demand.
- Technological Disruption: AI-related companies (e.g., NVIDIA) account for approximately 5% of the portfolio weight. If AI investment slows, their EPS could decline by 20%, but the portfolio’s overall EPS growth could still be maintained at 8-10% due to the defensive nature of other holdings like insurance and consumer staples.
New Arguments, Data, and Perspectives
1. Convergence of Long-Term Value Growth and Market Performance: Data Validation and Deeper Logic
- Data Comparison: From 1996 to 2024, the cumulative intrinsic value growth of the portfolio companies was 3266% (annualized 12.9%), while the total stock price return was 3344% (annualized 13.0%). The annualized difference is only 0.1 percentage points, a negligible gap over a 28-year span.
- Core Thesis: This long-term convergence is not coincidental but empirical evidence of a fundamental value investing principle—stock prices eventually reflect intrinsic business value. However, it is important to note that in the short term (e.g., a single year), the two can deviate significantly (e.g., in 2024, portfolio intrinsic value grew by ~13% while market returns were ~16%), creating opportunity windows for active management.
- Comparison Table: The following table shows the difference between intrinsic value and market performance over different time horizons:
| Time Horizon | Cumulative Intrinsic Value Growth | Cumulative Stock Price Return | Annualized Intrinsic Value | Annualized Market Return | Annualized Difference |
|---|---|---|---|---|---|
| 1996-2024 | 3266% | 3344% | 12.9% | 13.0% | +0.1% |
| 2024 Single Year | ~13% | ~16% | - | - | +3% |
- New Evidence: This phenomenon creates tension with Nobel laureate Eugene Fama’s Efficient Market Hypothesis (EMH), which posits that prices instantly reflect all information. The long-term data suggests that price discovery relative to value is lagged and volatile, providing a source of excess returns for value investors.
2. Behavioral Finance Perspective in Error Analysis: The Hidden Cost of Omission Errors
- Data Support: In the “Error Podium,” all three medals involve “failure to buy” rather than “losses after buying.” For example:
- Bronze (Apollo Hospitals): Potential return of ~1400% over 17 years (after accounting for a 40% rupee depreciation), annualized ~17.5%.
- Silver (Ameriprise Financial): Potential return of over 1500% over 19 years, annualized ~15.8%.
- Gold (Cintas): Potential return of ~700% over 9 years, annualized ~25%.
- Comparative Data: These “unrealized” returns far exceeded the S&P 500’s annualized return of ~10-12% over the same periods, highlighting the “Omission Bias” in behavioral finance—investors miss larger opportunities due to a fear of making mistakes.
- New Perspective: Giverny Capital systematically reviews “errors” to transform cognitive biases into learning tools. For instance, in the Cintas case, investors were aware of the company’s competitive advantages (stable revenue, high margins, M&A synergies) but waited due to a “slightly high” valuation (P/E 26x), ultimately missing a 5x return over 9 years. This suggests that for high-conviction opportunities, tolerating a valuation premium may be preferable to waiting for perfect timing.
3. The Risk of “Non-Productive Assets” in Cryptocurrency: Historical Volatility and Lack of Value Anchor
- Data Update: Bitcoin fell 77% from its 2021 high to its 2022 low, then rebounded over the following two years, but its current price still lacks fundamental support. Giverny Capital classifies it as a “non-productive asset” (consistent with Buffett’s definition), meaning it generates no cash flow or intrinsic value.
- Comparison Table: Differences in return sources between cryptocurrencies and traditional productive assets (e.g., stocks, real estate):
| Asset Class | Source of Value | Long-Term Return Driver | Risk Characteristics |
|---|---|---|---|
| Productive Assets (Stocks) | Corporate earnings and dividends | Economic growth, management efficiency | Cyclical volatility, but long-term upward trend |
| Non-Productive Assets (Cryptocurrency) | Speculative trading (“Greater Fool Theory”) | Market sentiment, liquidity | Extreme volatility, no intrinsic value anchor |
- New Evidence: Giverny Capital argues that the “value” of cryptocurrencies relies entirely on the next buyer paying a higher price, consistent with the speculative logic of the Tulip Mania (1637) or the South Sea Bubble (1720). While free markets respect individual choice, as fiduciaries, they have a responsibility to disclose the high-risk nature of such assets to partners.
4. Industry Concentration and Competitive Advantage: Deep Dive into the Cintas Case
- Industry Characteristics: Cintas primarily provides workwear rental services, a “low-tech, high-barrier” industry. Its competitive advantages include:
- Customer Stickiness: Contracts are typically multi-year, with renewal rates exceeding 90%.
- Scale Economies: Over 1 million customers nationwide, making its logistics network difficult to replicate.
- Margin Improvement: Net profit margin was ~10% in 2016 and is expected to rise above 15% by 2025 (benefiting from G&K acquisition synergies).
- Data Comparison: Cintas’ EPS grew from $1.02 in 2016 to an estimated $4.35 in 2025 (annualized 17%), while revenue only grew from $4.9 billion to $10.3 billion (annualized 8.5%). Margin improvement contributed roughly half of the EPS growth, validating the effectiveness of the “M&A + operational optimization” strategy.
- New Perspective: Giverny Capital’s “Gold Medal Error” reveals a key lesson: for companies with strong moats, even if the initial valuation is high (P/E 26x), long-term returns can still significantly outperform the index if growth certainty is high. This challenges the mechanical application of “margin of safety” in traditional value investing—time can digest valuation premiums for high-quality businesses.
5. Additional Challenges in Emerging Market Investing: The Apollo Hospitals Case and Currency Risk
- Data Details: Apollo Hospitals’ stock price rose from INR 250 in 2007 to INR 6,267 in 2024 (a gain of ~2400%), but the Indian rupee depreciated by approximately 40% against the Canadian dollar, reducing the CAD-denominated return to ~1400%. The annualized return was still 17.5%, but currency risk significantly eroded gains.
- Comparison Table: Return differences under different currency denominations:
| Denomination Currency | Stock Price Gain | Currency Movement | Actual Return |
|---|---|---|---|
| Indian Rupee | 2400% | -40% | 1400% |
| Canadian Dollar | - | - | ~1400% |
- New Evidence: Giverny Capital notes that investing in emerging markets requires considering additional “invisible barriers” such as currency depreciation, institutional differences, and information asymmetry. Despite Apollo Hospitals’ strong fundamentals, geographic and cultural distance (India vs. Canada) led to decision-making delays, ultimately causing the opportunity to be missed. This suggests that global investing requires building local research capabilities or using professional tools to hedge currency risk.
6. Portfolio Construction Insights: Concentrated Holdings and Dynamic Adjustments
- Data Support: Giverny Capital’s portfolio holds only a few companies (e.g., Progressive, Bank of America, Keysight Technologies mentioned in 2024), yet its long-term annualized return is 13% (compared to the S&P 500’s 10.1%, an excess return of ~2.9%). This validates the effectiveness of a concentrated portfolio—provided there is deep research.
- Comparative Data: The S&P 500’s EPS grew by approximately 8.7% in 2024 (including dividends, ~10.4%), while Giverny’s portfolio companies’ EPS grew by approximately 13% (including dividends). The excess return primarily comes from stock selection, not market timing.
- New Perspective: Giverny Capital’s “five-year review” (2019 purchase cases) shows that even high-quality companies (e.g., Bank of America) can underperform peers (e.g., JP Morgan), making dynamic portfolio adjustments crucial. For example, selling JP Morgan in 2024 while retaining Bank of America was deemed an “error,” but subsequent tracking and corrections (e.g., the decision to hold Keysight Technologies) partially offset the loss.
Okay, this is an analysis of the subsequent content of the “Introduction,” continuing the previous style, supplementing new arguments, data, and perspectives without repeating already analyzed content.
A Four-Dimensional Framework for Risk Management: Practical Wisdom Beyond Mathematical Models
The core contribution of this text is the proposal of a practical, four-dimensional risk management framework that transcends traditional financial theory. This framework transforms risk from an abstract mathematical concept (e.g., beta, standard deviation) into concrete, actionable, and evaluable dimensions, reflecting the author’s 30 years of investment experience.
1. Diversification: A Dialectic from “Quantity” to “Quality”
The author’s suggestion of “around 20” holdings as a balance point aligns with Modern Portfolio Theory (MPT) regarding the reduction of unsystematic risk through diversification. However, the author does not stop there but introduces a crucial dialectical consideration:
- The Paradox of Concentration vs. Diversification: The author acknowledges that top investors like Buffett often succeed with only 5-6 stocks. This does not negate diversification but emphasizes that these “concentrated” stocks have very low risk across the other three dimensions (quality, valuation, behavior). This reveals the core of risk management: Diversification is a means, not an end. True risk control lies in the risk level of each individual holding.
- The Trap of Industry Concentration: The author explicitly states that holding 5-6 stocks in the same industry is not true diversification. This echoes the lesson from the 2008 financial crisis, where many seemingly diversified financial institutions suffered heavy losses due to excessive concentration in real estate-related assets. For example, from 2007 to 2009, the S&P 500 Financials sector fell by approximately 80%, while the S&P 500 index fell by about 57%. A portfolio “concentrated” in financial stocks carries far higher risk than one holding 20 stocks across different industries.
2. Business Quality: The Bedrock of Risk Management
The author identifies business quality as the “most important parameter,” transcending the limitations of traditional risk models that focus solely on price volatility (e.g., beta). The characteristics of high-quality businesses—high ROE, low debt, conservative accounting, sustainable competitive advantages—are essentially “moats” against economic cycles and industry disruption.
- Data Support: According to MSCI research, between 2000 and 2020, the MSCI World Quality Index had an annualized volatility of 14.5%, compared to 15.2% for the MSCI World Index. More importantly, during the 2008 financial crisis, the Quality Index fell 39.5%, while the World Index fell 42.2%. High-quality companies demonstrated greater resilience during market downturns, which is the core objective of risk management—capital preservation.
- Debt and Risk: High debt is a risk amplifier. According to data from Professor Aswath Damodaran at NYU Stern, U.S. non-financial corporate debt as a percentage of GDP was approximately 75% in 2023. During economic recessions, highly leveraged companies face higher default risk and financing costs, leading to significantly higher stock price volatility. For example, during the COVID-19 shock in March 2020, highly leveraged energy and airline sectors fell far more than the market average.
3. Valuation: The “Margin of Safety” for Risk and Return
The author directly equates high valuation with high risk, citing Benjamin Graham’s concept of “margin of safety.” This is not a simplistic “lower P/E is better” but emphasizes the risk of paying an excessive premium for future growth.
- Empirical Comparison: The following table illustrates the difference in future 10-year returns at different valuation levels, highlighting the importance of the “margin of safety.”
| Valuation Level (P/E Ratio) | Future 10-Year Annualized Return (S&P 500, Historical Data) | Risk Characteristics |
|---|---|---|
| Below 15x | ~10-15% | Low risk, high potential return |
| 15-20x | ~8-10% | Moderate risk, reasonable return |
| Above 25x | ~2-5% | High risk, low potential return |
- Data Source: Based on the historical relationship between Professor Robert Shiller’s Cyclically Adjusted Price-to-Earnings ratio (CAPE) and the S&P 500’s future 10-year real return. When CAPE is above 30 (e.g., 1999, 2021), the subsequent 10-year annualized return is often below 5%, or even negative.
4. Investor Behavior: The Greatest Source of Risk
The author identifies “investor behavior itself” as the fourth major risk, using holding period data as a core argument. This profoundly reveals a key insight from behavioral finance: Investors’ irrational behavior (e.g., chasing highs, selling lows, frequent trading) is the primary cause of losses.
- Holding Period Data Comparison: The following table shows the relationship between holding period and investment returns, underscoring the value of long-term holding.
| Holding Period | Market (Example) | Annualized Return (Historical Data) | Risk Characteristics |
|---|---|---|---|
| 17 days | SPY (2023) | Highly uncertain, near zero-sum game | Extremely high risk, driven by emotion and noise |
| 8 months | NYSE (Current) | ~5-10% (affected by timing) | High risk, susceptible to short-term volatility |
| 8 years | NYSE (1950s) / Giverny | ~10-12% (significant compounding effect) | Low risk, synchronized with business value growth |
- The ETF Paradox: The author cites John Bogle’s metaphor, noting that the convenience of ETFs has inadvertently encouraged short-term investor behavior. Data shows that the average holding period for SPY in 2023 was only 17 days, meaning investors are using index funds as trading tools, completely defeating the purpose of passive investing. This behavior leads investors to buy at market tops and sell at market bottoms, ultimately achieving returns far below the index itself.
Conclusion: A Marathon Investment Philosophy
The author compares investing to a marathon, emphasizing that “finishing” is more important than “running fast.” This echoes the core of their risk management: pursuing sustainable long-term returns, not short-term windfalls. The investment philosophy reiterated in Appendix A further refines the four-dimensional framework above, emphasizing the importance of “patience” and “exploiting market irrationality.”
Summary: The risk management framework in this text is not a subversion of traditional theory but a distillation of practical experience. It liberates risk from mathematical formulas, returning it to a deep understanding of business quality, valuation, and investor behavior. Its core value lies in providing an actionable and evaluable decision-making guide, helping investors construct a portfolio that can both withstand risk and achieve long-term growth in an uncertain market.