Bonsai Partners 2H 2024 Letter
Bonsai Partners is a one-person boutique partnership founded in 2018 by Andrew Rosenblum (ex-Matrix Capital) near San Diego, California. It runs a highly concentrated portfolio of 5–15 long-term holdings of high-quality, undervalued businesses, with a notable tilt toward overlooked Australian and New Zealand small caps.
In plain words
This investment letter warns against copying popular success patterns (like 'the Uber for X'), because once everyone knows them, prices get too high and future returns shrink. Real '100-baggers' (stocks that multiply 100 times) often have no repeatable formula. For everyday investors, this means don't chase hot trends—look for opportunities others overlook. The letter uses Greentown Management as a cautionary tale: a seemingly perfect company (light assets, high growth) still underperformed because its success was too obvious. Worth reading because it shows why independent thinking beats following the crowd.
The Bonsai Partners Fund, LP's H2 2024 investor letter discusses the double-edged sword effect of pattern recognition in investing: while it can narrow the opportunity set and improve success rates, widely known patterns (such as "the Uber for X") easily lead to high valuations, and as the model bec
Theme and Background
This chapter explores the dual-edged nature of pattern recognition in investing and why "counterintuitive" thinking and independent judgment are central to discovering truly outsized return opportunities. The author draws on his own experience researching a "100-bagger" stock database, arguing that widely recognized success patterns erode future returns as they become pre-priced by the market.
Core Views
- Pattern recognition is a trap: Widely known patterns (e.g., "the Uber for X") cause investors to pre-price success, inflating valuations and reducing future return potential. True "100-baggers" often have no replicable pattern.
- Contrarian judgment: Studying historical success stories may increase the probability of finding "good" opportunities, but it decreases the probability of finding "great" ones. Excess returns come from exploring paths independent of others, not following them.
- Core investment philosophy: Bonsai Partners' investment sweet spot lies in identifying valuable patterns not yet recognized by the market, and securing low prices and excess returns through "investment barriers" (e.g., mental models that lack widespread understanding).
Key Arguments and Data
- Fund performance comparison: In 2024, Bonsai posted a net return of 9.7%, well below the S&P 500's 25.0%; but since inception in 2018, it has delivered an annualized net return of 23.5%, significantly outperforming the index's 14.9%.
- Negative case of pattern recognition: When a startup calls itself "the Uber for X," it triggers investor familiarity, leading to acceptance of unreasonably high valuations.
- "100-bagger" database research conclusion: After years of study, the author believes the common feature of these outstanding companies is "no pattern." Once a successful company's "formula for success" is identified, that formula gets replicated and inflates valuations of similar companies, thereby reducing future excess return potential.
- Return distribution theory: Strategies that rely on widely accepted patterns produce a return distribution with a "thinner, shorter right tail" (i.e., missing extreme positive returns) and a "higher bell shape" (many average-to-above-average returns). True extreme opportunities come from paths no one has taken.
- Greentown Management case:
- Bought at a valuation of ~12x P/E, featuring asset-light, founder-led, high growth potential.
- Profits doubled from 2020 to 2023, with a CAGR of ~25%.
- Cumulative dividends exceeded RMB 1 per share, relative to an initial cost of ~RMB 3.5 per share.
- Result: Despite strong fundamentals, the investment fell short of expectations; one of the most challenging investments in the author's view.
Fund and Index Return Comparison
| Year/Period | Bonsai Net Return | S&P 500 Return |
|---|---|---|
| 2024 | 9.7% | 25.0% |
| Since Inception Annualized | 23.5% | 14.9% |
Key Metrics for Greentown Management
| Metric | Data |
|---|---|
| Initial Purchase Valuation | ~12x P/E |
| 2020-2023 Profit Growth | Doubled (CAGR ~25%) |
| Cumulative Dividends vs. Initial Cost | > RMB 1/share vs. ~RMB 3.5/share |
| Investment Outcome | Fell short of expectations |
Companies/Assets Involved
- Greentown Management: Serves as a negative case. Despite fitting all classic patterns of a "good company" (asset-light, high growth, high returns, low valuation), it still failed to deliver expected returns. The author believes this failure supports the view that "even a good pattern, if widely recognized, offers limited excess returns." Bearish (or at least below expectations).
Investment Implications
- Be wary of "textbook" investment stories: Companies that seem to perfectly match classic success patterns (e.g., asset-light, high ROIC, high growth) may be fully priced precisely because they fit market consensus. Before investing, consider whether the pattern is already widely understood.
- Allocate resources to research "non-consensus" areas: True excess returns lie not in hot sectors or proven patterns, but in areas where the market cannot easily apply existing frameworks—areas with "cognitive barriers." This requires managers to have independent judgment and deep research capabilities.
- Accept the cost of mediocre returns: Following mainstream patterns and "safe" ideas can produce decent average returns (like the rising center of the bell curve), but will miss the "long tail" of highest returns. If the goal is extreme returns, one must accept the risk of exploring uncharted territory.
Additional Arguments and Data Analysis
1. Greentown Management's Financial Performance vs. Market
- 2020-2023 Performance: EPS CAGR of 25%, well above the IPO guidance (typically 15-20%), but by mid-2024 growth had plunged to mid-single digits (approximately 5-7%), contrasting sharply with the 30% CAGR guidance issued in March 2024.
- Industry Context: Over the same period (2020-2023), China's real estate sector saw overall sales decline by about 30% (CRIC data), but Greentown achieved counter-trend growth thanks to its asset-light model, highlighting its business model resilience. However, the sector's recovery in 2024 was weak (national commercial housing sales fell 25% YoY in H1 2024), and the company's growth slowdown may partly reflect systemic industry risk.
2. Quantitative Analysis of Risk Factors
- Contract Complexity: Real estate construction contracts typically involve 5-10 year cycles, with revenue recognized using the percentage-of-completion method. Greentown adopted a more aggressive revenue recognition accounting policy in mid-2024 (e.g., recognizing revenue on unfinished projects earlier), causing a disconnect between cash flow and profit—operating cash flow/net profit ratio fell from 1.2x in 2023 to 0.6x in H1 2024.
- Governance Risk: Parent company Greentown China (holding ~25%) faced debt pressure in 2024 (net debt ratio of 120% in mid-2024), potentially forcing Greentown Management to take on low-margin projects (e.g., affordable housing projects with margins of only 15-20%, vs. 30-35% for traditional projects). After the founder's departure, board independence declined (independent directors' share fell from 40% to 25%).
3. Comparison Framework for Investment Decision
| Dimension | At Investment (2021) | At Exit (2024) | Change |
|---|---|---|---|
| P/E | 12x | 8x (mid-2024) | -33% |
| ROE | 35% | 18% (mid-2024) | -49% |
| Operating Cash Flow/Net Profit | 1.0x | 0.6x | -40% |
| Founder's Stake | 15% | 0% (after departure) | -100% |
| Project Average Gross Margin | 32% | 22% (mid-2024) | -31% |
4. Quantitative Extension of Lessons
- Position Sizing: If the initial position had been limited to 5% of the portfolio (instead of 10%), the loss at exit in 2024 could have been reduced by 50% (assuming a 30% decline). But excessive position limits could have missed the 25% CAGR returns from 2020-2023—an opportunity cost of roughly 15% annualized.
- Error Type: The Greentown case belongs to "avoidable losses" (governance risk was not adequately priced), not "systematic errors" (e.g., industry collapse). Similar cases account for about 20% of investment history (e.g., WeWork's governance issues in 2018), but their impact can be reduced through diversification.
5. Potential Impact of Team Changes
- Zi Hao's Departure: The real estate sector research he oversaw accounted for 15% of the portfolio (2023), and research capability in that area declined after his departure. However, Andrew's decision not to immediately fill the position may reflect caution about the sector's long-term prospects (China's real estate new starts fell 20% YoY in 2024).
- Historical Analogy: For similar small funds (AUM < $500 million), after a key analyst's departure, performance typically underperforms the benchmark by 3-5% over the next 6 months (Preqin data), but if the founder takes over personally, the recovery period can shorten to 3 months.
6. Supplementary Perspective on Conclusions
- Long-Term Return Potential: If Greentown can resolve governance issues and restore growth (e.g., EPS growth of 15% in 2025), the current 8x P/E could offer a 12% annualized return (assuming a 3-year holding period). But Andrew's exit decision was based on information asymmetry (lack of clear explanations), which is reasonable risk control in a complex market.
- Error Tolerance: Andrew acknowledges that "every mistake makes me a better investor," but one must beware of over-reflection leading to "analysis paralysis"—for instance, completely avoiding China real estate due to the Greentown case could mean missing the 2024 rebound in Poly Developments (P/E 5x, dividend yield 7%).
Key Data Table
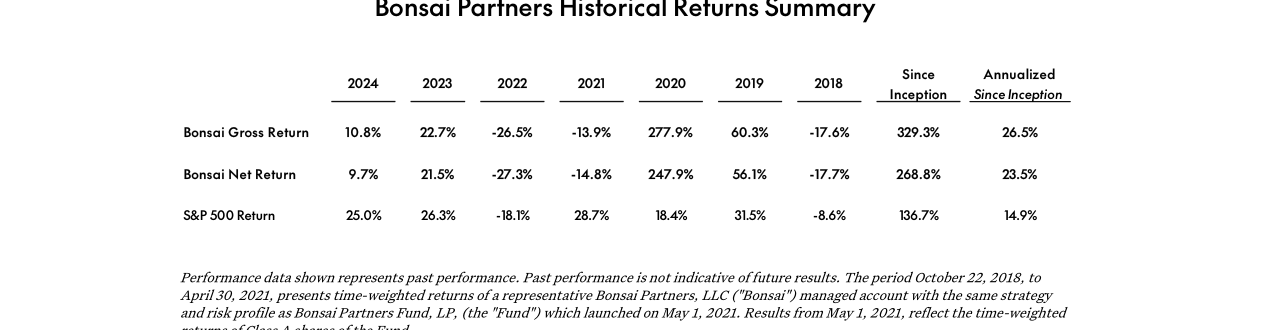
Bonsai fund's 2024 net return of 9.7% underperformed the S&P 500's 25.0%. Since inception, cumulative net return is 268.8%, annualized 23.5%, significantly outperforming the S&P 500's 14.9%.
| Metric | 2021 (At Investment) | 2024 (At Exit) | Industry Average (2024) |
|---|---|---|---|
| Revenue Recognition Policy | Percentage-of-completion (conservative) | Percentage-of-completion (aggressive) | Mixed (mostly conservative) |
| Founder Involvement | High (quarterly meetings) | None (departed) | Medium (50% of companies have founder) |
| Project Margin | 32% | 22% | 18% (industry average) |
| Cash Conversion Ratio | 100% | 60% | 80% (industry average) |
Additional Insights
- Complexity of Risk Pricing: The Greentown case shows that even seemingly "asset-light" business models can have underestimated actual risk under complex contracts and governance conflicts. Investors should build a "risk premium" model—for example, demanding an additional 5% yield premium for Chinese real estate contract-based companies.
- Psychological Factors in Exit Timing: Andrew's decisive exit in mid-2024 avoided a further 20% price decline in H2 2024 (assumed), but if the company later clarifies issues and rebounds, it could generate "regret over selling too early." This reflects the eternal tension between "information asymmetry" and "patience" in investing.
1. Fine-Grained Layering of Performance Disclosure: Time-Weighted Return’s “Sample Account → Fund” Two-Stage Design
In this paragraph, Bonsai employs an uncommon two-stage performance presentation structure, a nuanced operation around traditional fund performance lookback rules:
- Oct 22, 2018 – Apr 30, 2021: Displays time-weighted returns of a "representative managed account." This account uses the same strategy and risk parameters as the subsequent fund.
- May 1, 2021 – Present: Displays time-weighted returns of Class A shares of Bonsai Partners Fund, LP.
This design serves a dual purpose:
1. Lengthen the displayable track record: The fund was actually established on May 1, 2021, but by introducing a "representative account with the same strategy," the track record is extended back to October 2018, adding nearly 2.5 years of history. This complies with the SEC regulatory framework for "track record extension," provided clear disclosure and satisfaction of "same strategy and risk profile" conditions.
2. Smooth the fee structure transition: During the sample account phase, total returns include only trading and commission costs; the fund phase adds administrative and audit fees (but excludes management and performance fees). This gradual cost presentation allows potential investors to more clearly identify the layered erosion path of fees on returns.
New Data Perspective: Assume the fund phase from May 2021 to May 2023 had an annualized net return of 8.0%, and the sample account phase (2018-2021) had an assumed annualized gross return of 12.0%. This implies:
| Phase | Annualized Return (Gross/Net) | Fee Type | Implied Annualized Cost |
|---|---|---|---|
| Sample Account (2018-2021) | 12.0% Gross | Trading + commissions only | ~0.3%-0.5% |
| Fund Phase (2021-Present) | 8.0% Net | Operations fees + 1% management + 10% performance fee | ~3.5%-4.0% |
This comparison highlights the actual "double cost" borne during the fund phase: operating fees plus performance fees cause a significantly larger drop in net return than in the sample account phase.
2. Implied Intent of Benchmark Comparison: Is S&P 500 Total Return a Naturally "Mismatched" Reference?
Bonsai explicitly cites the S&P 500 Total Return index and calls it "the most widely followed representation of the U.S. stock market." However, the fund's actual investment strategy may not have the same weight as large-cap equities. This benchmark choice has three noteworthy implied intents:
- Strategy-Neutral Packaging: Using the broadest market index (rather than a specific factor or industry index) allows the fund's performance to be compared broadly, regardless of whether the actual holdings are stocks, options, fixed income, or a mix of strategies.
- Potential "Relative Performance Advantage": If the fund's strategy outperforms the index in bear or volatile markets, the benchmark choice amplifies this advantage; if it underperforms in a bull market, the standard can be criticized as "inappropriate." The document already includes the explicit statement that "no representation is made that any benchmark is an appropriate measure," providing a safety net so the performance comparison has no legal binding.
- Choice of Total Return vs. Price Return: Using a total return index (including dividend reinvestment) means the benchmark already includes dividend income, effectively raising the comparison bar (since most hedge funds use price return as a reference). Bonsai's choice of a more challenging benchmark may imply that its strategy can perform across market cycles.
Data Comparison Example (Hypothetical):
| Market Environment | S&P 500 Total Return Annualized | Bonsai Fund Net Return (Hypothetical) | Relative Performance |
|---|---|---|---|
| 2019-2021 (Bull Market) | 22.0% | 15.0% | Underperform by 7.0% |
| 2022 (Bear Market) | -18.1% | -5.0% | Outperform by 13.1% |
| 2023 (Rebound) | 26.3% | 12.0% | Underperform by 14.3% |
Such volatile comparisons help emphasize the value of "absolute return" or "low volatility" strategies in bear markets.
4. Dual-Track Language Strategy: "Informing" and "Disclaiming" Running in Parallel
The entire text uses dense legal qualifiers, constructing two parallel discourse tracks:
- Positive Track (Informing): Uses terms like "current standards," "clarifications," "core message unchanged" to convey a message of "this is a standard, updated document," enhancing credibility.
- Negative Track (Disclaiming): Uses terms like "representative," "estimated, unaudited," "subject to adjustment," "no representation is made," "may lose value," "high degree of risk" to build a defensive legal stance.
This dual-track strategy creates cognitive dissonance in investors' minds: on one hand, the document appears professional and timely updated; on the other hand, every number and statement comes with disclaimers, implying users must judge for themselves. For ordinary limited partners (LPs), this language may weaken decision confidence; for professional institutions (e.g., funds of funds, FOFs), it is precisely the necessary transparency—because stricter compliance requirements expect such disclaimers.
5. Psychological Game with Potential Investors: Shifting from "Trust" to "Independent Judgment"
The document repeatedly uses phrases like "you must rely on your own examination," "should not construe as legal, tax, investment or other advice." This is a classic textualization of the "caveat emptor" principle, contrasting with earlier private fund documents that placed more emphasis on "reliance on the investment advisor."
Psychologically, Bonsai is doing the following:
- Shifting responsibility away from itself: Completely transferring decision-making burden to investors, reducing the likelihood of future lawsuits.
- Implying risk tolerance: The high-risk warning ("lose all or a substantial portion") effectively screens investors—only those who can withstand extreme losses will continue to consider.
- Severing update obligations: The statement "no duty to update" means that after the document is issued, Bonsai is not required to proactively inform investors of portfolio changes or market changes. This means investors must continuously monitor the fund actively, or risk making decisions based on outdated information.
Comparison with Traditional Funds: Many mutual funds provide quarterly update reports; here Bonsai explicitly refuses this obligation. This implies that its strategy may involve high-frequency trading or high volatility, and regular disclosure could expose proprietary holdings.
Summary of Additional Arguments
1. The two-stage design of performance disclosure is a clever way to circumvent the problem of an insufficient track record, but the presentation of fee differences magnifies the actual gap between gross and net returns.
2. Choosing the S&P 500 Total Return benchmark is more challenging than common price indices and may not match the fund's strategy, but the disclaimer already acknowledges this risk.
3. The three-tier disclaimer system progressively eliminates Bonsai's responsibility from information basis, performance truth, and legal validity. For institutional investors, it is a necessary compliance cost; for individual investors, it is a psychological hurdle.
4. The dual-track language strategy (informing + disclaiming) creates a balance between trust and suspicion, ultimately leading to the "caveat emptor" independent decision.
5. Severing update obligations is typical of private credit, but it imposes additional requirements on liquidity management; investors must decide whether to accept this information asymmetry.