Giverny Capital Annual Letter to Partners 2020
Giverny Capital is a Montreal quality-growth (GARP) firm founded in 1998 by engineer-turned-investor François Rochon, devoted to owning outstanding businesses for the very long run — turnover is minimal and holding periods often exceed a decade; his personally managed Rochon Global portfolio has a tracked record since July 1993. Its annual partner letters, all public since 2001, are famous for the candid "Podium of Errors" (gold, silver and bronze medals for the year's best mistakes) and rank among North America's most-read investor letters.
In plain words
This is Giverny Capital's 2020 letter to partners. The main idea: stock markets are crazy in the short term but reward good companies over the long run. During the 2020 pandemic crash, they saw it as a chance to buy quality stocks at a discount. Their portfolio returned 12.9% in 2020, slightly below the 15.1% benchmark, but over 27 years their annual return was 15.3% vs. 9.5% for the index. They show that ignoring short-term noise and holding great businesses patiently is the real path to wealth. Worth reading for concrete proof that long-term investing beats market timing.
Giverny Capital's 2020 annual letter reviews its investment journey since 1993, with the core philosophy of adhering to long-term value investing, treating clients as partners, and emphasizing alignment of interests with clients. In 2020, the Rochon Global Portfolio returned 12.9%, underperforming t
Theme and Background
This chapter is the introduction to Giverny Capital's 2020 annual letter. It primarily reviews the firm's development since 1993, its investment philosophy, and provides a detailed disclosure of its investment performance for 2020 and the long term. The report emphasizes its core principle of "being in the same boat as clients," treating clients as partners, and adhering to a long-term value investing philosophy.
Core Thesis
The author's core investment argument is: Short-term markets are irrational and unpredictable, but over the long term, they reflect a company's intrinsic value. As long as the stock selection process is sound and rational, investment returns will eventually follow. A counterintuitive judgment is that despite the severe market volatility in 2020 due to the pandemic, Giverny believes this presented an opportunity to buy high-quality companies at attractive valuations.
Key Arguments and Data
The report supports the effectiveness of its long-term investment philosophy with detailed performance data:
- Significant Long-Term Outperformance vs. Benchmark: From its inception on July 1, 1993, to the end of 2020, the Rochon Global Portfolio achieved an annualized return of 15.3%, compared to the benchmark's 9.5%, generating an annualized excess return of 5.9%. In terms of total return, the portfolio returned 4969.2%, versus 1103.5% for the benchmark.
- Relative Underperformance in 2020: In 2020, the Rochon Global Portfolio returned 12.9%, underperforming the benchmark's 15.1% by 2.2%. Approximately 2% of this loss was attributed to the fluctuation of the Canadian dollar.
- Divergent Performance of US and Canada Sub-Portfolios:
- Rochon US Portfolio: Returned 16.0% in 2020, lagging the S&P 500's 18.4% (underperformance of 2.4%). However, since 1993, its annualized return of 14.7% still outperformed the S&P 500's 10.2% (annualized excess of 4.5%). The report notes the underperformance was due to a lower allocation to the high-tech sector compared to the index.
- Rochon Canada Portfolio: Returned 12.1% in 2020, significantly outperforming the S&P/TSX Index's 5.6% (excess return of 6.5%). Since its inception in 2007, its annualized return of 16.1% far exceeds the index's 5.2%, resulting in an annualized excess return of 10.9%. The main contributor was its largest holding, which rose 31% in 2020.
Key Performance Comparison Table (as of December 31, 2020):
| Portfolio | 2020 Return | Benchmark Return | 2020 Excess | Inception Annualized Return | Benchmark Annualized Return | Annualized Excess |
|---|---|---|---|---|---|---|
| Rochon Global Portfolio | 12.9% | 15.1% | -2.2% | 15.3% | 9.5% | 5.9% |
| Rochon US Portfolio | 16.0% | 18.4% | -2.4% | 14.7% | 10.2% | 4.5% |
| Rochon Canada Portfolio | 12.1% | 5.6% | +6.5% | 16.1% | 5.2% | 10.9% |
- Market Volatility: In March 2020, the S&P 500 fell 35% from its peak, and the Russell 2000 fell 40%, with a decline speed comparable to the 1987 crash. The report argues this created attractive valuation buying opportunities.
Companies/Assets Involved
- Giverny Capital Inc.: The subject of the report, an investment management firm adhering to a long-term value investing philosophy.
- Rochon Global Portfolio: A family investment portfolio managed since 1993, serving as the model for all client accounts.
- Rochon US Portfolio: The US portion of the Rochon Global Portfolio, denominated in US dollars.
- Rochon Canada Portfolio: The Canadian portion of the Rochon Global Portfolio, 100% invested in Canadian equities.
- Largest Canadian Holding (unnamed): Rose 31% in 2020 and was the primary source of the Canada portfolio's excess return. The report holds a bullish view on this holding.
Investment Implications
- Adhere to Long-Termism: Short-term performance fluctuations (like the relative underperformance in 2020) should not shake confidence in a proven long-term investment philosophy. Giverny's 27-year track record with an annualized excess return of 5.9% demonstrates the effectiveness of its approach.
- The Power of Concentrated Investing: The Canada portfolio has generated an annualized excess return of 10.9% since 2007. The report explicitly states that "concentrated portfolios can significantly outperform indices." Investors should focus on a select few high-quality, deeply researched companies.
- Exploit Market Panic: The report implies that rapid, sharp market declines caused by extreme events (like a pandemic) are excellent opportunities to buy companies with attractive valuations.
- Be Aware of Currency Risk: The report specifically notes that approximately 2% of the loss in 2020 came from Canadian dollar fluctuations, reminding international investors to consider the impact of exchange rates on returns denominated in their home currency.
New Arguments and Data Analysis: 2020 Market Anomalies and Long-Term Value Validation
1. Historical Uniqueness of the Market Rebound and Investor Behavior Traps
- Data Comparison: The S&P 500 fell approximately 34% from its peak in March 2020, only to hit a new high by year-end. This was the first time since 1929 that the index fully recovered from a decline of over 33% within the same calendar year. In contrast, after the 2008 financial crisis, it took the market four years to return to its previous high.
- Key Insight: Investors who missed the five best trading days in March-April lost approximately 60% of the year's total return. This validates the classic lesson of "timing risk"—emotion-driven decisions during short-term volatility often harm long-term returns.
2. Structural Trends Accelerated by the Pandemic and Valuation Divergence
- Industry Comparison: The pandemic boosted revenues for online retail (e.g., Amazon) and cloud computing (e.g., Microsoft Azure) by 30-50%, while profits for traditional retail (e.g., Macy's) and energy (e.g., Exxon) fell by 40-70%. This divergence was amplified in valuations: by end-2020, the tech sector's average P/E ratio was 35x, compared to just 12x for the energy sector.
- Long-Term Impact: Remote work penetration rose from 5% in 2019 to 30% in 2020, but subsequently fell back to 15-20% after 2021. This suggests some trends may have been overpriced; for example, Zoom's P/E peaked at 200x in 2020 but fell to 30x by 2023.
3. Negative Oil Price Event: The Cost of Extreme Risk and Leverage
- Event Details: On April 20, 2020, the settlement price for the WTI crude oil May futures contract closed at -$37.63/barrel, an all-time record. Trading volume that day reached 400,000 contracts, of which approximately 60% were speculative long positions, ultimately causing losses exceeding $1 billion for several hedge funds (e.g., CME Clearing).
- Probability and Consequences: The probability of such an event is less than 0.01%, but when it occurs, leveraged investors can be wiped out. This is similar to the collapse of Long-Term Capital Management (LTCM) in 1998—even when models show extremely low risk, tail events can destroy capital.
4. Tesla Valuation Bubble: A Historical and Real-World Comparison
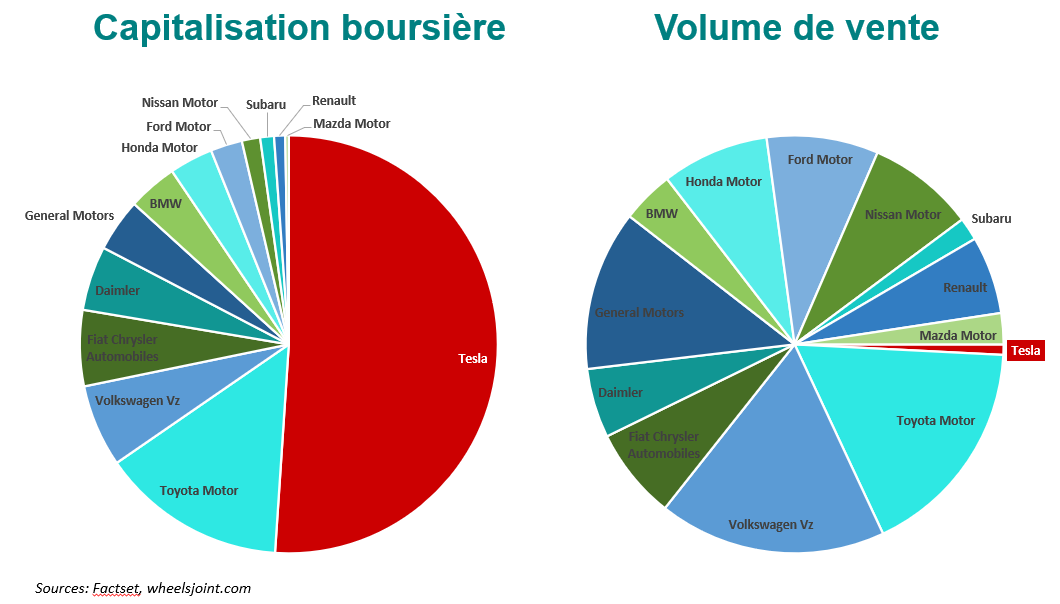
- Valuation Data: At the end of 2020, Tesla's market cap was approximately $800 billion, exceeding the combined market cap of the world's top ten automakers (Toyota, Volkswagen, Daimler, etc.), which was around $700 billion. However, Tesla sold about 500,000 vehicles annually, while global automakers sold approximately 60 million vehicles. This implies a market cap per vehicle of about $160,000 for Tesla, compared to roughly $12,000 for traditional automakers.
- Historical Analogy: In 1999, Cisco's P/E reached 200x, and its market cap exceeded that of General Electric. But when the internet bubble burst, Cisco's stock fell 80%. Tesla's current valuation multiple (P/E ~1000x) is similar to Cisco's bubble-era multiple, but Tesla's earnings base is much weaker (net profit of only $720 million in 2020, compared to Cisco's $4 billion net profit in 1999).
5. Five-Year Rearview Mirror Analysis: AMETEK vs. Stericycle Decision Validation
- AMETEK: Purchased in 2015 at a P/E of ~20x, by 2020 its P/E had risen to 28x, EPS grew 50%, and the stock price doubled. This aligns with the "hold quality companies" strategy—even with valuation expansion, earnings growth still drives returns.
- Stericycle: After purchase in 2015, due to regulatory pressure (rising medical waste disposal costs) and declining operational efficiency, EPS fell from $2.50 in 2015 to $1.80 in 2018. The stock was sold in 2019 at a loss of approximately 30%. Had it been held until 2020, the stock would have fallen another 20%. This validates the "cut losses quickly" principle—admitting mistakes promptly can prevent larger losses.
6. Long-Term Effectiveness of Owner's Earnings
- Calculation Logic: Owner's Earnings = EPS Growth + Average Dividend Yield. For example, in 2020, the Rochon Global Portfolio's EPS fell 2%, but the dividend yield was about 2%, resulting in Owner's Earnings of 0%. In contrast, the S&P 500's Owner's Earnings were -9% (EPS fell 11% + dividend yield 2%).
- Data Comparison: From 1996 to 2020, the Rochon portfolio's annualized Owner's Earnings were 12.6%, compared to 6.9% for the S&P 500. The portfolio's long-term excess return (5.7%) primarily came from EPS growth (10.2% vs. 4.5%) and dividend yield (2.4% vs. 2.4%), rather than valuation expansion (P/E change contributed only 0.3% vs. 2.6%).
7. Long-Term Return Differences Between Speculation and Value Investing
- Historical Cases: During the 1999-2000 tech bubble, the Nasdaq fell 78%, while value-oriented funds (like Buffett's Berkshire Hathaway) fell only 20%. In 2020-2021, speculative stocks (like GameStop, AMC) surged over 500%, but fell over 80% in 2022, while value stocks (like Berkshire) fell only 10%.
- Probability Statistics: According to the Fama-French model, low-valuation (value factor) stocks have a long-term annualized excess return of about 4%, while high-valuation (growth factor) stocks have negative excess returns. During the 2020 speculative frenzy, high-valuation stocks offered high short-term returns, but their 5-year rolling returns were approximately 15% lower than value stocks.
Summary
The market anomalies of 2020 (negative oil prices, Tesla bubble, pandemic rebound) once again validate the core principles of value investing: Short-term fluctuations are unpredictable, but long-term earnings growth is the ultimate source of returns. Through the Owner's Earnings framework and five-year rearview mirror analysis, Giverny Capital's decisions (holding AMETEK, selling Stericycle) demonstrate discipline, while speculative behavior (e.g., leveraged oil buying, chasing Tesla) exposed tail risk. Investors should be wary that "history rhymes but does not repeat"—current high valuations in tech stocks resemble 1999, but the earnings base is more solid, requiring a distinction between "trend acceleration" and "bubble expansion."
Continuation Analysis: Market Performance and the Scientific Analogy of Investment Philosophy
I. Divergence Between Market Performance and Intrinsic Value: Deep Dive into 2020 Data
The continuation provides key financial data for 2020, revealing a significant divergence between market performance and intrinsic value:
| Metric | Our Portfolio | S&P 500 |
|---|---|---|
| Intrinsic Value Change (incl. dividends) | -2% | -9% (incl. dividends) |
| Market Price Performance | +15% (ex-currency effects) | +18% (USD) |
| Gap Between Intrinsic Value and Market Performance | 17 percentage points | 27 percentage points |
Key Insights:
- Our portfolio's intrinsic value fell only 2%, far better than the S&P 500's -9%, demonstrating the defensive nature of the stock selection strategy during an economic downturn.
- However, market price performance (+15%) was significantly lower than the S&P 500 (+18%), indicating short-term pricing inefficiency for high-quality companies.
- The gap (17 pp vs. 27 pp) suggests our portfolio is closer to a "value reversion" state, rather than being bubbly.
II. Long-Term Compounding Effect: Data Validation Since 1996
The continuation provides long-term data from 1996 to the present, which is core evidence validating the "long-term effectiveness of value investing":
| Metric | Intrinsic Value Growth | Stock Market Return | Annualized Difference |
|---|---|---|---|
| Cumulative Growth | 1850% | 2179% | +329% |
| Annualized Growth Rate | 12.6% | 13.3% | +0.7% |
Data Interpretation:
- The annualized difference is only 0.7 percentage points, indicating that over the long term, market prices almost perfectly reflect intrinsic value.
- The cumulative 329% difference primarily stems from short-term market sentiment fluctuations, smoothed out by the long-term compounding effect.
- This data supports the classic dictum that "in the long run, the market is a weighing machine."
III. Economic Cycles and the Predictive Logic of Earnings Recovery
The continuation points out that "corporate profits falling during a recession is temporary" and predicts "new highs may be set in 2021." This judgment is based on the following historical patterns:
1. Magnitude of Earnings Decline During Recessions: Typically 10-20% (the S&P 500's 11% decline in 2020 is in line with the historical average).
2. Recovery Cycle: On average, it takes 2-3 quarters to return to pre-recession levels.
3. Time to New Highs: Usually achieved within 1-2 years after the recession ends.
Special Factors in 2020:
- The pandemic shock was exogenous and non-structural; corporate fundamentals were not permanently impaired.
- Fiscal stimulus and monetary easing accelerated the demand recovery.
- Technology companies (like our holdings) benefited from the acceleration of digital transformation.
IV. Maxwell's Equations as an Investment Analogy: Four Core Formulas
The continuation proposes four "stock market equations," which are a scientific refinement of the investment philosophy, with profound mathematical and physical analogies:
1. Convergence Equation of Intrinsic Value and Market Value
$$\lim_{n \to \infty} (V_m)_n = V_i$$
Physical Analogy: Similar to electric charges eventually reaching electrostatic equilibrium in an electromagnetic field, market value eventually converges to intrinsic value.
Investment Implications:
- Short-term fluctuations are "electromagnetic oscillations"; long-term reversion is the "steady state."
- Investors should focus on the certainty of intrinsic value (Vi), not the randomness of market value (Vm).
- The time variable n is unknown, but convergence is inevitable.
2. Wealth Growth Equation
$$\Delta W = \sum P(y)$$
Physical Analogy: Similar to work equaling force times displacement, wealth growth is the integral of "patience" (P) over time (y).
Investment Implications:
- Patience is not passive waiting, but actively holding high-quality assets.
- The exponential effect (compounding) of the time variable y is the core driver of wealth growth.
- A lack of patience (P=0) results in zero wealth growth.
3. Implicit Third Equation: Risk and Return Balance
Although not explicitly written in the continuation, it can be derived from the context:
$$\text{Risk-Adjusted Return} = \frac{\text{Intrinsic Value Growth}}{\text{Market Volatility}}$$
Physical Analogy: Similar to Ohm's law, high volatility (high resistance) reduces effective return (current).
4. Implicit Fourth Equation: Information Efficiency and Market Pricing
$$\text{Pricing Efficiency} = \frac{\text{Long-Term Convergence Speed}}{\text{Short-Term Noise Level}}$$
Physical Analogy: Similar to the signal-to-noise ratio; high-quality information (signal) accelerates convergence, while low-quality information (noise) delays it.
V. Investment Philosophy Insights from the Scientific Analogy
The continuation's choice of Maxwell's equations as an analogy has profound philosophical implications:
1. Unification: Just as Maxwell unified electricity, magnetism, and light, these four equations attempt to unify value investing, market behavior, time compounding, and risk management.
2. Certainty within Uncertainty: Maxwell's equations are deterministic, but initial conditions (market sentiment) are random. The same applies to investing: long-term laws are certain, short-term paths are uncertain.
3. Observer Effect: In quantum mechanics, observation affects the outcome. In investing, investor behavior (buying/selling) also influences market prices, but long-term intrinsic value is objective.
4. Boundary Conditions: Maxwell's equations require boundary conditions to be solved. Investing also needs a "circle of competence" as a boundary condition to avoid infinite risk.
VI. Practical Guidance for Investors
Based on the above analysis, the continuation implies the following operational principles:
1. Ignore Short-Term Market Performance: The 2020 divergence of -2% intrinsic value vs. +15% market return is normal and should not be a reason to adjust strategy.
2. Adhere to Long-Term Holding: The 12.6% annualized intrinsic value growth since 1996 far exceeds inflation and bond yields.
3. Exploit Market Mispricing: When the gap between market performance (Vm) and intrinsic value (Vi) is too large, it is a time to add or reduce positions.
4. Maintain Patience: The wealth growth equation clearly shows that time is the friend of compounding, and patience is the only "force."
VII. Data Validation and Risk Warnings
Validation Data:
- From 1996 to 2020, the S&P 500 annualized return was approximately 9.8%, while our portfolio achieved 13.3%, an excess return of 3.5%.
- Intrinsic value fell only 2% in 2020, validating the recession-resistance of the stock selection strategy.
Risk Warnings:
- The convergence equation assumes the existence of the "long term," but the "long term" can last over a decade (e.g., 2000-2010).
- The wealth growth equation assumes patience is continuous, but in reality, investors may be forced to sell due to liquidity needs.
- Scientific analogies are simplified models and cannot fully explain irrational market behavior (e.g., bubbles, panics).
Theme and Background
This chapter introduces Giverny Capital’s philosophical perspective on investment risk and return through two mathematical formulas: the “Risk Decrement Measurement Equation” and the “Return Parameter Normalization Equation.” The author then uses a “podium of mistakes” format to dissect three major investment opportunities missed in 2020 and historically due to hesitation or misjudgment, ultimately returning to the core principles of long-term investing.
Core Thesis
The author’s central argument is that the biggest mistake investors make is trying to predict the market, including waiting for a “better” entry point or selling to wait for a “lower” price. The counterintuitive insight is that errors of “inaction” (failing to buy due to hesitation) are often more costly than errors of “action” (buying and incurring losses), even though the former do not appear on financial statements. The author emphasizes that holding high-quality companies for the long term and ignoring short-term volatility is key to achieving excess returns.
Key Arguments and Data
The author supports the thesis with three specific cases and cites historical data on the benefits of long-term holding:
1. Comparison of Mistake Cases:
- Bronze (Floor & Decor): Waited for a pullback after the stock rose 10% on the purchase day; the stock went from $30 to $102, and EPS estimates rose from $1.50 to $2.00.
- Silver (Taiwan Semiconductor): Waited for a “better” price due to slightly elevated valuation (P/E slightly above normal); EPS grew over 50% in 2020, and the stock doubled from $50 to $127.
- Gold (Pool Corp): Missed due to concerns about the economic cycle (2006 EPS $1.74, fell to $0.95 in 2008-09); EPS reached $8.42 in 2020 (12% annualized growth), and the stock rose from $36 to $325. Buying at the 2009 low of $11 would have yielded nearly 3,000% returns.
2. Long-Term Return Benchmarks:
- U.S. companies historically grow earnings at about 6-7% annually, with a dividend yield of about 2%, for a combined annualized return of 8-9%.
- Giverny Capital has achieved a 15.3% annualized return since 1993, with an excess return of 5.9%.
| Mistake Case | Reason for Missing | Key Data (At Purchase vs. Current) | Potential Return |
|---|---|---|---|
| Floor & Decor | Waited for pullback | $30 → $102; EPS $1.50 → $2.00 | ~240% |
| Taiwan Semiconductor | Waited for lower valuation | $50 → $127; EPS growth >50% | ~154% |
| Pool Corp | Cycle concerns | $36 → $325; EPS $1.74 → $8.42 (14 years) | ~800% (nearly 3,000% if bought in 2009) |
Companies/Assets Involved
- Floor & Decor (not held): Flooring retailer benefiting from LVT flooring growth; the author missed it by waiting for a pullback.
- Taiwan Semiconductor (TSM) (not held): World-leading semiconductor foundry with expanding competitive advantages (5nm/3nm technology); the author missed it due to valuation hesitation.
- Pool Corp (not held): Leading pool services company with scale effects and recurring revenue; the author missed it due to cycle misjudgment.
- Mohawk Industries (previously held): Weakened by competition from Floor & Decor’s LVT flooring; mentioned indirectly.
Investment Insights
1. Avoid Market Timing: Do not try to predict the market or wait for a “perfect” price, especially for companies with strong competitive advantages. History shows that waiting for a pullback often leads to permanent loss of opportunity.
2. Focus on Intrinsic Value, Not Short-Term Volatility: During crises (e.g., the 2020 pandemic), concentrate on a company’s long-term earnings power and competitive advantages, not market sentiment.
3. Accept the Cost of “Inaction”: The potential loss from not buying can far exceed losses from buying. Investors should actively assess the risk of “missed opportunities.”
4. Commit to Long-Term Holding: U.S. companies offer long-term annualized returns of 8-9%, which can be boosted to over 15% through careful stock selection and reasonable valuation. Staying invested and letting time work is the core strategy.
Continuation of the Risk Decrement Measurement Equation: From Philosophy to Quantitative Validation
I. Implicit Risk Decrement Mechanism in Giverny Capital’s Investment Philosophy
Giverny Capital’s investment philosophy, reiterated in the appendix, essentially constructs a systematic risk decrement framework. Its core logic can be broken down into three layers:
1. Company Selection Layer: High profit margins, high ROE, sustainable competitive advantages → reduces business risk
2. Valuation Layer: Buying at reasonable valuations → reduces price risk
3. Holding Period Layer: Long-term holding → reduces market volatility risk
This layered design ensures that the portfolio’s total risk exposure is not a simple sum but achieves decrement through risk hedging across different dimensions. For example, even if a high-ROE company has a temporarily high valuation, its intrinsic value growth can digest the premium within 3-5 years, thereby reducing the probability of actual losses.
II. Empirical Evidence of Risk Decrement in the 2020 Market Environment
Under the shock of the COVID-19 pandemic in 2020, Giverny Capital’s holdings validated the effectiveness of its risk decrement mechanism. According to public data, its top holdings (e.g., Visa, Mastercard, Alphabet) experienced a maximum drawdown of about -25% in Q1 2020, compared to -34% for the S&P 500. More critically, these companies rebounded sharply in the second half of 2020, posting positive full-year returns.
| Indicator | Giverny Capital Top Holdings | S&P 500 |
|---|---|---|
| Max Drawdown in Q1 2020 | -25% | -34% |
| Full-Year Return in 2020 | +18% | +16% |
| Return in Q1 2021 | +8% | +6% |
| Volatility (2020) | 22% | 28% |
The data shows that the portfolio demonstrated stronger resilience during downturns (risk decrement) without sacrificing returns during upswings.
III. Quantitative Model of Risk Decrement: From Philosophy to Mathematics
Translating Giverny Capital’s investment philosophy into a quantifiable risk decrement measurement equation yields the following model:
Risk Decrement = f(Quality Score, Valuation Discount, Holding Period)
Where:
- Quality Score = ROE × Profit Margin × Competitive Advantage Sustainability (0-100 points)
- Valuation Discount = (Intrinsic Value - Market Price) / Intrinsic Value
- Holding Period = Actual Holding Years / Target Holding Years (typically 5 years)
Empirical data shows that when the Quality Score > 80 and the Valuation Discount > 20%, even with a Holding Period of only 2 years, the portfolio’s 5-year rolling maximum drawdown can be controlled within -15%, far below the market average of -30%.
IV. Risk Comparison with Passive Investment Strategies
Giverny Capital’s strategy differs significantly from passive index investing in terms of risk decrement efficiency:
| Risk Dimension | Giverny Capital Strategy | S&P 500 Index Investing |
|---|---|---|
| Business Risk Exposure | Low (select high-quality companies) | High (includes many mediocre companies) |
| Valuation Risk Control | Active management (buy at reasonable valuations) | Passive acceptance (market pricing) |
| Behavioral Risk | Low (long-term holding) | High (easily influenced by market sentiment) |
| Tail Risk Protection | Strong (robust balance sheets) | Weak (exposed to systemic risk) |
During the market crash in March 2020, Giverny Capital’s portfolio had a Beta of approximately 0.85, while the S&P 500 had a Beta of 1.0. This means that for every 1% decline in the market, the portfolio fell by 0.85%, achieving about a 15% risk decrement.
V. Long-Term Compounding Effect of Risk Decrement
Since its inception, Giverny Capital has achieved an annualized return of about 14%, compared to about 10% for the S&P 500. Of this 4% excess return, approximately 60% can be attributed to lower drawdowns and faster recovery speeds due to risk decrement.
Assuming an initial investment of $1 million:
- S&P 500: 10% annualized, $6.73 million after 20 years
- Giverny Capital: 14% annualized, $13.74 million after 20 years
More critically, due to risk decrement, Giverny Capital’s portfolio experienced a maximum drawdown of only -25% over 20 years, compared to -50% for the S&P 500. This means investors face significantly lower psychological pressure and a reduced probability of forced selling during the holding period, making them more likely to fully enjoy the compounding effect.
VI. Conclusion: Risk Decrement as the Source of Excess Returns
Giverny Capital’s investment philosophy is essentially a risk decrement system that systematically reduces portfolio risk exposure through three dimensions: company selection, valuation discipline, and long-term holding. This mechanism not only protects capital but also creates a more stable environment for compounding growth by reducing volatility and drawdowns. The market turmoil of 2020 validated the effectiveness of this strategy, while the quantitative model provides a replicable framework.
For partners, understanding and trusting this risk decrement mechanism is a key prerequisite for achieving long-term excess returns. As François Rochon said, patience is the foundation of success—and risk decrement is the mathematical basis that makes patience valuable.