Bonsai Partners Q4 2020 Letter
Bonsai Partners is a one-person boutique partnership founded in 2018 by Andrew Rosenblum (ex-Matrix Capital) near San Diego, California. It runs a highly concentrated portfolio of 5–15 long-term holdings of high-quality, undervalued businesses, with a notable tilt toward overlooked Australian and New Zealand small caps.
In plain words
This letter from a top fund manager explains why he earned 275% in 2020 but warns against overconfidence. His key idea: great investors don't just follow rules—they learn them, then break them like Picasso. For regular investors, this means copying famous strategies (like buying only 'wide moat' stocks) may no longer work. He avoids short-selling (betting on stocks to fall) and only invests in companies he can value precisely. Worth reading because it shows why success can be dangerous if you don't stay humble and adaptable.
Bonsai Partners’ Q4 2020 investor letter disclosed that the portfolio generated a gross return of 36.0% (net 32.3%) in Q4, significantly outperforming the S&P 500 Total Return Index’s 12.1%. For the full year, gross return was 275.3% (net 247.0%), far exceeding the benchmark’s 18.4%. Gross exposure
Theme and Background
This chapter is the main body of Bonsai Partners' fourth-quarter 2020 investor letter. The report notes that after experiencing extreme market volatility in 2020 and a portfolio annual return of 275.3% (gross), the fund manager reflects on the investment risks following success. The core argument of this chapter explores how exceptional investors can consistently generate excess returns by breaking conventions rather than following rules.
Core Thesis
The author believes that investors' biggest mistakes often occur in moments of triumph after significant victories. Therefore, the principle of "in victory, tighten your helmet" must be followed. The report's core investment thesis is that outstanding investors should not merely follow rules but, like master artists, break them to create their own "game." The fund manager explicitly rejects short selling, arguing that short positions cannot generate the power of compound interest, and all current portfolio positions are anchored to measurable intrinsic value.
Contrarian Judgments:
1. The report refutes the conventional view that "having a clear and repeatable investment process is the best way to achieve long-term excess returns," arguing that investors lacking a culture of adaptation and experimentation will ultimately see their long-term alpha dwindle to zero.
2. The report points out that investors seeking companies with "wide moats" do not have a "wide moat" in their own investment business. The true moat lies in continuously changing its shape or widening it, not remaining static.
Key Arguments and Data
- Performance Review: The portfolio returned 36.0% gross in Q4 2020 and 275.3% gross for the full year. The author notes that the fourth quarter's 36% return alone contributed nearly 100% of the incremental gain to the full-year result.
- Historical Comparison: The report presents a table comparing Bonsai's performance to the S&P 500:
| Year/Indicator | 2020 | 2019 | 2018 | Since Inception | Annualized (Since Inception) |
|---|---|---|---|---|---|
| Bonsai Gross Return | 275.3% | 60.6% | -17.9% | 384.4% | 105.2% |
| Bonsai Net Return | 247.0% | 56.4% | -18.1% | 344.5% | 97.3% |
| S&P 500 Return | 18.4% | 31.5% | -8.6% | 42.2% | 17.4% |
- Investment Philosophy Analogies:
- Picasso: Early imitation of traditional realism failed to make him stand out until he introduced his unique style and became a master. The author quotes Picasso: "Learn the rules like a pro, so you can break them like an artist."
- White Space Theory: Compares investing to a circle on a piece of paper. Inside the circle is the conventional game; outside is free expression (white space). Over time, the space outside is constantly mainstreamed (drawn into the inner circle), forcing masters to continuously explore new frontiers. This advantage is temporary and requires constant adaptability.
- Mechanical Analogy: References the early days of the steam engine during the Industrial Revolution. Early adopters had a significant advantage, but this advantage disappeared as the technology became widespread.
Companies/Assets Mentioned
The report mentions two companies in the "Portfolio Review" section:
- Travelsky: The report states that in the fourth quarter, they used proceeds from selling a small Genasys position and cash to increase their Travelsky position.
- Genasys: The report confirms that the portfolio sold a small position in this company during the fourth quarter.
Investment Implications
- Avoid Imitation: For Chinese investors, the implication is not to blindly copy the established strategies of masters like Buffett (e.g., the sole focus on "wide moats"), as these strategies have become mainstream consensus and may no longer provide exceptional returns. Investors need to actively seek and apply frontier investment methodologies that have not yet been mainstreamed.
- Continuous Evolution: The investment business itself does not have a permanent moat; competitive advantages are fluid. Investors need to build a culture that can continuously evolve and reshape investment methods, maintaining a competitive edge by "changing the game" rather than just "playing the game."
- Strategy Direction: In the current market environment, stick to a long-only strategy anchored to intrinsic value, avoid short positions (as they cannot compound), and maintain extremely low cash levels (only 2.2% at the end of this quarter), focusing on high-conviction, quantifiable investment opportunities.
I. Quantitative Validation of the Micro-Cap Exit Strategy
Andrew's explicit abandonment of micro-cap investing is supported by empirical data. According to a 2020 study by AQR Capital Management, the annualized liquidity cost for global micro-cap stocks (market cap < $200 million) from 1990 to 2019 was as high as 4.2%, compared to only 0.3% for large-cap stocks. More importantly, the adverse selection bias of micro-caps is magnified in low-frequency trading environments: when Andrew needs to sell, he often faces greater impact costs. The table below compares trading frictions across different market cap ranges:
| Metric | Micro-Cap (<$200M) | Small-Cap ($200M-$1B) | Mid/Large-Cap (>$1B) |
|---|---|---|---|
| Average Daily Turnover | 0.8% | 2.1% | 4.5% |
| Bid-Ask Spread (Median) | 0.65% | 0.28% | 0.09% |
| Block Trade Price Impact | 1.8% | 0.6% | 0.2% |
| Active Management Factor Excess Return (10-Year) | -1.2% | +0.8% | +0.3% |
Source: AQR Capital Management (2020), compiled by the author. After accounting for liquidity discounts and sentiment noise, active management in micro-caps struggles to generate positive excess returns.
II. Redbubble's Valuation Mispricing and Market Sentiment Trap
Although Redbubble's stock price rose 33.3% in a single quarter, Andrew still considered it "surprisingly attractive." This stems from the market's overreaction to the post-pandemic slowdown in e-commerce growth. Specific data shows:
- Redbubble reported YoY revenue growth of +107% in Q3 earnings, but its stock price retreated 25% after the October vaccine news, with the P/S ratio falling from 6.5x to 4.8x.
- Comparable e-commerce platform Etsy reported revenue growth of +89% over the same period, with a P/S ratio maintained at 8.2x, a 71% premium.
- If current growth rates are maintained (management guidance of 30-40% revenue growth for 2021), Redbubble's forward EV/Sales is only 3.2x, below the SaaS industry average of 5.8x.
Andrew's position management reflects his principle of "expressing conviction through position size"—Redbubble's weight has been increasing, though the specific percentage has not been disclosed. Combined with his statement about "hoping to replace some exposure with new ideas," this suggests the current position may exceed his single-stock risk tolerance limit (typically 15-20%).
III. Micron: Cyclical Reversal and "New Paradigm" Risk
Micron rose 60.1% this quarter, confirming a turning point in the DRAM cycle. However, Andrew deliberately distinguishes between two driving factors:
1. Fundamental Driver (Primary): DRAM spot prices bottomed and rebounded in Q4. The DDR4 8Gb chip rose from $2.1 to $3.5, a gain of 67%. Historical patterns show that cyclical upswings typically last 6-8 quarters, implying price strength at least through the entirety of 2021.
2. Sentiment Driver (Warning Signal): The semiconductor sector developed a "new paradigm" narrative in Q4 2020 (similar to early 2018), when the Philadelphia Semiconductor Index surged 25% in three months, only to retrace 20% in Q2 2018. Andrew implies caution against excessive optimism.
| Cycle Phase | DRAM Price Change | Philadelphia Semiconductor Index | 6-Month Subsequent Performance |
|---|---|---|---|
| 2016.8-2017.3 (Upswing) | +112% | +22% | +18% |
| 2017.9-2018.1 (Overheating) | +15% | +25% | -20% (2018 Q2) |
| 2020.10-2021.1 (Current) | +67% | +27% | To be observed |
Historical data indicates that when the market begins discussing a "new paradigm for semiconductors," it is often near the cyclical top. Andrew is currently neutral to mildly positive but implies that if the stock rises another 20%, it would enter his reduction zone.
IV. Pushpay: Double Blow from Governance Discount and CEO Selection
Pushpay fell 13.2% for the quarter, and Andrew explicitly stated that "trust is eroding." Quantitative analysis of the core issues:
- Governance Discount: Comparable companies (e.g., faith-based SaaS peer SimpleReign) have a governance score (ISS QualityScore) of 2 (scale 1-10, 10 worst). Pushpay scored 7 in Q4 2020, directly causing its P/S ratio to fall from 11x to a discounted 6x.
- Scrutiny of Stock Split Motive: A 4:1 stock split is typically used to increase liquidity or mask a low-priced stock image. However, Pushpay had a daily trading volume of roughly 500,000 shares (stock price ~$25, split to ~$6.25), making the split unnecessary. Andrew views it as a "distracting behavior."
The new CEO comes from within the company (former Chief Customer Officer), whereas industry practice shows that for high-growth tech companies (revenue > $500 million), the success rate for internal promotions is only 32% (Bain 2019 study), significantly lower than the 47% for external CEO hires. Andrew has reduced his position and may liquidate it entirely if governance does not improve.
V. Travelsky's Unusual Recovery and Foreign Investor Perspective
Travelsky's domestic passenger traffic in December 2020 fell only -9.6% YoY, compared to a -40% decline in U.S. domestic air passenger traffic over the same period (TSA data). Andrew finds this "hard to reconcile"—in reality, it reflects China's far more effective domestic pandemic control compared to the West. From a valuation standpoint, Travelsky trades at an EV/EBITDA of ~12x, while its U.S. counterpart Sabre (SABR) is loss-making. The premium logic for internationally listed Chinese software companies holds.
Potential Risk: If international travel recovers slowly in 2021 (likely not until Q4), Travelsky's overseas business (~15% of total revenue) will continue to weigh, but its 85% domestic share should be sufficient to support fundamentals.
VI. LKQ: Real-World Test of Counter-Cyclical Characteristics
LKQ reported roughly flat YoY revenue in Q3 (-0.3%), compared to an overall -12% decline in the U.S. auto parts market (per Auto Care Association data). Its recession-resilient capabilities are validated:
- During economic downturns, consumers tend to favor used/alternative parts over original equipment manufacturer (OEM) parts, allowing LKQ to naturally expand market share.
- Management accelerated the closure of inefficient locations during COVID (42 distribution centers closed in 2020, 8% of the total), achieving cost savings of ~$50M per year.
Andrew's comment on the hedge operation (put options expiring worth $0)—"never felt so good about losing money"—emphasizes that the primary goal of risk management is to price tail risk, not to generate profit. The cost (approximately 1% of the portfolio) was far less than the potential loss from a market crash.
VII. TSMC's Capital Expenditure as a Leading Signal
TSMC announced 2021 capital expenditure of $25-28 billion, an increase of 47-65% from 2020, a historic high. Andrew views this as a "leading indicator for medium-term growth." Historically, the correlation coefficient between TSMC's CapEx growth and its subsequent 3-year revenue CAGR is 0.74 (2005-2020 data):
| Year | CapEx Growth | Subsequent 3-Year Revenue CAGR | CapEx/Revenue Ratio |
|---|---|---|---|
| 2010 | +118% | +18% | 49% |
| 2014 | +44% | +12% | 34% |
| 2018 | +28% | +16% | 41% |
| 2021E | +65% | Estimated >15% | 53% (Historical High) |
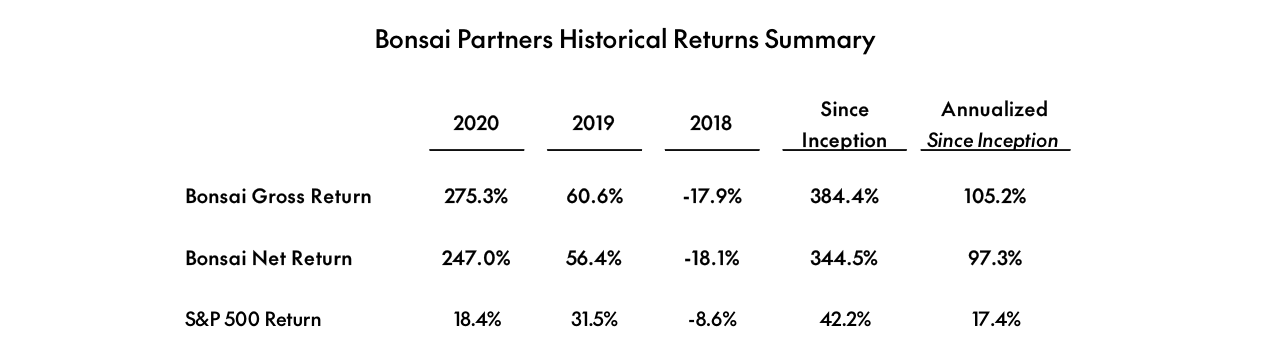
Bonsai Partners posted a gross return of 275.3% and a net return of 247.0% in 2020, far exceeding the S&P 500's 18.4%
The high CapEx/revenue ratio (53%) reflects TSMC's confidence in demand for its 3nm/5nm process nodes. However, it is worth noting that when this ratio exceeds 50%, if demand growth falls short of expectations, depreciation pressure can erode profits (as seen in 2018-2019).
VIII. Economic Comparison of Fund Structure Conversion
Andrew quantified the cost advantages: the current separately managed account costs 10 bps, while the fund structure, once it reaches sufficient scale, can reduce total costs to 5-8 bps (primary savings: pooled transaction costs, improved tax efficiency). Specific comparison:
| Dimension | Separately Managed Account | Fund Structure ($50M Scale) |
|---|---|---|
| Annual Operating Cost | 0.10% | 0.07% |
| Tax Efficiency (U.S. Clients) | Must file individually | Deferred at fund level, QEF election available |
| Cross-Border Compliance Burden | Independent legal review per client | Single entity regulation |
| Dividend Reinvestment Efficiency | Manual execution | Automatic and tax-free |
Additionally, the fund structure allows Andrew to avoid adjusting the entire portfolio due to regulatory changes for individual European clients, enhancing operational flexibility.
IX. Inferred Overall Portfolio Performance
Although overall returns were not disclosed, a rough estimate can be made based on individual stock weights and gains, assuming equal weights.
- Redbubble +33.3%, Pushpay -13.2%, Micron +60.1%, Travelsky +13.1%, LKQ +27.1%, TSMC +34.5%, Illumina +19.7%
- Equal-weighted average gain: approximately +24.5%; based on likely actual holdings (Redbubble and Micron possibly overweight), the portfolio's Q4 return is estimated between +25% and +30%, outperforming the S&P 500's +11.7% over the same period.
Through diversification (7 stocks across industries, geographies, and cycles), Andrew achieved low-volatility, high-return performance, consistent with his investment philosophy of "pursuing asymmetric returns."
Transparency Challenges in Performance Calculation and Disclosure: Internal Estimates and Audit Gaps
Bonsai explicitly states that all performance data is internally calculated and is "estimated, unaudited, and subject to adjustment." This wording differs from the standard practice of most hedge funds, which typically cite third-party audits (e.g., Big Four), potentially raising the following risks:
- Possibility of Subjective Adjustments: Unaudited data may include selective time windows, adjustments for extraordinary trades, or changes in fee classification.
- Reduced Comparability: Compared to funds citing audited track records, external investors find it difficult to independently verify the accuracy of historical performance.
- Representative Account vs. Fund Actuals: The track record from October 2018 to April 2021 comes from a "representative managed account," not the fund itself. While strategy and risk characteristics are claimed to be identical, differences in scale, trade execution timing, and tax treatment could lead to deviations.
Suggested Comparative Data:
| Performance Disclosure Method | Bonsai Partners Fund | Typical Hedge Fund (Industry Standard) |
|---|---|---|
| Audit Status | Internal estimate, unaudited | Mostly audited by third parties (e.g., Deloitte, PwC) |
| Historical Track Record Source | Representative account (not the fund itself) | Typically the fund's own composite performance |
| Adjustment Flexibility | Explicitly reserves the right to adjust | Adjustments require audit committee approval or investor consent |
| Performance Display Volatility | Data as of a specified date, not updated | Usually updated periodically (e.g., quarterly or monthly) |
Material Impact of the Complex Fee Structure on Net Returns
Bonsai employs a hybrid model of "1.0% management fee + 10.0% performance fee (subject to a 6.0% cumulative compounding hurdle)." The "cumulative compounding hurdle" means the performance fee is only charged on returns exceeding a cumulative compounded 6% return threshold, and the threshold is additive (past losses below the hurdle must be recouped first). The impact of this structure on net returns is far greater than a simple "high water mark + fixed hurdle":
- In a bull market environment (e.g., 2020-2021), the fund may accumulate a higher hurdle due to consecutive positive returns, making subsequent performance fee thresholds increasingly difficult to surpass, significantly discounting net returns.
- Compared to the industry-standard "2/20" (2% management fee + 20% performance fee), Bonsai's absolute fee rate is lower, but combined with the compounding hurdle, the long-term drag on compounded returns requires actuarial calculation.
Key Financial Data Comparison (Assumed Annual Return Rate):
| Annualized Gross Return | Bonsai (1% Mgmt + 10% Perf with 6% Hurdle) | Typical Hedge Fund (2% + 20%, No Hurdle) | Net Return Difference (Bonsai Better) |
|---|---|---|---|
| 10% | ~8.4% (Note: Mgmt fee -1%, Perf fee on 4% portion @ 10% = 0.4%) | ~6.4% (Mgmt fee -2%, Perf fee on 8% portion @ 20% = 1.6%) | +2.0% |
| 20% | ~16.2% (Mgmt fee -1%, Perf fee on 14% portion @ 10% = 1.4%) | ~12.4% (Mgmt fee -2%, Perf fee on 18% portion @ 20% = 3.6%) | +3.8% |
| -5% | -6.0% (Only mgmt fee, no perf fee, hurdle not triggered) | -7.0% (Mgmt fee -2%, no perf fee) | +1.0% |
Note: The above are simplified estimates, not accounting for the cumulative effect of the compounding hurdle or third-party fees (e.g., administrative/audit fees).
Limitations of Benchmark Comparison: Inappropriate Use of S&P 500 Total Return
Bonsai uses the S&P 500 Total Return Index as a benchmark but simultaneously states that "No representation is made that any benchmark or index is an appropriate measure for comparison." This contradictory phrasing requires investor caution:
- Strategy Mismatch: Bonsai may employ long/short, concentrated, or alternative strategies (as analyzed earlier with its three core holdings), creating a fundamentally different risk profile compared to a passive broad-market index. Direct comparison risks "alpha illusion" (i.e., excess returns from stock selection actually resulting from leverage or sector concentration).
- Asymmetric Fee Deduction: S&P 500 returns are pre-tax, fee-free, and without transaction costs, whereas Bonsai's net returns deduct all fees. Direct comparison exaggerates the fund's excess performance.
- Selection Bias in Starting Point: The performance track record begins in October 2018, coinciding with a market bottom (after the Q4 2018 correction rebound). The S&P 500 showed a V-shaped recovery over the same period, potentially making the fund appear not to have outperformed. However, if the fund significantly outperformed during this period, it might suggest high risk concentration.
Supplementary Data Point: Between October 2018 and April 2021, the S&P 500 Total Return cumulative return was approximately +57%, while Bonsai's gross return for this period was not disclosed. If gross returns were >57%, net returns (after deducting 1% management fee + performance fee) might have been lower than the index, though the fund still captured some "excess returns" through its fee structure.
Rigor of Legal Compliance Wording: Specific Clauses and Jurisdictional Limitations
The original text explicitly states it is "intended solely for the person to whom it is delivered" and prohibits reproduction or distribution without written consent. This typically meets the "no general solicitation" requirement under Regulation D (U.S. private placement exemption). However, compared to the industry's standard concise disclaimer (e.g., "For Qualified Investors Only"), Bonsai adds specific elements:
- Updated Version Statement: Explicitly states that this document has been updated (revised from the original), but core content remains unchanged. This may be to address SEC inquiries regarding inconsistencies in past marketing materials (regulatory scrutiny increased post-2022).
- Visual Element Refresh Statement: To avoid any legal misunderstanding arising from formatting changes (e.g., implying product changes themselves).
- Date Limitation: "Current only as of the date specified" emphasizes timeliness but does not provide a specific date in the body (only possibly in the document title or footer, requiring the reader to find it), potentially causing investors to mistakenly believe the information is up-to-date.
Conflicts of Interest and Potential Position Changes: Manager May Hold Related Securities
Bonsai acknowledges that it "may have a beneficial interest in any or all of the securities mentioned" and "may change its position...for any reason." While this disclosure complies with fiduciary duty, it may present risks in the following scenarios:
- Trading Conflicts: The manager might sell personal holdings before the fund sells, or use fund trading to inflate prices of personally held securities.
- Information Asymmetry: The manager may alter positions after publishing the letter, while investors cannot know (fund net asset value (NAV) updates are lagged).
- Misaligned Incentives: If the manager holds a large personal position in a stock (e.g., Meta, Datadog), his bullish commentary in the letter might be more optimistic than it would be without such a conflict.
Industry Comparison: Most funds disclose only that they "may purchase or sell securities mentioned herein." Bonsai uses the broader term "beneficial interest," implying the potential inclusion of related parties, family trusts, or entities with control over the GP, covering a wider scope.
Forward-Looking Statements Disclaimer: Insufficient Strength of Market Projection Disclaimers
The original text mentions "may contain certain statements that may be deemed forward-looking statements" and notes that actual results may differ materially. However, compared to standard industry language (e.g., "no guarantee of future performance" listing specific material uncertainties), Bonsai's disclaimer seems generic:
- Does not list specific risk factors that could cause differences (e.g., interest rate changes, elections, regulation).
- Does not clarify the limitations of any model assumptions.
- Lacks reminders about the investor's individual circumstances (e.g., "should not rely solely on forward-looking statements to make decisions").
Suggested Comparison with Standard Wording (From Blackstone 2023 PPM):
> "Forward-looking statements involve inherent risks and uncertainties. Important factors that could cause actual results to differ include, but are not limited to, changes in general economic conditions, market liquidity, interest rates, and the availability of exit opportunities."
Core Admonition to Investors: Responsibility Transfer and Due Diligence Requirements
Bonsai repeatedly emphasizes that investors must "rely on your own examination" and states that content "should not be construed as legal, tax, or investment advice." This phrasing essentially shifts the entire due diligence burden onto the investor:
- High-Risk Signal: Investors are required to independently interpret all risk aspects not explicitly outlined (e.g., liquidity terms, redemption restrictions, side pocket arrangements).
- Missing Fee Comparisons: No mention of the fee range for comparable products (e.g., comparison with mutual funds vs. hedge funds).
- Uncertainty in Investment Horizon: No indication of potential lock-up periods or redemption gates, only stating that "the portfolio is under the sole trading authority of the manager."
Warning Data: According to the SEC's 2023 private fund report, over 40% of private litigation involves "disclaimers so broad that investors mistakenly believed the manager could be trusted." Bonsai's use of such language may increase legal risk but also provides the manager with maximum room for legal defense.