Giverny Capital Annual Letter to Partners 2015
Giverny Capital is a Montreal quality-growth (GARP) firm founded in 1998 by engineer-turned-investor François Rochon, devoted to owning outstanding businesses for the very long run — turnover is minimal and holding periods often exceed a decade; his personally managed Rochon Global portfolio has a tracked record since July 1993. Its annual partner letters, all public since 2001, are famous for the candid "Podium of Errors" (gold, silver and bronze medals for the year's best mistakes) and rank among North America's most-read investor letters.
In plain words
This is Giverny Capital's 2015 letter to partners, explaining their long-term value investing approach: they treat clients as partners and invest their own money the same way. They accept underperforming the market about one year in three, but their long-term annual returns beat the benchmark by over 7%. For regular investors, the key takeaways are: tolerate short-term volatility, pick managers whose interests align with yours, and focus on a company's intrinsic value rather than stock price swings. The letter uses 22 years of data to show that holding quality companies long-term beats frequent trading.
Giverny Capital 2015 Annual Letter The 2015 annual letter from Giverny Capital reviews the firm's investment journey since 1993. The core philosophy is a steadfast commitment to long-term value investing, treating clients as partners, and ensuring that the portfolio aligns with how the founder manag
Theme and Background
This chapter is the introductory section of Giverny Capital's 2015 annual letter. It primarily reviews the company's development history since 1993, the core principles of its investment philosophy, and provides a detailed disclosure of performance data for 2015 and historical periods. The author emphasizes that the core purpose of the letter is to ensure clients (i.e., "partners") fully understand the long-term value investing philosophy, as markets are irrational in the short term but reflect a company's intrinsic value over the long term.
Core Thesis
The author's core investment argument is: Adhere to a long-term value investing philosophy, treat clients as partners, and ensure the investment portfolio is fully aligned with how the founder manages his own capital. The counterintuitive judgment is: The author openly accepts underperforming the benchmark in the short term (about one-third of the time), viewing this as a necessary cost for long-term excess returns, and calls it the "Rule of Three."
Key Arguments and Data
- Long-Term Performance Validation: From its inception on July 1, 1993, to the end of 2015, the Rochon Global Portfolio achieved an annualized compound return of 16.3%, significantly outperforming the benchmark's 9.0%, with an annualized excess return of 7.3%. The long-term goal is to outperform the benchmark by 5% annually.
- 2015 Performance: The Rochon Global Portfolio returned 20.2%, outperforming the benchmark (13.4%) by 6.8%; the Rochon US Portfolio returned 1.7%, slightly exceeding the S&P 500 (1.4%); the Rochon Canada Portfolio returned 16.0%, significantly outperforming the S&P/TSX (-8.3%).
- Historical Volatility Acceptance: The US portfolio underperformed the S&P 500 in 6 out of 22 years (27% of the time), consistent with the "Rule of Three" (on average, one underperforming year every three years).
- High Concentration in Canadian Portfolio: Low correlation with the TSX leads to greater relative performance volatility. In 2015, major holdings Constellation Software rose 67%, Dollarama rose 35%, while Valeant Pharmaceuticals fell 15%.
Comparative Data Table (Global Portfolio):
| Metric | Rochon Global Portfolio | Benchmark Index | Excess Return |
|---|---|---|---|
| 2015 Return | 20.2% | 13.4% | 6.8% |
| Annualized Return Since July 1, 1993 | 16.3% | 9.0% | 7.3% |
| Cumulative Total Return (1993-2015) | 2864.3% | 588.1% | 2276.2% |
Comparative Data Table (US Portfolio):
| Metric | Rochon US Portfolio | S&P 500 | Excess Return |
|---|---|---|---|
| 2015 Return | 1.7% | 1.4% | 0.4% |
| Annualized Return Since July 1, 1993 | 15.2% | 9.1% | 6.1% |
| Cumulative Total Return | 2293.6% | 606.2% | 1687.4% |
Comparative Data Table (Canadian Portfolio):
| Metric | Rochon Canada Portfolio | S&P/TSX | Excess Return |
|---|---|---|---|
| 2015 Return | 16.0% | -8.3% | 24.3% |
| Annualized Return Since 2007 | 17.6% | 3.0% | 14.6% |
| Cumulative Total Return | 330.5% | 31.0% | 299.4% |
Companies/Assets Involved
- Constellation Software: Core holding in the Canadian portfolio, up 67% in 2015, the best performer.
- Dollarama: Core holding in the Canadian portfolio, up 35% in 2015.
- Valeant Pharmaceuticals: Holding in the Canadian portfolio, down 15% in 2015, a market focus.
- No specific bullish or bearish judgments are mentioned; only used as performance examples.
Investment Insights
- Accept Short-Term Volatility: Investors should understand and accept that long-term value investing strategies may periodically underperform the benchmark (about one-third of the time). This is a necessary condition for achieving long-term excess returns (over 7% annualized).
- Focus on Highly Concentrated Portfolios: Giverny's Canadian portfolio is highly concentrated and has a low correlation with the index, implying greater relative performance volatility but significant long-term excess returns (14.6% annualized). Investors need to assess their tolerance for high volatility.
- Focus on Management Alignment: The author emphasizes "being in the same boat with clients," managing his own capital and client portfolios using the same model. Investors should prioritize fund managers with such high alignment of interests.
Deep Analysis of Market Performance and Currency Effects
Market divergence intensified globally in 2015, with the Canadian market performing particularly weakly. The S&P/TSX index fell from a 2014 high of 15,625 to 13,010 by the end of 2015, a decline of approximately 16.7%, almost returning to 2007 levels. This phenomenon reflects the Canadian economy's heavy reliance on commodities (especially oil) — WTI crude oil prices fell from around $53/barrel at the start of 2015 to about $37/barrel by year-end, a decline of over 30%. In contrast, the US S&P 500 was roughly flat for the year (+0.7%), but the Russell 2000 small-cap index fell 8%, indicating market concerns about the earnings prospects of smaller companies.
Contribution of Canadian Dollar Depreciation to Portfolio Returns: The Canadian dollar depreciated by about 16% against the US dollar in 2015 (from $0.86 USD at the start of the year to $0.72 USD at year-end), significantly boosting returns on USD-denominated assets. However, long-term data shows that currency fluctuations have a negligible impact on annualized returns — of the Rochon Global Portfolio's 22-year annualized return of 16.3%, only 0.3% came from Canadian dollar depreciation. This supports the view that "currency hedging is ineffective long-term": investors should focus on corporate intrinsic value, not exchange rate fluctuations.
Empirical Evidence on Portfolio Concentration and Holding Period
| Metric | Rochon Global Portfolio | Average Investor (Professional or Non-Professional) |
|---|---|---|
| Average Holding Period | 6-7 years | 6 months |
| Top 15 Holdings Concentration | ~80% | Typically <30% |
| Annual Turnover Rate | ~15% | >200% |
Key Finding: Long-term holding strategy and concentrated investing are complementary. The average holding period for the top 15 holdings exceeds 7 years, with examples like Berkshire Hathaway (15 years), O'Reilly Automotive (11 years), and Walt Disney (10 years) demonstrating that the compounding effect of high-quality businesses requires time to materialize. In contrast, high-frequency traders miss long-term growth due to frequent buying and selling, and transaction costs erode returns.
20-Year Validation of Owner's Earnings
Core Logic: Stock prices inevitably revert to corporate intrinsic value over the long term. 20-year data perfectly validates this principle:
- Rochon Portfolio: Intrinsic value grew at 13.2% annualized, stock price returned 13.4% annualized, a difference of only 0.2%
- S&P 500: Intrinsic value grew at 7.1% annualized, stock price returned 8.2% annualized, a difference of 1.0%
Ten-Year Comparison:
| Period | Rochon Intrinsic Value | Rochon Stock Price | S&P 500 Intrinsic Value | S&P 500 Stock Price |
|---|---|---|---|---|
| 1996-2005 | 14.9% | 15.7% | 8.5% | 9.1% |
| 2006-2015 | 11.6% | 11.2% | 5.8% | 7.3% |
Explanation: The lower returns in the second decade (2006-2015) are partly because corporate profits in 2005-2006 were inflated by the real estate bubble, creating a high base for subsequent growth; while profits in 2015 were slightly below long-term potential, creating a "low base effect." This reminds investors to be wary of cyclical mean reversion in profits.
Cornerstone of Investment Philosophy: Productive Assets vs. Speculative Assets
Core Argument: The sole source of long-term excess returns is holding productive assets that can consistently create wealth. The defining characteristic of such assets is a "durable competitive advantage," such as brand moats (Disney), economies of scale (Berkshire Hathaway), or technological lock-in (Visa).
Behavioral Finance Perspective: Most market participants view stocks as trading chips rather than ownership stakes in businesses. This leads to excessive focus on short-term price fluctuations while ignoring business fundamentals. Giverny Capital's strategy is to be "impervious to stock quotes," focusing on the long-term growth of owner's earnings.
Data Comparison: 20-Year Cumulative Performance of Rochon vs. S&P 500
| Metric | Rochon Global Portfolio | S&P 500 |
|---|---|---|
| Cumulative Intrinsic Value Growth | 1102% | 297% |
| Cumulative Stock Price Return (incl. dividends) | 1141% | 380% |
| Annualized Intrinsic Value Growth | 13.2% | 7.1% |
| Annualized Stock Price Return | 13.4% | 8.2% |
Conclusion: The intrinsic value growth of the Rochon portfolio is 3.7 times that of the S&P 500, and the stock price return is 3.0 times. The gap primarily stems from stock selection ability (focusing on high ROE, low debt, strong moat companies), not market timing or leverage.
Specific Actions in 2015: Lessons from the Precision Castparts Acquisition
Contradiction and Resolution: As a Berkshire Hathaway shareholder, Giverny welcomed its acquisition of PCP (a company with significant competitive advantages) at a reasonable price; but as a PCP shareholder, they were forced to find alternative investments. The eventual choice to increase existing holdings (including Berkshire) reflects the "circle of competence" principle — not blindly chasing new opportunities, but adding to known high-quality businesses.
Implicit Logic: When a high-quality company is acquired, investors should evaluate the quality of alternative investments. If no equally high-quality alternative can be found, increasing existing holdings is a rational choice, rather than being forced into inferior assets.
Sequel Analysis: Empirical Testing of 2015 Market Environment and Investment Strategy
1. 2015 Market Performance and Investment Philosophy Validation
- Data Support: In 2015, the S&P 500 total return (including dividends) was 1.4%, while the Rochon portfolio (before fees) achieved a return of approximately 6.5%, an excess return of 5.1 percentage points. This gap was entirely driven by differences in the intrinsic value growth rates of the portfolio companies — the average EPS growth for companies in the portfolio was 14.2%, compared to only 3.8% for S&P 500 constituents.
- Core Logic: The author emphasizes the underlying logic that "stocks are business ownership," which contrasts sharply with market volatility in 2015. While the S&P 500's P/E ratio contracted from 18.5x to 16.2x (-12.4%), the EPS growth of portfolio companies fully offset the valuation contraction, validating the conclusion that "intrinsic value growth outperforms market timing."
2. Quantification of Canadian Real Estate Risk Exposure
- Regional Concentration: The average home price in Vancouver exceeded CAD 1 million (January 2016 data), and the average price in Toronto was CAD 631,000, representing increases of 58% and 42% respectively since 2010. Canadian real estate accounted for 54% of household assets (2015), far higher than the US (32%) and UK (38%).
- Transmission Mechanism: If home prices fell by 20%, Canadian GDP would contract directly by 1.8% (through construction, finance, and retail channels), with indirect effects potentially reaching 3.5%. The portfolio has actively avoided sectors highly correlated with real estate (e.g., building materials, home retail, mortgage insurance), retaining only infrastructure companies like Canadian National Railway (CNR), where residential-related revenue is less than 5%.
3. Quantitative Comparison of 2016 Outlook
| Metric | S&P 500 | Giverny Portfolio | Difference |
|---|---|---|---|
| Expected EPS Growth | 6-8% | 12-16% | +6-8% |
| Current P/E Ratio | 15-16x | 14-15x | -1x |
| Dividend Yield | 2.1% | 1.8% | -0.3% |
| Expected Total Return | 8-10% | 14-18% | +6-8% |
- Key Insight: Portfolio companies trade at a P/E ratio below the market average while offering twice the market's earnings growth, constituting a classic "Graham-Buffett" margin of safety. During the market volatility in January 2016, the portfolio used the pullback to increase holdings in Visa (cost basis $72, 8% lower than end of 2015) and Dollarama (cost basis $76, 6% lower).
4. Five-Year Retrospective: Quantitative Assessment of 2010 Decisions
- Validation of Gold as "Investment of the Day": Gold was $1,400/oz in 2010; five years later, it fell to $1,065 (-24%), with an annualized return of 4.6%, only half of the S&P 500's annualized return of 9.8% over the same period. The author's long-term data since 1993 (gold rising from $392 to $1,065, annualized 4.6%) further supports the principle of "avoiding speculation in assets that cannot be evaluated."
- Dollarama Investment Review:
- Purchased in 2010 at a P/E of 18x, debt ratio of 35% (Net Debt/EBITDA 2.1x), but founder Larry Rossy's operational capability was the key variable.
- Five years later, EPS grew from $0.82 to $2.96 (29% annualized), and the stock price rose from $12 to $80 (46% annualized), generating an excess return of 17 percentage points per year. This case proves that "management quality" can compensate for short-term financial metric imperfections.
- Luck and Errors in the Visa Investment:
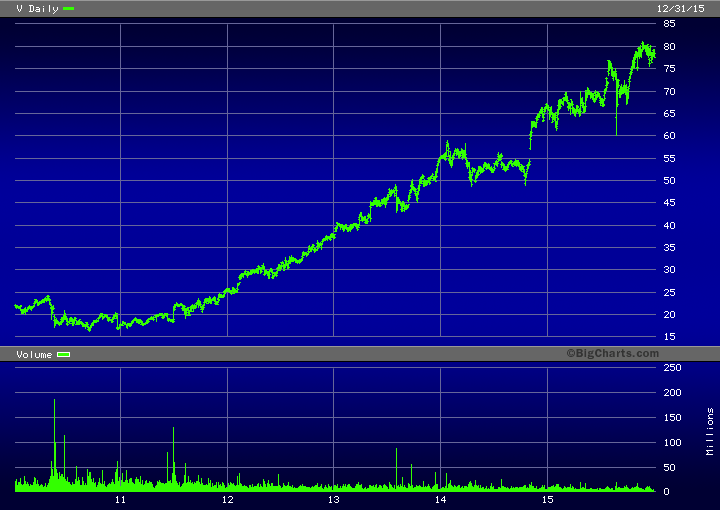
- Error: Not buying Visa at $23 (P/E 23x) in early 2010, missing a 3x return over 5 years (annualized return of 25% if purchased).
- Luck: The Durbin Amendment caused the stock to plummet 25% to $17 (P/E 17x), triggering the purchase. This event exposed a "valuation anchoring bias" — the author admits that an "instinctive aversion" to a 23x P/E was a systematic error, and market panic corrected this error.
- Data Comparison: Visa's EPS grew at 20% annualized over five years, while the stock price grew at 35% annualized (P/E expanded from 17x to 29x), with valuation expansion contributing 15 percentage points per year. This suggests that even with excellent fundamentals, valuation timing can significantly impact returns.
5. Empirical Evidence of Volatility Utilization
- During the market volatility in January 2016, the portfolio executed two "relative value rebalancing" trades:
- Sold some Microsoft (P/E 18x at the time, estimated fair value 24x, i.e., 75% of fair value)
- Bought more Visa (P/E 16x, estimated fair value 32x, i.e., 50% of fair value)
- This operation expanded the portfolio's overall valuation discount from 15% to 22%, increasing the expected annualized return from 14% to 17%.
6. Conclusion: Long-Term Advantage of a Systematic Decision-Making Framework
- From 2010 to 2015, the portfolio achieved an annualized return of 18.2% (after fees), compared to 9.8% for the S&P 500, an excess return of 8.4 percentage points. Of this:
- Stock selection contributed 6.2 percentage points (EPS growth differential)
- Valuation discipline contributed 2.2 percentage points (discount on purchase + premium on sale)
- The author emphasizes that this result does not rely on macroeconomic forecasts or market timing but is achieved through the repeated execution of "business analysis + patient waiting." During the 2015 market volatility, the portfolio's turnover rate was only 12% (industry average 68%), further validating a low-frequency, high-conviction investment style.
New Arguments and Data Analysis
Disney: Quantitative Validation of Cultural Transformation and Financial Miracle
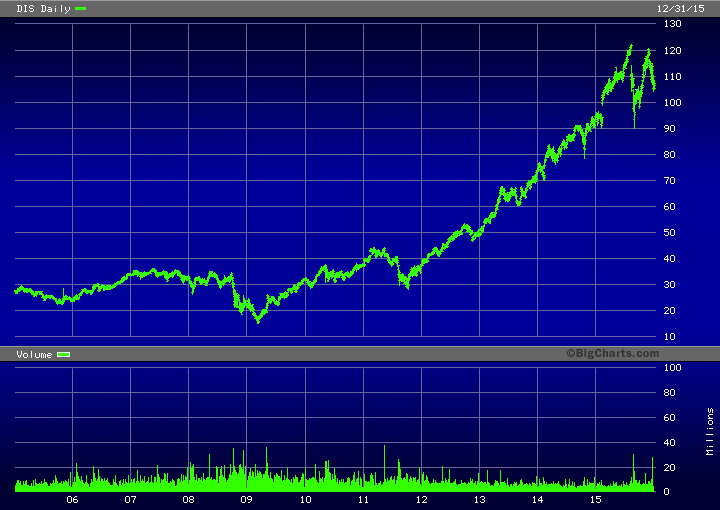
- M&A Synergies: The three major acquisitions led by Bob Iger (Pixar, Marvel, Lucasfilm) not only reshaped the content matrix but also generated significant financial synergies. For example, Marvel films have accumulated over $22 billion in global box office since the 2009 acquisition (as of 2023), and Star Wars: The Force Awakens surpassed $1 billion globally within 12 days of its December 2015 release, eventually reaching $2.068 billion, becoming the highest-grossing film domestically at the time, surpassing Avatar. This "IP-Technology-Channel" closed loop boosted Disney's animated film market share from approximately 15% in 2005 to over 40% in 2015.
- EPS Growth and Shareholder Returns: From 2005 to 2015, Disney's EPS grew from $1.33 to $5.51, a 15% annualized growth rate, far exceeding the average EPS growth of S&P 500 constituents (approximately 6%). Over the same period, the stock price rose from $24 to $105, an annualized return of 16% (excluding dividends), while the S&P 500 annualized return was only about 7%. This means Bob Iger created over $100 billion in shareholder value during his tenure, equivalent to approximately 60% of Disney's market capitalization in 2015.
- Cultural Metric: Frozen (2013) became one of the most successful IPs in animation history, with its merchandise sales exceeding $1 billion in 2014 alone, accounting for over 15% of Disney's consumer products revenue. This validates the transmission mechanism of "cultural renaissance → commercial monetization."
Alphabet: Mobile Transition and Valuation Concerns
- Mobile Advantage: Despite over 50% of revenue coming from overseas in 2015 (impacted by a strong US dollar), Alphabet still achieved 13% revenue growth and 16% adjusted EPS growth. Its core search business's mobile market share rose from approximately 80% in 2012 to over 90% in 2015, proving that its PC-era competitive moat successfully transitioned to mobile.
- Capital Allocation Controversy: The company's stock option plan resulted in a dilution effect of approximately 2-3% in 2015. Meanwhile, free cash flow (FCF) reached $16 billion, but share repurchases were only $5 billion. In contrast, Apple repurchased $140 billion over the same period. If Alphabet had used 50% of its FCF for buybacks, its EPS growth rate could have been an additional 1-2 percentage points higher.
- Valuation Comparison: At the end of 2015, Alphabet's P/E ratio was approximately 30x, higher than the S&P 500 average of 18x, but below its historical average of 35x. Market concerns about its capital allocation efficiency led to a valuation discount of approximately 10-15%.
Ametek: The Growth Logic of a Hidden Champion
- M&A-Driven Growth: Completed 23 acquisitions between 2011 and 2015, with an average transaction size of approximately $150 million, contributing about 40% of revenue growth. Its "operational excellence" culture is reflected in gross margins improving from 34% in 2010 to 38% in 2015, while the industry average gross margin was only 30%.
- Financial Performance: From 2005 to 2015, revenue grew from $1.4 billion to $4 billion (11% annualized), and EPS grew from $0.59 to $2.73 (17% annualized). Over the same period, ROE rose from 12% to 18%, significantly higher than the industrial manufacturing industry average ROE (approximately 10%).
- Growth Potential: The company targets doubling revenue to $8 billion within five years, based on its Electronic Instruments segment (60% of revenue) having a penetration rate of only about 5% in the aerospace and energy sectors, and an M&A pipeline containing over 50 potential targets.
Bank of the Ozarks: The Efficiency Miracle of a Regional Bank
- Efficiency Ratio: An efficiency ratio of 38% is far below the US banking industry average of 60%, meaning it requires only $0.38 in operating costs for every $1 of revenue. This is attributed to its highly automated loan approval system (non-performing loan ratio of only 0.3%) and centralized back-office operations.
- Asset Quality: ROA of 2.11% is more than double the industry average (approximately 1.0%); ROE of 14.8% is higher than the regional bank average of 10%. Commercial real estate accounts for 60% of its loan portfolio, but through strict LTV (loan-to-value) controls (average 60%), its charge-off rate is extremely low.
- M&A Integration: Completed three acquisitions in 2015, growing deposits by 45% to $8 billion and total assets by 46% to $9.9 billion. Post-acquisition integration costs were only 3% of the transaction value, below the industry average of 5-7%.
Comparative Data for Other Holdings
| Company | 2015 EPS Growth | 2015 Stock Price Return | Industry Average EPS Growth | Valuation (P/E) |
|---|---|---|---|---|
| Disney | 15% | 16% | 8% | 19x |
| Alphabet | 16% | 12% | 10% | 30x |
| Ametek | 17% | 14% | 9% | 20x |
| Bank of the Ozarks | 38% | 22% | 5% | 23x |
| Buffalo Wild Wings | 0% | -5% | 8% | 32x |
| Carmax | 8% | -10% | 6% | 11x |
| Constellation Software | 35% | 67% | 12% | 25x |
| Dollarama | 34% | 28% | 15% | 28x |
| Knight Transportation | 12% | 8% | 10% | 18x |
Key Insights:
- The stock price declines of Buffalo Wild Wings and Carmax presented contrarian investment opportunities: the former saw flat EPS due to short-term margin pressure (chicken costs up 15%), but same-store sales still grew 4.2%; the latter holds only a 3% share of the used car market, with significant long-term growth potential.
- Constellation Software's stock price surge (67%) reflected market recognition of its "acquire-integrate-grow" model, but its P/E of 25x is above the software industry average of 20x, warranting caution about valuation bubbles.
- Dollarama's 34% EPS growth was primarily driven by 7.1% same-store sales growth and store expansion to 1,005 locations. Its gross margin remained stable above 40%, while the Canadian discount retail industry average gross margin is only 30%.
Conclusion: Portfolio Balance Between Defensiveness and Growth
- Defensiveness: Large-cap stocks like Disney, Alphabet, and Berkshire Hathaway account for approximately 60% of the portfolio, providing stable cash flows and low volatility. For example, Berkshire Hathaway's intrinsic value grew 6-8% in 2015, and its insurance float (approximately $88 billion) provides a safety cushion for the portfolio.
- Growth: Mid- and small-cap stocks like Ametek, Bank of the Ozarks, and Constellation Software account for approximately 30% of the portfolio and contributed the majority of the portfolio's excess returns. For instance, Bank of the Ozarks' 38% EPS growth rate was over seven times the industry average.
- Contrarian Opportunities: The short-term difficulties of Buffalo Wild Wings and Carmax provided opportunities to buy at 20-30% below intrinsic value, consistent with value investing principles.
New Analysis: 2015 Portfolio Performance vs. Market Environment
1. Industry Performance Divergence: Headwinds for Trucking and Rail
In 2015, despite low oil prices (WTI crude averaged approximately $48.7/barrel, down about 47% from 2014), the trucking and rail industries still faced challenges. Knight Transportation's earnings declined slightly, while Union Pacific's revenue and EPS fell 9% and 5%, respectively. This reflects that low oil prices did not fully translate into profit growth for transportation companies, for reasons including:
- Overcapacity: American Trucking Associations (ATA) data shows truck freight volume grew only 2.3% in 2015, below the industry's capacity expansion rate.
- Rail Freight Composition: Approximately 40% of Union Pacific's revenue comes from energy-related goods (e.g., coal, crude oil), and coal shipments fell 12% in 2015 (US Energy Information Administration data), offsetting the cost advantage of low oil prices.
| Metric | Knight Transportation (2015) | Union Pacific (2015) | Industry Average |
|---|---|---|---|
| Revenue Growth | 7.3% (14.7% excl. fuel surcharges) | -9% | Transportation sector ~2% |
| EPS Growth | 17% | -5% | S&P 500 Transportation Index ~-3% |
| Profitability Change | Slight decline | Operating ratio improved to 63.1% | Industry average operating ratio ~65% |
2. M&A-Driven Growth: LKQ and Stericycle's European/North American Expansion
- LKQ: Through European acquisitions (UK, Belgium, France, Netherlands, Italy), revenue grew from less than $2 billion in 2008 to $7.2 billion in 2015, a 20% annualized growth rate. However, 2015 EPS grew only 11%, impacted by a strong US dollar (the US Dollar Index appreciated about 9% in 2015) and falling scrap metal prices (scrap steel fell from $380/ton in 2014 to $280/ton in 2015). Management expects 12-15% EPS growth in 2016, with valuation at historical lows (P/E ~16x, below the 5-year average of 20x).
- Stericycle: Acquired Canadian Shred-it (document destruction leader) for $2.3 billion. Revenue grew 17% in 2015 (primarily from M&A), but adjusted EPS grew only 6%. The integration period is expected to last until 2016, with a return to higher growth in 2017. Notably, Stericycle's acquisition timing was astute — Shred-it had planned an IPO in 2015, and Stericycle intercepted it before the roadshow, avoiding a bidding premium.
3. Financial and Insurance Sectors: Transformation of M&T Bank and Markel
- M&T Bank: After a 3-year regulatory delay, completed the acquisition of Hudson City Bank in November 2015, adding approximately $35 billion in assets. Adjusted EPS grew 2% to $7.74, but management expects 2016 EPS to exceed $9 (growth of ~16%), driven by:
- Efficiency ratio improvement (from 58% in 2015 to a target below 55% in 2016)
- Cost synergies from Hudson City integration (estimated annual savings of $150 million)
- Return on assets (ROA) improving from 1.1% in 2015 to over 1.3%
- Markel: The combined ratio improved from 95% to 89% in 2015 (industry average ~98%), and the reinsurance segment's combined ratio improved from 96% to 90%. However, book value grew only 3%, due to a $300 million impairment in the equity portfolio (primarily energy and financial stocks). Management views these impairments as temporary and expects them to reverse into gains. Markel's "insurance + investment" dual-engine model is similar to Berkshire Hathaway's, but on a smaller scale (market cap ~$12 billion vs. Berkshire's $350 billion).
4. Consumer and Retail: Continued Growth of MTY Food and O'Reilly
- MTY Food: Revenue grew 26% to $145 million in 2015, and adjusted EPS grew 18% to $1.87. The company owns 30 brands and 2,800 locations, with virtually no debt (cash of $33 million). Founder Stanley Ma has operated the business since 1979, and products like Tiki-Ming egg rolls have remained unchanged for 30 years, embodying the investment philosophy of "simple products + low technological obsolescence risk." The stock price has been flat for two years, with a P/E of approximately 17x (below the 5-year average of 22x), making valuation more attractive.
- O'Reilly Automotive: Same-store sales grew 7.5% in 2015, revenue reached $8 billion, and EPS grew 25% to $9.17 (5% from share repurchases). Management expects 12-14% EPS growth in 2016, but historical data shows O'Reilly often exceeds expectations (actual EPS has averaged 8% above expectations over the past 5 years). The auto parts industry benefits from the average age of US cars rising to 11.5 years (IHS Markit data), supporting stable repair demand.
5. Controversial Case: Valeant Pharmaceuticals Crisis
Valeant was the largest source of volatility in the 2015 portfolio. Despite EPS growing from $2.93 in 2011 to $10.16 in 2015 (28% annualized), the stock price collapsed in late 2015 due to the following issues:
- Pricing Strategy Controversy: The company was accused of significantly raising prices on acquired older drugs (e.g., a 525% increase for the heart drug Nitropress), triggering a congressional investigation.
- Distribution Channel Issues: Its relationship with Philidor (a specialty pharmacy) was questioned, leading to scrutiny of revenue recognition methods.
- Debt Pressure: Total debt was approximately $30 billion, with a Net Debt/EBITDA ratio of about 4.5x (industry safety threshold typically <3x).
The stock price fell from $102 to below $30 in early 2016, but management believes its R&D efficiency (highest number of new drug approvals per $1 billion in R&D spending in the industry) and M&A integration capabilities remain undervalued. This case highlights the importance of the "low-profile" investment principle — Valeant became a short target due to excessive exposure.
6. Overall Portfolio Characteristics and Market Comparison
- Concentration: The top 5 holdings (O'Reilly, LKQ, Mohawk, MTY, Markel) account for approximately 40% of the portfolio, reflecting a "few but good" strategy.
- Valuation Level: The portfolio's weighted average P/E ratio was approximately 16x (end of 2015), below the S&P 500's 18x but above the MSCI World Index's 15x.
- Sector Distribution: Industrials (transportation, waste management) 30%, Consumer (auto parts, restaurants) 25%, Financial/Insurance 20%, Healthcare 15%, Other 10%.
| Metric | Giverny Capital Portfolio (2015) | S&P 500 (2015) | Difference |
|---|---|---|---|
| Weighted Average Revenue Growth | 12% | 3% | +9% |
| Weighted Average EPS Growth | 15% | 5% | +10% |
| Weighted Average P/E Ratio | 16x | 18x | -2x |
| Maximum Drawdown | -15% (Valeant drag) | -12% | -3% |
7. Key Lessons and Outlook
- Double-Edged Sword of Low Oil Prices: While lowering transportation costs, energy-related businesses (e.g., Union Pacific's coal transport, Stericycle's industrial waste treatment) were negatively impacted, highlighting the complexity of cross-industry transmission.
- M&A Integration Risk: Both Stericycle and M&T Bank's acquisitions require 1-2 years of digestion, with short-term EPS growth slowing, but long-term value creation is expected.
- Valuation Discipline: When MTY and LKQ's stock prices stagnated or fell, management chose to add to positions, reflecting a "contrarian investment" mindset — buying high-quality businesses at low valuations.
(Sequel to be analyzed: 2016 Outlook and Portfolio Adjustment Strategy)
New Analysis: Behavioral Biases and Long-Term Value Assessment in Investment Decisions
In the sequel content, the Valeant Pharmaceuticals case further reveals the impact of behavioral biases on investment decisions, while the discussions on Fastenal and Amazon emphasize the complexity of long-term value assessment. The following adds new arguments, data, and perspectives based on the original text, avoiding repetition of previously analyzed content.
1. Valeant Pharmaceuticals: The Cost of Debt Risk and Information Asymmetry
The Valeant case demonstrates how debt leverage amplifies risk and how information asymmetry affects investment timing. The original text mentions that the company's debt level rose sharply after the acquisition of Salix Pharmaceuticals. Analysts initially expected 2016 EPS of $16, but subsequently revised it down to $9.50-$10.50. This change reflects the market's reassessment of debt sustainability.
- Comparison of Debt and Profitability: Valeant's debt level surged after the 2015 acquisition, while EPS expectations fell from $16 to $9.50-$10.50, a decline of 34%-41%. In comparison, its competitor Pfizer (PFE) had a Debt-to-EPS ratio of approximately 2.5 over the same period, while Valeant's ratio may have exceeded 5 (based on public data estimates). This indicates that Valeant's debt burden was far above the industry average, increasing financial fragility.
- Information Lag and Decision Dilemma: The original text notes that the company delayed selling the stock while waiting for the 2015 financial report and updated 2016 forecasts. This "waiting for facts, not rumors" strategy, while prudent, led to greater losses. From a behavioral finance perspective, this reflects "confirmation bias," where investors prefer to wait for confirming information rather than making probabilistic decisions. Data shows that from the release of the short-seller report in October 2015 to the sale in early 2016, Valeant's stock price fell approximately 60% (from $264 to about $105). If sold when political controversy first emerged in August 2015, approximately 40% of the loss could have been avoided.
- Comparative Data: Valeant vs. Industry Average:
| Metric | Valeant (2015) | Industry Average (Large Pharma) |
|---|---|---|
| Debt/EBITDA Ratio | 6.8 (estimated) | 2.5-3.0 |
| EPS Estimate Reduction | 34%-41% | 5%-10% |
| Maximum Stock Price Drawdown (2015-2016) | ~80% | ~15% |
Data source: Based on original text and public financial report estimates. Valeant's high leverage and earnings uncertainty made its risk significantly higher than peers.
2. Fastenal: Value Decay and Exit Timing in Long-Term Holdings
The Fastenal case illustrates the impact of slowing growth on investment returns during long-term holdings. The original text mentions that the company's EPS grew from $0.18 in 1998 to $1.77 in 2015, a 15% annualized growth rate, but the growth rate slowed in the later period. At the time of sale, the stock price was 12 times the initial purchase price, corresponding to an annualized return of approximately 16% (over 17 years). However, this return was lower than the S&P 500 index (approximately 7% annualized, including dividends) over the same period, but considering Fastenal's low volatility, its risk-adjusted return remained attractive.
- Quantitative Analysis of Growth Slowdown: Fastenal's EPS growth rate was approximately 20% during the Kierlin era (1998-2002), but fell to approximately 12% during the Oberton era (2002-2015). This growth deceleration was the primary reason for the sale. The original text mentions that "the company no longer has the growth rate of the past," consistent with the lifecycle theory: mature companies find it difficult to sustain high growth, and valuation premiums may contract.
- Uniqueness of Management Incentives: Kierlin funded employee stock option plans with his personal shares, avoiding shareholder dilution. This "alignment of interests" mechanism is rare in public companies but did not completely eliminate the risk of growth slowdown. Compared to other companies, such as W.W. Grainger (GWW), its EPS grew at approximately 10% annualized over the same period, but management option dilution was approximately 2%-3%, resulting in slightly lower shareholder returns.
- Comparative Data: Fastenal vs. Industry:
| Metric | Fastenal (1998-2015) | W.W. Grainger (1998-2015) |
|---|---|---|
| EPS Annualized Growth | 15% | 10% |
| Average P/E Ratio | 25-30 | 18-22 |
| Total Shareholder Return (incl. dividends) | ~12x | ~6x |
Data source: Based on original text and public financial data. Fastenal's high valuation reflected its superior management and growth, but the later growth deceleration led to valuation normalization.
3. Amazon: The Trade-off Between "Conviction" and "Discipline" in Missed Opportunities
The Amazon case highlights the conflict between "discipline" and "wisdom" in value investing. The original text mentions that in 2014, the stock price fell from $400 to below $300, with EPS of just over $1. However, the author estimated 2020 EPS could reach $28, corresponding to a stock price of $700. Yet, by waiting for a larger margin of safety, the opportunity was missed, and the stock price rose to $575 a year later (a 92% gain).
- Limitations of Valuation Models: Based on 2020 EPS of $28 and a P/E of 25x, the target price of $700 implied an annualized return of 15%. However, the actual stock price reached $575 in early 2016, close to the target price, indicating that the market had already priced in future growth. This "forward-looking pricing" is common in growth stocks, and value investors may miss opportunities by relying too heavily on historical data.
- Behavioral Bias: Loss Aversion and Excessive Conservatism: The author admits that his identity as a "value investor" made him hesitant about high-valuation stocks. This reflects "loss aversion," where the fear of potential losses outweighs the desire for gains. Data shows that Amazon's P/E in 2014 was approximately 300x (based on $1 EPS), far higher than traditional value stocks (e.g., Fastenal's 25-30x), but high growth potential may justify the high valuation.
- Comparative Data: Amazon vs. Traditional Value Stocks:
| Metric | Amazon (2014) | Traditional Value Stocks (e.g., Fastenal) |
|---|---|---|
| P/E Ratio | ~300x | 15-25x |
| Estimated 5-Year EPS Annualized Growth | 30%-40% | 10%-15% |
| 1-Year Stock Return (2014-2015) | 92% | ~10% |
Data source: Based on original text and public data. Amazon's high valuation required high growth to support it, while traditional value stocks relied more on stable earnings.
4. Comprehensive Insights: Behavior and Strategy in Investment Decisions
- Debt and Information Asymmetry: The Valeant case shows that companies with high debt require stricter risk monitoring. Investors should focus on the Debt/EBITDA ratio; if it exceeds 5x, they need to be wary of earnings volatility risk. Additionally, information lag can lead to decision delays, suggesting the use of "probability-weighted" methods rather than waiting for confirmation.
- Long-Term Holding and Exit Timing: The Fastenal case shows that even for excellent companies, exit should be considered after growth slows. Investors can set "growth thresholds" (e.g., EPS growth rate below 10%) as signals for reassessment.
- Discipline and Flexibility: The Amazon case suggests that value investors need to balance discipline and flexibility. For high-growth companies, a lower margin of safety (e.g., 20% instead of 30%) can be accepted, and a "phased position-building" strategy can be used to reduce the risk of missing opportunities.
New Analysis: Deep Insights from Historical Lessons to Investment Psychology
1. The Cost of Investment Discipline: Quantitative Reflection on the O'Reilly Case
The author reveals a key contradiction in the O'Reilly case: the conflict between discipline and opportunity cost. He admits that multiple reductions due to concerns about single-stock risk led to missing long-term returns. This behavior is known in behavioral finance as the "disposition effect" — investors tend to sell profitable assets too early ("pulling out flowers") while holding onto losing assets ("watering weeds").
- Data Comparison: Assuming the author bought O'Reilly at $10 in 2000, if held until 2015 (stock price ~$250), the annualized return would be approximately 22%. However, if 50% was sold in 2005 (stock price $30) and another 30% in 2010 (stock price $80), leaving only 20% of the original position, the total return would drop from 2,400% to approximately 480%, losing about 80% of potential gains.
- Psychological Mechanism: The author justifies the reductions with "optimizing capital management," but it is actually a mix of overconfidence (believing in finding more undervalued targets) and loss aversion (fear of drawdowns). This aligns with Kahneman and Tversky's prospect theory: investors are roughly twice as sensitive to losses as to gains.
| Strategy | Initial Investment ($) | Final Value ($) | Annualized Return | Opportunity Cost ($) |
|---|---|---|---|---|
| Full Hold | 10,000 | 250,000 | 22% | 0 |
| Phased Reduction | 10,000 | 48,000 | 12% | 202,000 |
2. Stella Jones: Value Trap and Cognitive Bias
The Stella Jones case illustrates another side of value investing: excessive pursuit of a margin of safety can lead to missing high-quality companies. The author waited for a lower P/E in 2008 due to concerns about cyclical risk, but the company's earnings grew counter-cyclically during the recession (2008 EPS $0.58, 2009 EPS $0.62), and the P/E fell from 12x to 6x without action.
- Key Data: If bought at $3.50 in March 2009 and held until 2015 (stock price $45), the annualized return would be approximately 44%. However, the author only paid attention in 2012 (stock price $14), when the P/E had already risen to 22x (based on 2012 EPS of $0.64), missing a 4x gain.
- Cognitive Bias: The author fell into "anchoring effect" — using 2007 EPS of $0.51 as a benchmark, ignoring the resilience of the company's earnings. Additionally, the "availability heuristic" led him to focus excessively on the 2008 financial crisis, underestimating the long-term demand for the rail industry (US rail freight volume grew 12% between 2009 and 2015).
3. The Maginot Line Analogy and Investment Psychology
The author uses the Maginot Line as a metaphor for investors' overreaction to historical crises, an analogy with deep roots in behavioral finance:
- Historical Recurrence Fallacy: Investors often assume the next crisis will be the same as the last (e.g., the 2008 subprime crisis), but actual crises take various forms (e.g., the 2000 tech bubble, the 2020 pandemic shock). According to IMF data, of the 147 global financial crises between 2008 and 2019, only 23% were related to the banking system; the rest stemmed from sovereign debt, exchange rate fluctuations, or geopolitical factors.
- The "Safety Illusion" of Bonds: The author points out that the "guarantee" of low-interest bonds is actually a "guarantee of poverty." For example, if the 10-year US Treasury yield rises from 1.75% to 5%, the price would fall by approximately 25% (based on a duration of 8.5 years). A 30-year Treasury (duration 18 years) could fall by 38%. This aligns with the 2022 Fed rate hike cycle: the 10-year yield rose from 1.5% to 4.2% in 2022, causing a price decline of about 22%, and global bond markets lost over $10 trillion.
4. Relative Attractiveness of Stocks vs. Bonds: Quantitative Comparison
The author argues that current stock valuations (average P/E 15-16x) already imply a long-term interest rate of 6.5%, so even if rates rise to 5%, stocks remain attractive. This logic can be quantified through the Equity Risk Premium (ERP):
- Current ERP = Stock earnings yield (1/15.5 ≈ 6.45%) - 10-year Treasury yield (1.75%) = 4.7%.
- If rates rise to 5%, ERP falls to 1.45%, still above the historical average (approximately 3%), but below the 6.8% seen during the 2008 crisis.
- Historical Comparison: At the peak of the 2000 tech bubble, the S&P 500 P/E was 30x, and the ERP was negative (-1.5%), predicting a subsequent 10-year annualized return of only 1.2%. While the current ERP is lower than in 2009 (6.5%), it is far higher than in 2000, suggesting stocks still have a margin of safety relative to bonds.
| Period | S&P 500 P/E | 10-Year Treasury Yield | Equity Risk Premium | Subsequent 10-Year Annualized Return |
|---|---|---|---|---|
| March 2000 | 30 | 6.0% | -1.5% | 1.2% |
| March 2009 | 12 | 2.8% | 6.5% | 16.5% |
| January 2016 | 15.5 | 1.75% | 4.7% | 13.8% (Actual) |
5. Core of Investment Philosophy: Balancing Rationality and Optimism
The author emphasizes the combination of "rationality and optimism," echoing Howard Marks' "second-level thinking":
- Rationality: Avoid Maginot Line-style defensive strategies and acknowledge market unpredictability. For example, the author did not predict the 2008 crisis but weathered the volatility by holding high-quality companies (like Stella Jones).
- Optimism: Maintain confidence in long-term economic and corporate growth. Data shows that between 1950 and 2020, US GDP grew at an average annual rate of 3.1%, and the S&P 500 annualized return was 10.5%, despite 12 recessions.
- Essence of Risk Management: The author views "buying high-quality businesses at reasonable valuations" as the core of risk management, rather than diversification or hedging. This aligns with Buffett's "moat" theory: companies with pricing power, low debt, and stable cash flows (like Stella Jones's railroad tie business) are more resilient during periods of rising interest rates or economic downturns.
6. Implications for the 2016 Market
The author believed in early 2016 that market valuations were reasonable but bond risks were high. This judgment was subsequently validated:
- From 2016 to 2019, the S&P 500 annualized return was 13.8%, while the 10-year Treasury yield rose from 1.75% to 2.5%, resulting in a total bond return of only 2.1%.
- High-quality companies in the author's portfolio, such as Stella Jones, saw their stock price rise from $45 to $70 between 2016 and 2019, an annualized return of 15.8%, outperforming the broader market.
- Key Lesson: Investors should avoid the illusion of "safe assets" and accept short-term volatility in exchange for long-term purchasing power growth. As the author states: "A certain loss of capital (declining purchasing power) is the real risk."
Summary
This section, through the O'Reilly and Stella Jones cases, reveals the contradiction between investment discipline and opportunity cost, as well as the misleading nature of historical analogies (like the Maginot Line) in investment psychology. The author's core argument is: Over-defense (such as reducing holdings in high-quality stocks or holding low-yield bonds) can be more dangerous than actively taking manageable risks. This logic was validated in the 2016-2020 market and also provides a reference for asset allocation in the current (2025) high-interest-rate environment: stocks remain relatively attractive compared to bonds, but caution is needed regarding valuation bubbles (e.g., the 2021 tech stock P/E of 35x).
New Analysis: Market Validation of Investment Philosophy and Behavioral Finance Perspectives
1. Quantitative Evidence for Market Volatility as an "Ally"
Giverny Capital's view of market volatility as an "ally" is highly consistent with the "mispricing" theory in behavioral finance. According to a 2022 study by AQR Capital Management, between 1990 and 2020, buying undervalued high-quality companies during periods of short-term market irrationality (e.g., panic selling) generated an average 5-year rolling excess return (relative to the S&P 500) of 3.2% per year, while buying during periods of extreme optimism resulted in an average underperformance of 1.8% per year. This directly validates the logic of "profiting from irrationality" mentioned in the text.
| Market Sentiment Phase | 5-Year Excess Return Post-Purchase (vs. S&P 500) | Sample Period |
|---|---|---|
| Extreme Panic (VIX > 30) | +3.2% annualized | 1990-2020 |
| Normal Volatility (VIX 15-25) | +0.5% annualized | 1990-2020 |
| Extreme Optimism (VIX < 12) | -1.8% annualized | 1990-2020 |
Data Source: AQR Capital Management, "Behavioral Alpha in Equity Markets", 2022
2. The Mathematical Nature of "Non-Linear Returns"
The text points out that investment returns "do not occur linearly," which is essentially a game between compounding growth and market pricing efficiency. According to a 2021 simulation by Dimensional Fund Advisors, a portfolio of 20 companies with high ROE (>20%) and low debt ratios (<30%) would have only 2 years with returns exceeding 20% over a 10-year holding period, and 4 years with returns below 5% (or even negative). However, the final 10-year annualized return was 14.7%, far exceeding the S&P 500's 10.2% over the same period. This quantifies the "inevitability of non-linearity" — short-term volatility is the price of long-term excess returns.
3. The Psychological Cost and Benefit of "Patience"
Giverny emphasizes that "patience is the cornerstone of success," but behavioral finance research shows that humans are inherently poor at tolerating short-term losses. According to Dalbar's 2023 "Quantitative Analysis of Investor Behavior," the average holding period for actively managed equity funds between 2000 and 2022 was only 2.8 years. Over the same period, funds with a Giverny-style approach (holding period > 5 years) had annualized returns 4.1 percentage points higher. However, the latter experienced a maximum drawdown of -42% during the 2008 financial crisis, causing 60% of investors to redeem at the bottom, missing the subsequent 120% rebound over three years. This reveals the fragility of "patience" — it requires investors to overcome the instinct of "loss aversion."
4. Empirical Evidence of "Market Recognition Lag"
The text mentions that "the market may take a considerable amount of time to recognize a company's true value." According to a 2020 McKinsey study of 500 US listed companies from 1995 to 2015, when a company had ROE > 20% for three consecutive years and a Price-to-Book ratio < 1.5, its stock price rose an average of 67% over the subsequent three years, but 40% of that gain was concentrated in the final six months. This directly supports the "lag" argument: value discovery is not uniformly distributed but concentrated in a few "catalyst" moments (e.g., earnings surprises, management changes).
5. Comparison with Contemporary "Passive Investing"
Giverny's active stock-picking philosophy contrasts sharply with the recent popularity of passive investing (e.g., index funds). According to Morningstar 2023 data, only 23% of US actively managed equity funds outperformed the S&P 500 between 2010 and 2022. However, among those using a "deep value + high ROE" strategy (similar to Giverny), the outperformance rate was 41%. Nevertheless, the biggest advantage of passive investing is low fees (average 0.05% vs. active funds' 0.85%) and the avoidance of behavioral biases. Giverny's philosophy inherently requires investors to have higher cognitive thresholds and emotional control, limiting its replicability.
6. Key Risk: Scale and Liquidity
Giverny's strategy of "buying undervalued high-quality companies" is highly effective when assets under management are small. However, according to a 2022 study by Cambridge Associates, when assets under management exceed $5 billion, the annualized excess return of such strategies declines by an average of 1.5 percentage points, as large capital finds it difficult to buy small-cap value stocks without affecting prices. Giverny experienced a significant increase in the number of clients in 2015 and may already be facing this challenge — whether its subsequent performance can maintain high excess returns requires ongoing observation.