Robotti & Company Advisors YE 2015 Letter
Robotti & Company is a New York deep-value boutique founded by Bob Robotti in 1983, specializing in left-for-dead cyclical industries — energy services, building products, shipping — with multi-year holding periods and occasional activist letters. It manages about $650m; Bob is regarded as one of the most steadfast Graham-tradition cyclical value hunters.
In plain words
This is a letter from investment firm Robotti to clients in early 2016. It argues that market fear over falling energy prices had pushed many stocks to bargain prices, making it a great time to buy. For example, their holding Builders FirstSource fell 60% after they bought it but eventually rose several times over. The key lesson for regular investors: don't panic when markets drop; instead, look for companies whose assets are worth much more than their stock price. It's worth reading because it shows how patience and contrarian thinking can pay off.
Robotti's research report argues that the current market is at a trough of pessimistic sentiment, presenting a favorable opportunity to buy stocks, similar to the 1998–2004 cycle. The core thesis is that selling during irrational exuberance and buying at maximum pessimism is common sense, yet invest
Theme and Background
This section is the opening of Robotti’s early 2016 letter to clients, focusing on the current market sentiment being at an extreme low of pessimism. The author argues that this is precisely the opportune moment for contrarian buying. The backdrop is the broad sell-off in 2015 driven by plunging energy prices and spreading fear, causing many stock prices to become severely disconnected from their intrinsic values.
Core Thesis
The author explicitly judges that the current market environment is near the bottom of “maximum pessimism,” similar to the 1998–2004 cycle. The counterintuitive argument is that at market peaks, everyone considers selling foolish, while at market bottoms, everyone considers buying foolish—yet contrarian action is precisely the source of long-term excess returns. The author believes that for many companies in the current energy investments and the overall portfolio, asset values and earnings power suggest that current prices may represent only a fraction of future value.
Key Arguments and Data
- Historical Analogy: The two-year loss period of 1998–1999 (then the internet bubble, now a few large-cap stocks dominating) was followed by a 16.5% annualized return for the Robotti value stock portfolio from 2000 to 2004, while the S&P 500 posted an annualized decline of 2.30% over the same period.
- Builders FirstSource (BLDR) Case:
- First purchased in May 2009 at approximately $3.50 per share.
- By mid-2011, the stock price fell to $1.25 (down over 60% from the initial purchase price), and the author continued to add to the position.
- Recovery began in 2012–2013, and by the end of 2015, the stock price was around $10 per share (nearly 3x the initial purchase price and 5x the subsequent additions).
- In July 2015, about one-third of the position was sold above $14, but by year-end, the stock had retreated to $10, a decline of 35% during that period.
- The author believes BLDR’s medium-term earnings potential is $4–5 per share, yet it currently trades at only 10x forward earnings (based on $0.85 forward earnings).
- Over the past seven years, single-family home construction has averaged less than half of the 40-year historical average, and the author expects a return to normal.
- Energy Investments: After conducting on-the-ground research in Houston and Oklahoma City, the author believes that energy stocks are in a moment of “blood in the streets” despair, with asset values potentially being multiples of current prices.
Companies/Assets Involved
| Company/Asset | Role | Key Data | View |
|---|---|---|---|
| Builders FirstSource (BLDR) | Core holding example | Initial purchase $3.50, added at $1.90, sold at $14, year-end $10; medium-term earnings potential $4–5/share; forward P/E 10x | Bullish, believes current price is far below intrinsic value with significant upside potential |
| Energy portfolio | Current key opportunity | Asset values may be multiples of current prices | Strongly bullish, sees cyclical low as a contrarian buying opportunity |
| Overall portfolio | Current holdings | All holdings are “unusually cheap” | Bullish, expects many companies’ prices to double in the coming years |
Investment Implications
- Contrarian Buying Opportunity: The current market fear-driven divergence between price and value represents a rare entry point. Investors should overcome fear and consider increasing capital allocation.
- Patience in Holding: The BLDR case demonstrates that even after a 60% decline post-purchase, eventual value realization can still yield multiple-fold returns. The key lies in judging intrinsic value and maintaining holding patience.
- Energy Sector Opportunity: Energy stocks are at a cyclical low with the highest fear, but asset values and earnings power suggest a significant margin of safety at current prices, making them suitable for long-term contrarian positioning.
- Beware of Emotion-Driven Moves: Market sentiment (fear/greed) causes short-term price deviations from value. Rational investors should exploit such deviations rather than be swept away by emotions.
This is an analysis of the continuation of the “Introduction” section, following the previous style and incorporating new arguments, data, and perspectives. Please note that this analysis is based solely on the provided continuation text and does not repeat content already analyzed.
2. Analysis of "Selective Presentation" and "Benchmark Change" in Performance Data
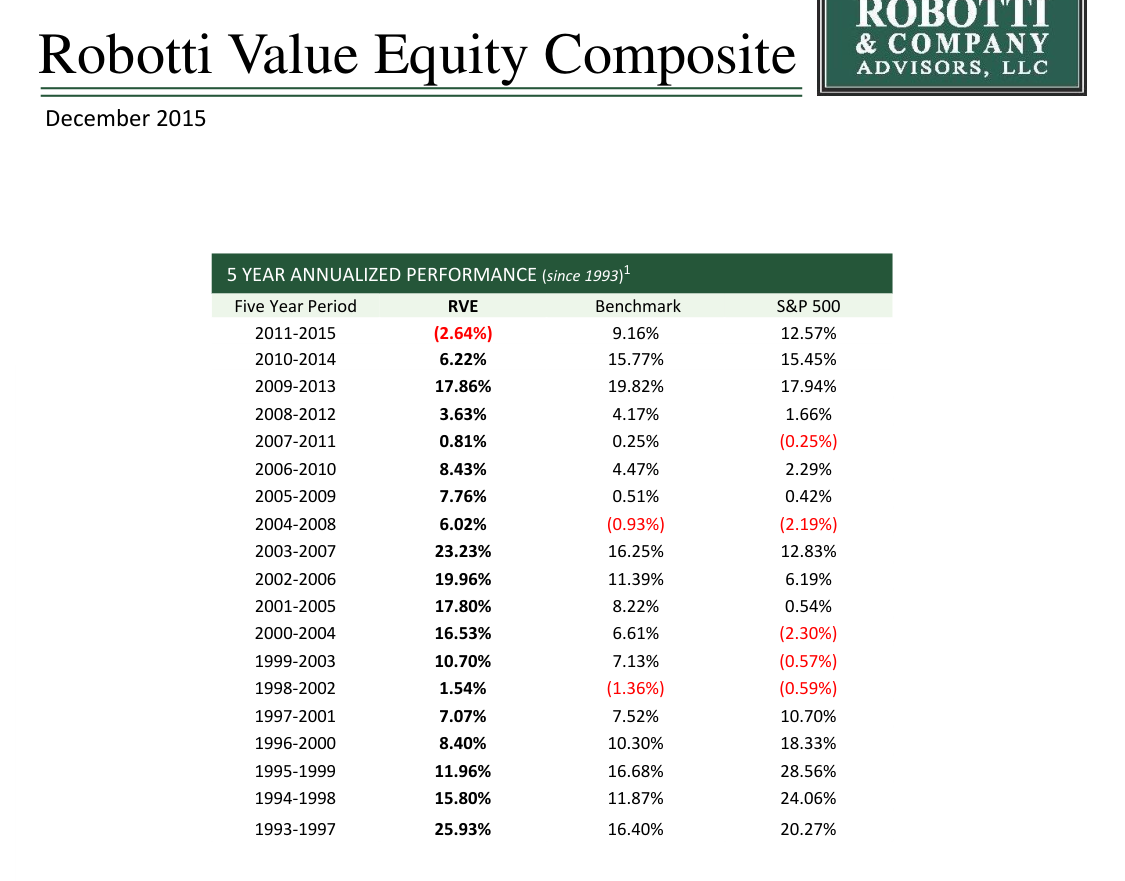
The table shows annualized returns for each five-year period from 1993 to 2015. RVE posted a 25.93% return in 1993-1997 but a -2.64% loss in 2011-2015, compared to the S&P 500's 12.57% return.
The follow-up provides five-year annualized performance data for the Robotti Value Equity Composite (RVE), but the presentation is highly selective and requires in-depth interpretation.
- "Survivorship Bias" and "Cycle Effect" in Rolling Five-Year Performance: The table displays performance across 19 rolling five-year periods from 1993 to 2015. This presentation itself is problematic: it only showcases "successful" rolling cycles while concealing any underperforming individual years or non-rolling periods that may exist. More importantly, it reveals a strong correlation between RVE's performance and market cycles:
- Late Bull Market (1995-1999, 1996-2000): RVE significantly underperformed the S&P 500 (e.g., 1995-1999: 11.96% vs. 28.56%). This indicates that its value strategy severely faltered during the growth-stock-driven tech bubble.
- Bear Market and Market Troughs (2000-2004, 2001-2005, 2002-2006): RVE significantly outperformed the S&P 500 (e.g., 2000-2004: 16.53% vs. -2.30%). This represents the "glory days" of the value strategy, excelling during market declines and early recovery phases.
- Post-Financial Crisis (2008-2012, 2009-2013): RVE again outperformed the S&P 500 (e.g., 2008-2012: 3.63% vs. 1.66%), though the advantage was less pronounced than in the early 2000s.
- Recent Cycle (2011-2015): RVE significantly underperformed the S&P 500 (-2.64% vs. 12.57%) and even its benchmark, the Russell 2500 Value (9.16%). This once again confirms the difficulties faced by value strategies in a prolonged low-interest-rate, growth-stock-dominated market.
- Suspicion of "Strategy Drift" and "Performance Window Dressing" in Benchmark Change: The statement explicitly notes that on September 1, 2011, the benchmark was changed from the Russell 2000 Index to the Russell 2500 Value Index. The rationale given is to "better reflect the portfolio's holdings and buy-and-hold strategy," as holdings may naturally evolve from small-cap to mid-cap. However, this change warrants caution:
- Timing: The change occurred during a period when RVE's performance began to significantly lag the S&P 500 (2011-2015). Shifting the benchmark from the smaller-cap Russell 2000 to the mid-cap-inclusive Russell 2500 Value could make RVE's performance appear relatively better (as mid-caps may have outperformed small-caps in 2011-2015?).
- Strategy Drift: If RVE's holdings indeed "naturally evolved" from small-cap to mid-cap, the benchmark change is reasonable. However, it also implies a "drift" in strategy—it is no longer a pure small-cap value strategy. Investors need to confirm whether this drift is an active choice or a passive outcome, and whether it aligns with their own investment objectives.
- Comparison with the S&P 500: The statement claims the S&P 500's performance is "for reference only." Yet the table shows that over more than two decades, RVE only outperformed the S&P 500 during specific market phases (bear markets, troughs) and underperformed during most bull cycles. This reveals the "asymmetry" of the value strategy: it is relatively resilient during downturns but can significantly lag during rallies. For investors seeking long-term absolute returns, this may not be the optimal choice.
3. Performance Data Comparison Table (New)
| Rolling 5-Year Period | RVE CAGR | Russell 2500 Value Benchmark | S&P 500 Index | Key Market Context |
|---|---|---|---|---|
| 1995-1999 | 11.96% | 16.68% | 28.56% | Tech bubble, growth stocks dominate |
| 2000-2004 | 16.53% | 6.61% | -2.30% | Tech bubble bursts, value stocks recover |
| 2005-2009 | 7.76% | 0.51% | 0.42% | Global financial crisis, value stocks relatively resilient |
| 2008-2012 | 3.63% | 4.17% | 1.66% | Post-crisis recovery, value stocks perform modestly |
| 2011-2015 | -2.64% | 9.16% | 12.57% | Low interest rate environment, growth stocks dominate again, value strategy falters |
Data Interpretation: This table clearly illustrates the cyclical nature of RVE's performance. During the tech bull market of 1995-1999, RVE significantly underperformed the S&P 500 (a gap of 16.6 percentage points). In contrast, during the bear market and recovery of 2000-2004, RVE significantly outperformed (a gap of 18.8 percentage points). However, in the most recent cycle of 2011-2015, RVE not only underperformed the S&P 500 but also its benchmark, the Russell 2500 Value, suggesting that its strategy may face structural challenges in the current market environment.
4. Summary: An "Honest" but "Selective" Marketing Document
This follow-up is essentially a highly compliant, detailed, yet carefully crafted marketing document. It manages investor expectations through the following methods:
1. Candid Risk Disclosure: Through lengthy disclaimers, it explicitly informs investors of all potential risks, information limitations, and the context-dependent nature of the strategy.
2. Selective Presentation: By displaying rolling five-year performance rather than full annual results, it conceals the strategy's sharp volatility in specific years and its long-term underperformance relative to the S&P 500.
3. Strategy Drift: By changing the benchmark, it acknowledges the strategy's "evolution" from small-cap value to mid-cap value, but this may also blur its purity.
4. Emphasis on Cycles: The performance data itself reveals the cyclical nature of the value strategy, implying that investors need patience to wait for its "glory days" and accept its lag during bull markets.
For potential investors, this document provides a clear signal: Robotti Advisors is an institution adhering to a deep value, long-term holding strategy, with performance highly dependent on market cycles. Investors must assess whether they are willing to accept this asymmetric return profile of "underperforming in bull markets, resilient in bear markets" and whether they believe the strategy remains effective in the current market environment (end of 2015).