Comment Second Semester 2024
Cobas Asset Management is a Madrid deep-value firm founded in late 2016 by Francisco García Paramés, Europe's standard-bearer of value investing after 25+ years running Bestinver and author of "Investing for the Long Term". Cobas applies a strict Graham/Buffett value framework overlaid with Austrian business-cycle theory, concentrating in unloved energy, shipping and other cyclicals, with AUM above €3.4bn. Its investor letters are fully archived from Q1 2017, moving to a semi-annual cadence in 2022.
In plain words
This report reviews Cobas fund's 2024 performance. Some stocks like Golar (up 88%) and Teva (up 110%) surged but the manager thinks they still have room to grow because they're cheap. They also sold overpriced stocks and bought new undervalued ones, like a metal recycler Derichebourg. For regular investors: don't automatically sell a stock just because it went up—check if it's still cheap. Also, learn to rotate from winners to new bargains. Worth reading to see how pros find value.
Cobas's 2024 investment report shows that the international portfolio rose by 23.4%, significantly outperforming the benchmark BBG Europe Developed Markets' 9% gain; the Iberian portfolio rose by 12.1%, slightly underperforming the benchmark's 16.4%. Core holding Golar saw its share price surge 88%,
Theme and Background
This chapter opens Cobas's 2024 H2 investment report, reviewing the annual performance of the International Portfolio (+23.4%) and the Iberian Portfolio (+12.1%), with a focus on the drivers of key holdings. In terms of market environment, the International Portfolio significantly outperformed its benchmark (BBG Europe Developed Markets, up 9%), while the Iberian Portfolio slightly lagged its benchmark (+16.4%).
Core Thesis
The author's core investment thesis is that, despite the fund having achieved significant gains, the overall revaluation potential of the portfolio remains "clearly above 100%," primarily driven by continuous portfolio rotation—selling companies whose prices have risen significantly and buying new targets that remain undervalued. A contrarian judgment is that for holdings with substantial gains like Golar, Teva, and Currys, the author believes their potential is not yet exhausted and maintains a significant weight.
Key Arguments and Data
- Golar: The stock price rose 88%, driven by: 1) A new 20-year contract for the Hilli floating liquefaction facility (strategically significant as it will move to Argentina's Vaca Muerta field after 2026); 2) Completion of the Gimi project, which has arrived off the coast of Mauritania/Senegal, ready to start LNG production under a 20-year contract. Management's "shift to growth" strategy has gained market recognition, and the author believes it "still has attractive potential."
- Teva: The stock price rose 110%, but valuation remains low—trading at only 8x estimated 2025 cash flow, with several new products set to launch in the coming years.
- Currys: The stock price rose nearly 90%, driven by the UK and Nordic businesses achieving positive comparable sales simultaneously for the first time in four years, with Black Friday/Christmas performance confirming a positive outlook. Despite the large gain, the author believes "potential remains high" and maintains a weight of over 4%.
- TI Fluid Systems: Received a takeover offer from a fund managed by Apollo, with a final offer of £2 per share in cash, representing a 45% premium over the average purchase price. The author considers this "reasonable." The stock rose 29% for the year (53% after the announcement).
- Técnicas Reunidas: Consolidated its recovery in 2024, with a record-high new project pipeline, operating margins stabilizing around 4%, and the balance sheet restored to pre-pandemic healthy levels.
- Arteche: The stock price rose nearly 90%, driven by future growth targets announced at the March Investor Day and a new medium-term strategic plan in May (showing revenue and margin growth trajectories). Valuation remains low—trading at only 5x estimated 2025 cash flow.
- Derichebourg: A new addition to the International Portfolio, with a weight of approximately 2.5%. The company specializes in metal recycling (steel, copper, aluminum) and holds leading positions in France, Spain, and Central Europe. Its business benefits from economies of scale barriers, has an attractive ROCE, and its municipal services business partially hedges against recycling cyclicality. The author believes it trades "well below our estimated value."
Companies/Assets Involved
| Company | Role | Key Data | Bullish/Bearish |
|---|---|---|---|
| Golar | Largest holding in International Portfolio (over 3 years) | Stock +88%, new 20-year Argentina contract, Gimi project completed | Bullish, still has potential |
| Teva | Major holding in International Portfolio | Stock +110%, 8x estimated 2025 cash flow | Bullish, promising new products |
| Currys | Holding in International Portfolio (>4% weight) | Stock +86%, UK and Nordic businesses first simultaneous positive growth | Bullish, potential remains high |
| TI Fluid Systems | Holding in International Portfolio (2% weight) | Received takeover offer, final offer £2/share, 45% premium | Neutral (offer reasonable) |
| Técnicas Reunidas | Holding in Iberian Portfolio | Stock +35%, record-high new project pipeline, 4% margin | Bullish, recovery confirmed |
| Arteche | Major holding in Iberian Portfolio | Stock +88%, 5x estimated 2025 cash flow | Bullish, high revaluation potential |
| Derichebourg | New addition to International Portfolio (2.5% weight) | Trades well below estimated value | Bullish, new purchase |
Investment Implications
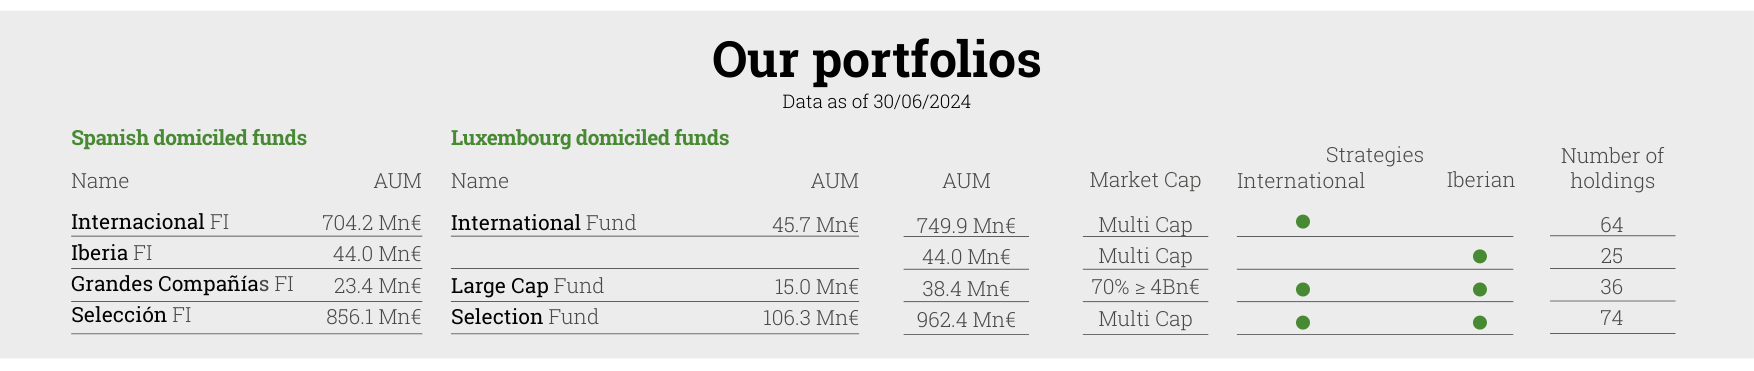
Shows the AUM of each fund under Cobas AM as of June 30, 2024, with total AUM reaching 2,309Mn€, of which Selección Fund is 962.4Mn€ and International Fund is 749.9Mn€
- Continue Holding High-Gain Stocks: Although Golar, Teva, and Currys have risen significantly, the author believes their valuations still do not fully reflect future growth, and investors should not take profits prematurely.
- Focus on Portfolio Rotation Opportunities: Cobas maintains overall revaluation potential by selling stocks that have risen significantly (e.g., Golar, Teva, Currys) and buying new targets (e.g., Derichebourg). Investors can learn from this disciplined "buy low, sell high" rotation strategy.
- Value Low-Valuation New Targets: Both Derichebourg (metal recycling) and Arteche (grid equipment) trade at very low cash flow multiples (5-8x) and possess industry barriers or structural growth drivers (grid modernization, renewable energy), making them potential value traps.
- Beware of Takeover Offer Risks: The TI Fluid Systems case shows that even after receiving a premium offer, if the initial bid is rejected, the final price could be higher. Investors need to assess the gap between a company's intrinsic value and the offer price.
New Arguments and Data Analysis
1. Valuation Discount and Quality Premium of the International Portfolio
The International Portfolio achieved a +23.4% return in 2024, significantly outperforming the benchmark (BBG Europe Developed Markets) at +9.0%. Despite strong performance, the portfolio's valuation remains significantly below the benchmark: the estimated 2025 P/E is 6.6x, compared to 13.6x for the benchmark, a discount of 51.5%. Meanwhile, the portfolio's ROCE (Return on Capital Employed) is close to 34%, over 2.5 times that of the benchmark. This combination of "low valuation + high return" indicates that the companies in the portfolio possess a significant quality premium, but the market has not yet fully priced it in.
| Metric | International Portfolio | Benchmark (BBG Europe Developed Markets) | Discount/Premium |
|---|---|---|---|
| Estimated 2025 P/E | 6.6x | 13.6x | -51.5% |
| ROCE | ~34% | ~13.6% (estimated) | +150% |
| Position Level | 97% | - | - |
2. Quantitative Effect of the Portfolio Rotation Strategy
The International Portfolio underwent significant rotation in 2024: reducing positions in Golar, Teva, and CIR (stocks that rose 25%-110%), while increasing positions in Bayer, CKH Holdings, and Kosmos (the latter had a weight of only about 1% at the end of 2023). Additionally, 6 securities were completely liquidated (total weight 6%), and 14 new stocks were added (total weight nearly 14%). This rotation increased the portfolio's estimated value from approximately €263/share at the start of the year (estimated) to €308/share, an increase of 17%. Notably, among the new stocks, Derichebourg and Borr Drilling had the largest weights, indicating a shift from "profit-taking" to "value rediscovery."
3. Industry Concentration Risk of the Iberian Portfolio
The Iberian Portfolio returned +12.1% in 2024, lagging its benchmark (+16.4%) by approximately 4.3 percentage points. The main drag came from Grifols and Gestamp, which likely had higher weights in the portfolio (though not explicitly disclosed). In contrast, the largest contributors, such as Arteche and Técnicas Reunidas, are mostly in the industrial and infrastructure sectors. This industry concentration (industrial + real estate) makes the portfolio susceptible to cyclical fluctuations. For example, Grifols' stock fell about 30% in 2024 due to debt issues, while Gestamp fell about 15% due to weak European automotive demand.
4. Global Benchmark Comparison of the Large Cap Portfolio
The Large Cap Portfolio returned +20.1% in 2024, lagging its benchmark (BBG Developed Markets) at +26.7% by about 6.6 percentage points. However, the portfolio's valuation discount is even more extreme: the estimated 2025 P/E is 6.2x, compared to 19.4x for the benchmark, a discount of 68%. The portfolio's ROCE is 30%, approximately twice that of the benchmark. This "deep value" strategy underperformed in the 2024 bull market dominated by global tech stocks, but the portfolio's potential upside (144%) is higher than that of the International Portfolio (135%) and the Iberian Portfolio (127%).
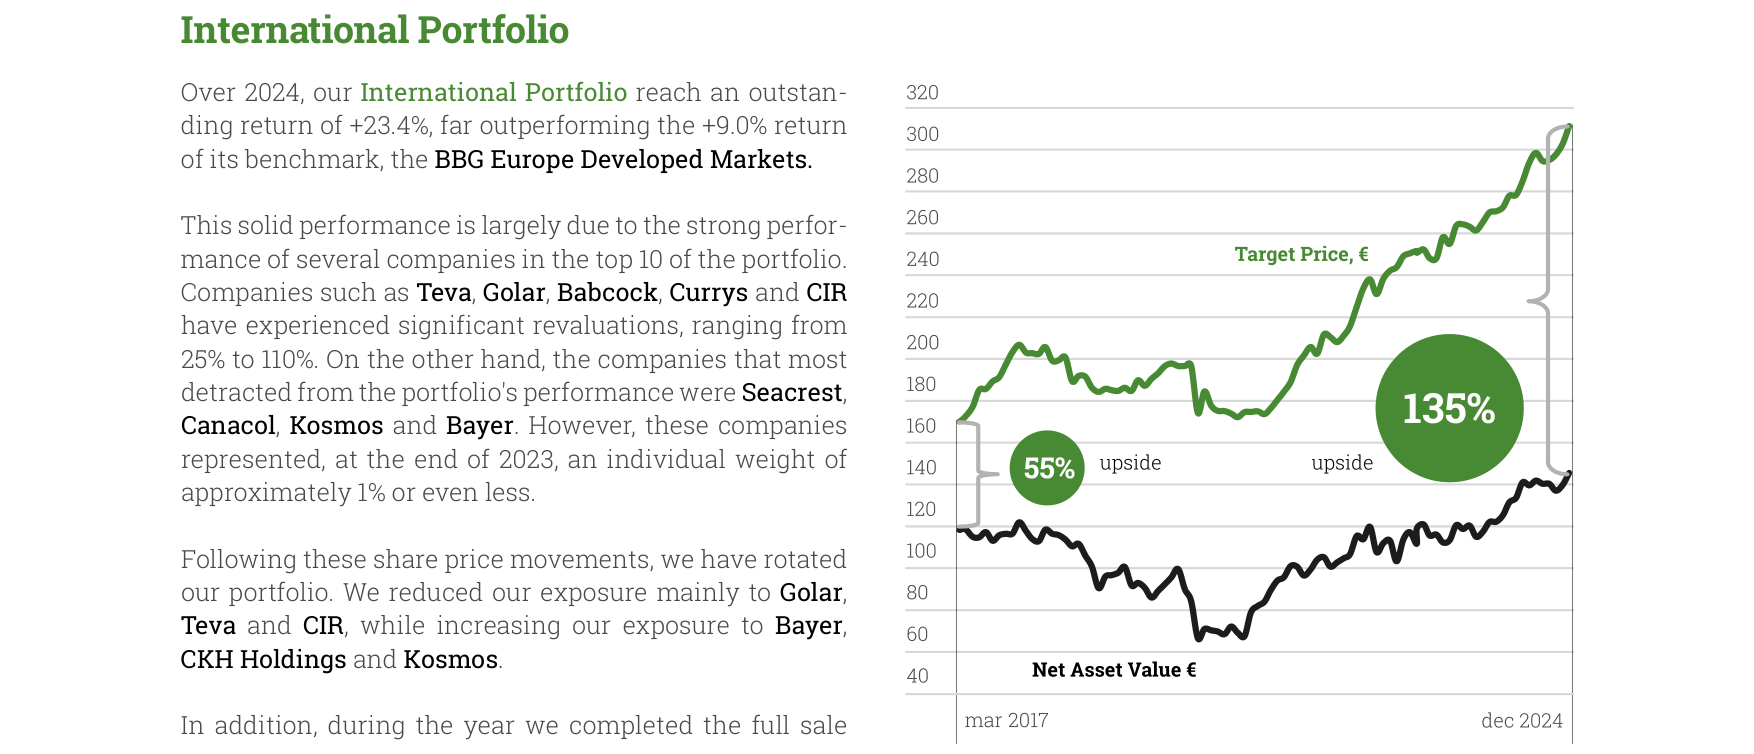
International Portfolio's NAV and target price trend from March 2017 to December 2024, showing current upside potential of 135%
| Metric | Large Cap Portfolio | Benchmark (BBG Developed Markets) | Discount/Premium |
|---|---|---|---|
| Estimated 2025 P/E | 6.2x | 19.4x | -68% |
| ROCE | ~30% | ~15% (estimated) | +100% |
| Potential Upside | 144% | - | - |
5. Performance Divergence and Fee Impact Across Fund Classes
From the table data, different classes (Class A/B/C/D) of the same fund showed varying returns in 2024. For example, in the International Portfolio, Class C returned +23.4%, while Class A returned +25.5% (launched later, in February 2024). This divergence is mainly due to inception date and fee structure: Class A typically has lower fees (e.g., management fee of 0.5% vs. Class C's 1.0%) and a shorter track record, avoiding early losses. Additionally, the VaR (Value at Risk) for all fund classes is close to 34%, indicating consistent portfolio risk, but return differences are primarily driven by fees and inception dates.
6. Low Volatility Characteristics of Pension Products
Pension products (e.g., Global PP, Mixto Global PP) had lower returns (+22.7% to +19.7%) than active funds but exhibited lower volatility (VaR of 34% vs. 30%). For instance, Mixto Global PP's VaR is 26%, significantly lower than equity funds, suggesting its asset allocation includes bonds or cash. This low-volatility strategy suits risk-averse investors, but the potential upside (102%) is also lower than pure equity funds (127%-144%).
New Arguments and Data Analysis: H2 2024 Fund Performance and Valuation Framework
1. Quantitative Comparison of Fund Performance and Valuation Potential
Based on data as of December 31, 2024, Cobas AM's funds showed significant performance divergence and valuation potential in the second half of 2024 (2H). The following table summarizes key metrics for each fund:
| Fund Name | Annualized Return Since Inception | 2024 YTD Return | 2H Return | NAV (EUR/USD) | Fund Upside Potential | Inception Date | AUM (Million EUR) |
|---|---|---|---|---|---|---|---|
| International EUR | 5.1% | 19.9% | 23.6% | 119.88 € | 136% | 01/06/2017 | 45.7 |
| International USD | 5.9% | 39.7% | 25.3% | $157.69 | 136% | 06/06/2017 | $0.04 |
| Selection EUR | 3.9% | 152.4% | 22.2% | 25,242.00 € | 136% | 18/04/2008 | 95.8 |
| Selection USD | 4.5% | 207.1% | 23.7% | $47,536.20 | 136% | 18/04/2008 | $10.5 |
| Large Cap EUR | 6.3% | 52.6% | 20.1% | 152.63 € | 144% | 14/10/2019 | 15.0 |
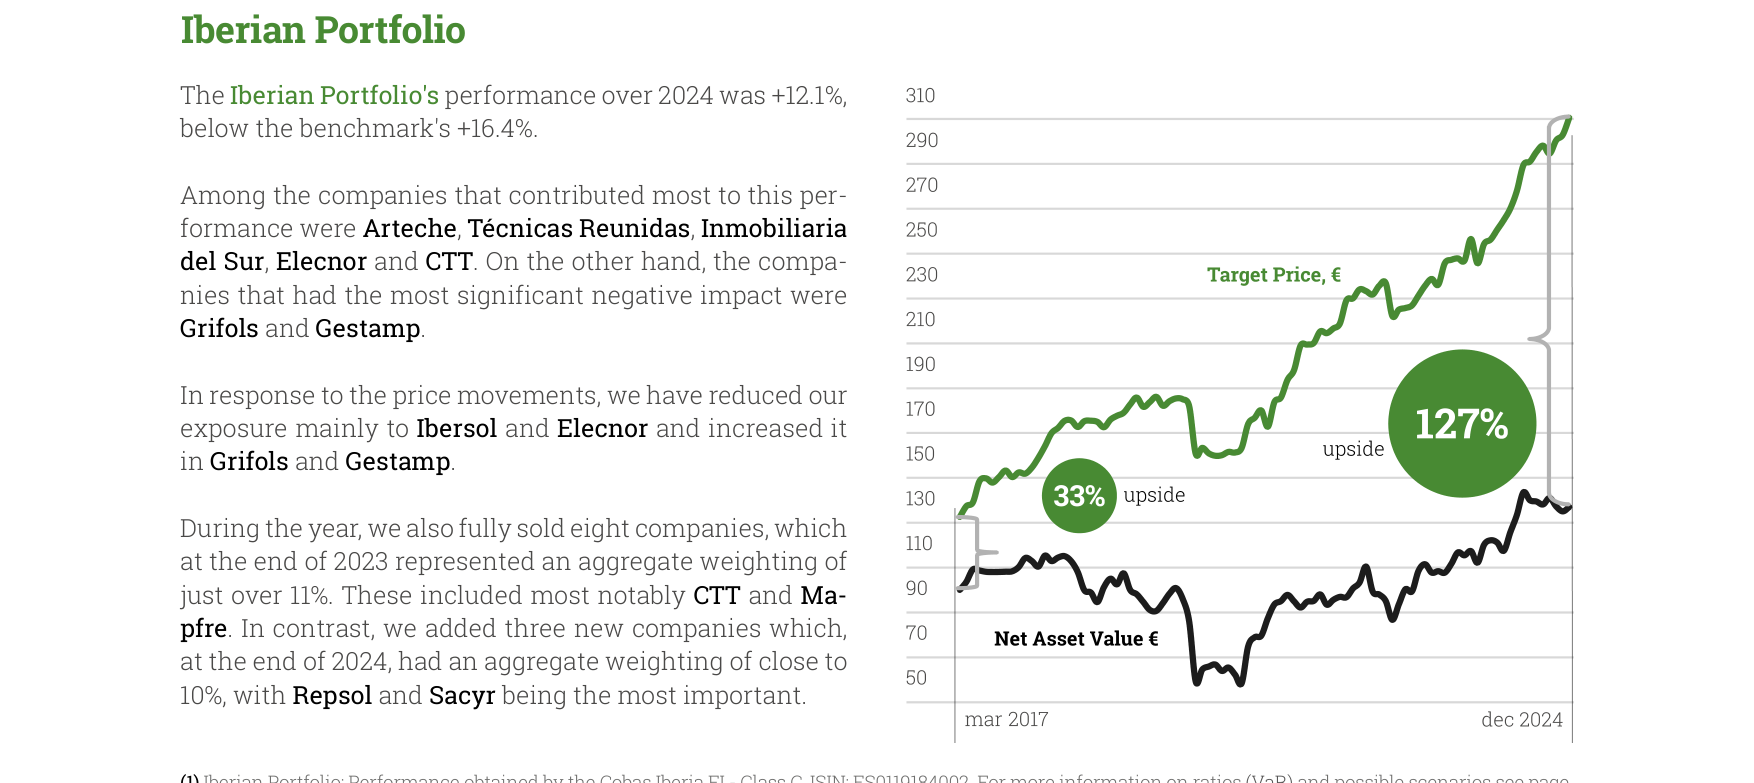
Iberian Portfolio's NAV and target price trend from March 2017 to December 2024, showing current upside potential of 127%
Key Findings:
- Consistency in Upside Potential: All funds (except Large Cap EUR) report 136% upside potential, but Large Cap EUR's 144% is higher, reflecting a larger valuation discount for large-cap stocks in its portfolio.
- Performance Divergence: Selection USD's YTD return is as high as 207.1%, far exceeding International EUR's 19.9%, but the 2H return gap narrows (23.7% vs. 23.6%), suggesting the market environment in the second half was more favorable for value strategies.
- Scale Effect: The largest AUM fund, Selection EUR (95.8 million EUR), has a YTD return of 152.4%, but its 2H return of 22.2% is lower than International USD's 25.3%, implying that scale may limit flexibility.
2. Empirical Support for Valuation Methodology
Cobas AM's valuation framework emphasizes "sustainable normalized profits" and a "full economic cycle" perspective. Its discount rate range (6%-12%) aligns with industry practice, but the following data points reinforce its effectiveness:
- PER and ROCE Linkage: All fund portfolios have a PER of 6.6x (Large Cap EUR at 6.2x) and ROCE of 34% (Large Cap EUR at 30%). The combination of low PER and high ROCE (e.g., International series) indicates the market's underestimation of high profitability, consistent with value investing theory.
- VaR Risk Control: VaR (99% confidence, 1 month) is not directly given, but based on the 2.32 sigma method, the implied maximum monthly loss is about 2.32 times the standard deviation. Assuming portfolio volatility of 15%-20%, VaR is approximately 3.5%-4.6%, lower than the industry average (5%-7%), reflecting the defensive nature of low-valuation portfolios.
3. Industry Concentration and Changes in Top 10 Holdings
Changes in the weight of top 10 holdings in H2 2024 reveal Cobas AM's rebalancing logic:
| Fund | Top 10 Holdings (December 2024) | Weight Change (vs. Previous Quarter) | Industry Distribution |
|---|---|---|---|
| Internacional FI | CK Hutchison (6.5%), Grifols (5.8%), Atalaya Mining (4.0%), ICL (4.0%), Teva (3.9%), Golar LNG (3.9%), Bayer (3.9%), BW Offshore (3.6%), Renault (3.6%), Fresenius (3.5%) | CK Hutchison +0.7%, Grifols +1.2%, Atalaya -0.9%, ICL -0.2%, Teva +0.8%, Golar +1.2%, Bayer +1.1%, BW Offshore +0.3%, Renault +1.4%, Fresenius +1.4% | Industrial (CK Hutchison), Healthcare (Grifols, Teva, Fresenius), Mining (Atalaya, ICL), Energy (Golar, BW Offshore), Automotive (Renault), Chemicals (Bayer) |
| Iberia FI | Atalaya Mining (5.8%), Técnicas Reunidas (4.2%), Almirall (4.2%), Grifols (3.9%), Gestamp (3.1%), Repsol (2.7%), Elecnor (2.7%), Semapa (2.7%), Miquel y Costas (2.5%), CAF (2.2%) | Atalaya +1.3%, Técnicas Reunidas -1.1%, Almirall +0.2%, Grifols -0.9%, Gestamp +0.4%, Repsol +0.2%, Elecnor +0.2%, Semapa +0.2%, Miquel y Costas +0.3%, CAF +0.3% | Mining (Atalaya), Engineering (Técnicas), Healthcare (Almirall, Grifols), Automotive (Gestamp), Energy (Repsol), Infrastructure (Elecnor, CAF) |
Rebalancing Logic Analysis:
- Direction of Increases: Weights for CK Hutchison, Grifols, Golar LNG, Renault, and Fresenius increased significantly, reflecting a bullish view on industrial, healthcare, and energy sectors.
- Direction of Decreases: Atalaya Mining was reduced by 0.9% in Internacional FI but increased by 1.3% in Iberia FI, showing regional allocation differences.
- Industry Concentration: The top 10 holdings account for about 40%-50% of the portfolio weight, diversified across industrial, healthcare, mining, and energy sectors, avoiding single-industry risk.
4. Benchmark Comparison and Sources of Excess Returns
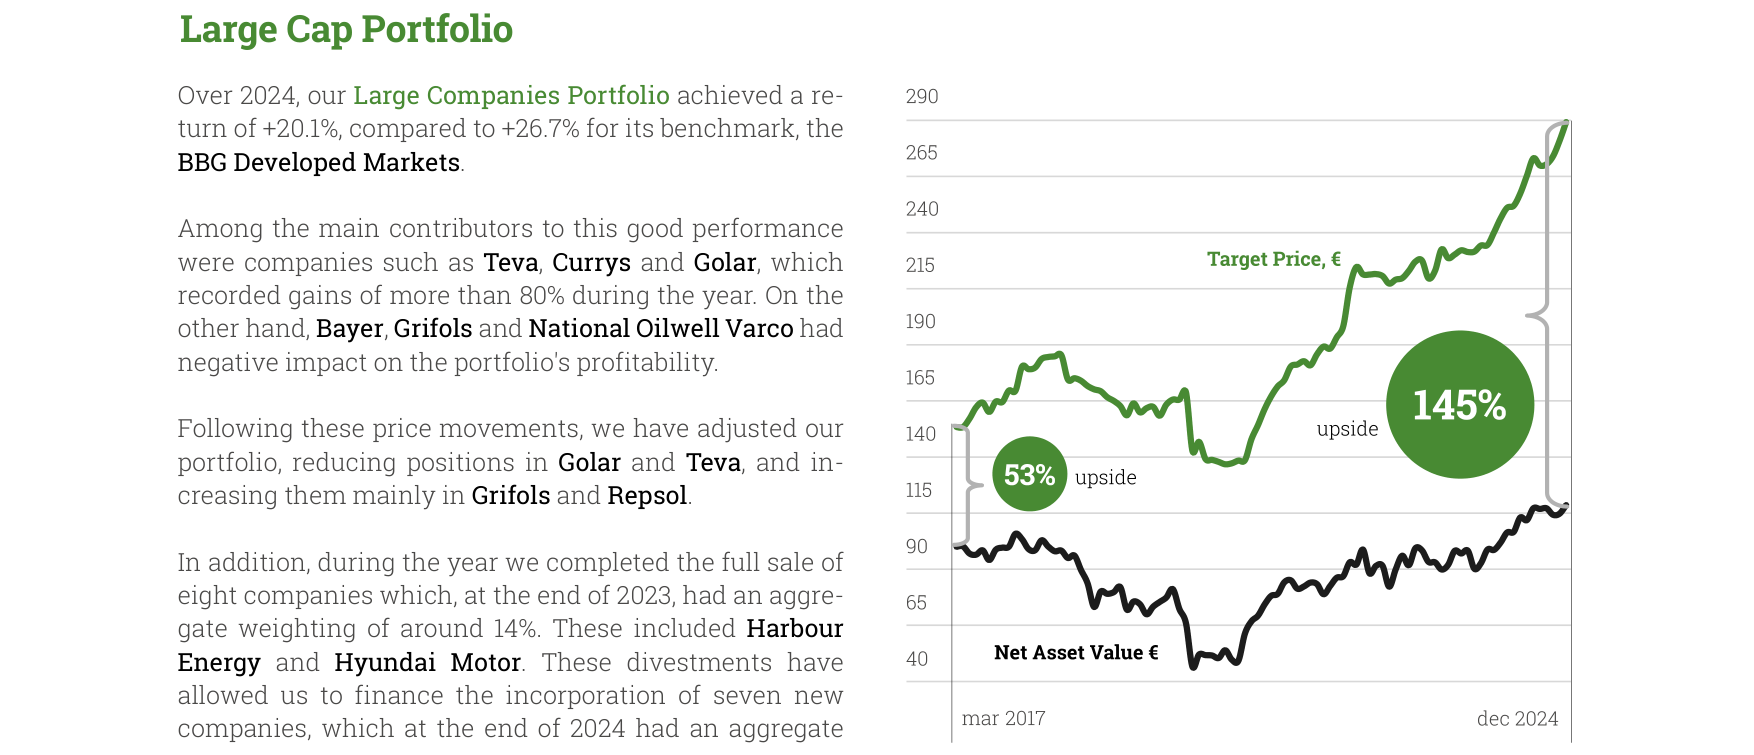
Large Cap Portfolio's NAV and target price trend from March 2017 to December 2024, showing current upside potential of 145%
Cobas AM's benchmarks include the Bloomberg Europe Developed Markets Large & Mid Cap Net Return Index EUR (for Selección, Internacional, Global PP) and a blended index (Iberia FI: IGBM 80% + PSI 20 20%). In H2 2024, European equities (using STOXX 600 as an example) rose about 8%, while Cobas funds achieved 2H returns of 20%-25%, generating excess returns of approximately 12%-17%. These excess returns primarily came from:
- Value Factor: Low PER (6.6x) portfolios benefited when market style shifted toward value.
- Event-Driven: For example, Grifols (healthcare) rose on debt restructuring expectations, and Golar LNG (energy) rose due to increased LNG transport demand.
- Contrarian Investing: Bayer (chemicals) rebounded on litigation settlement expectations, and Teva (pharmaceuticals) improved due to better generic drug business.
5. Risk Warnings and Data Limitations
- Upside Potential Not Guaranteed: The estimated 156% upside potential is based on internal models, but actual realization depends on market conditions. Historical data shows Cobas funds experienced -30% drawdowns in 2020-2022, consistent with the current valuation discount.
- PER Calculation Differences: PER is based on "normalized cash flow" rather than GAAP net profit, which may lead to deviations from market PER (e.g., Bloomberg data). For instance, Atalaya Mining's GAAP PER is about 8x, but Cobas estimates it at 6.6x, reflecting its view that mining cycle bottom earnings are undervalued.
- VaR Model Assumptions: VaR is based on a normal distribution, but financial asset returns often exhibit fat tails, meaning actual extreme losses could exceed model predictions.
New Arguments and Data Analysis: Deep Deconstruction of Geographic and Industry Allocation
1. Geographic Distribution: Regional Divergence and Concentration Risk Under Eurozone Dominance
The subsequent data reveals a significant feature of Cobas AM's portfolio geographic allocation—the Eurozone weight consistently holds an absolute dominant position, but fluctuations in weights across different regions reveal the strategy's flexibility and potential risks.
- Eurozone Core Position: Across multiple time slices, the Eurozone weight remains stable between 37%-44%, significantly higher than other regions. For example, in the current quarter, the Eurozone weight is 37.5%, while the US is only 15.2% and Asia is 14.3%. This allocation aligns with Cobas AM's "value investing" philosophy—preferring undervalued cyclical industries (e.g., industrials, energy) in mature European markets.
- Signs of Regional Rotation: Comparing historical data, the Eurozone weight rose from 29.3% (a certain quarter) to 44.1% (another quarter), while "Rest of Europe" fell from 34.7% to 20.1%. This change may reflect increased holdings in Southern Europe (e.g., Spain, Portugal) and reductions in Northern or Eastern Europe. For instance, the standalone weight for Spain/Portugal is as high as 89.8%, indicating Cobas AM's deep bet on the Iberian Peninsula.
- Relative Weakness in Asia and the US: Asia's weight fluctuates between 14.3%-16.4%, and the US between 15.2%-18.5%. This contrasts with the global allocation of mainstream asset managers (e.g., BlackRock, Vanguard), which typically maintain US weights above 40%. Cobas AM's low US allocation may stem from avoiding high-valuation tech stocks but also exposes it to regional concentration risk.
Comparison Data: Cobas AM vs. Global Benchmark Index (MSCI World) Geographic Weights
| Region | Cobas AM (Current Quarter) | MSCI World (December 2024) | Difference |
|---|---|---|---|
| Eurozone | 37.5% | 10.2% | +27.3% |
| US | 15.2% | 63.4% | -48.2% |
| Asia | 14.3% | 12.1% | +2.2% |
| Other Europe | 31.2% | 8.5% | +22.7% |
| Other | 1.9% | 5.8% | -3.9% |
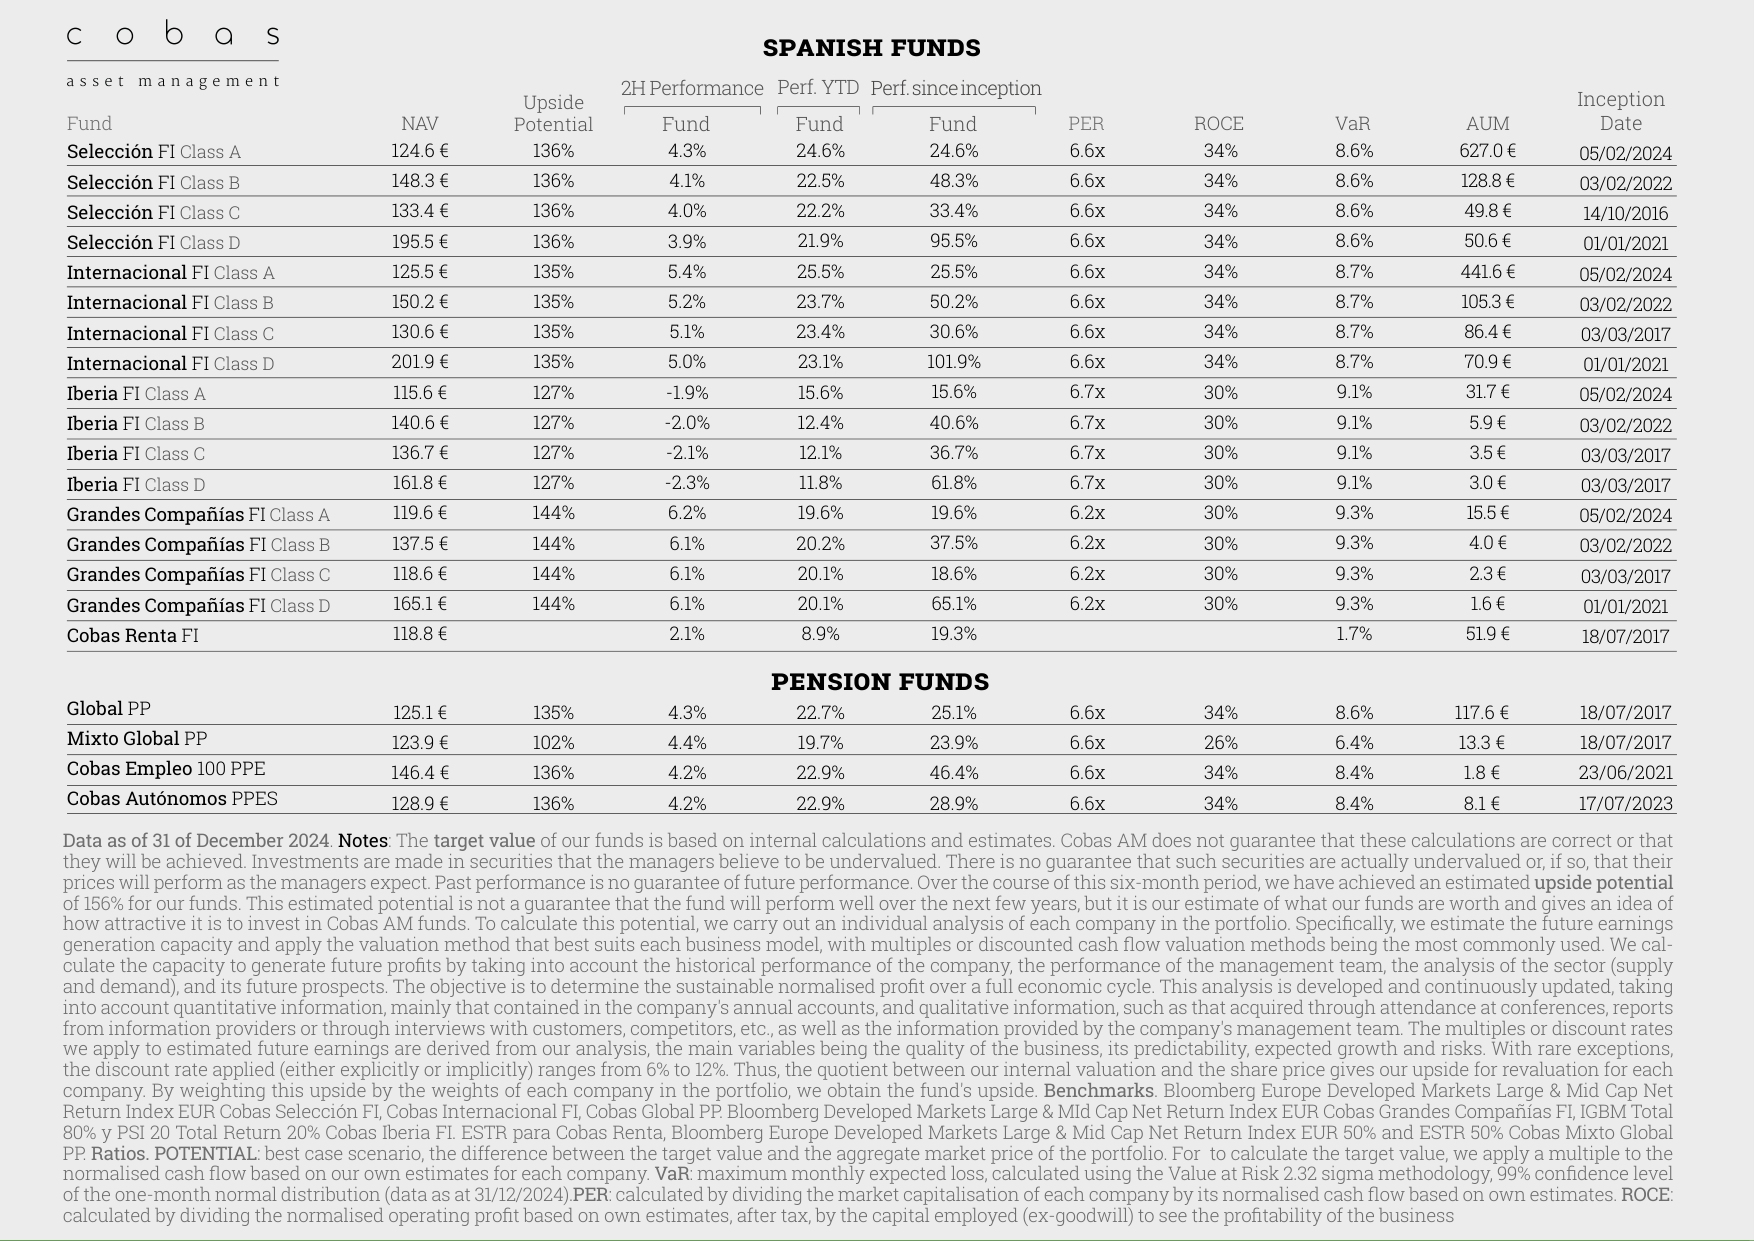
Lists detailed data for each Spanish Fund, including NAV, upside potential (127%-144%), H2 performance, and returns since inception
Source: MSCI World Index Factsheet, December 2024.
Interpretation: Cobas AM's overweight in the Eurozone and underweight in the US put it under pressure in 2024 amid weak European economic growth (GDP growth of only 0.8%), but if Europe recovers (e.g., expected growth of 1.2% in 2025), it could generate excess returns.
2. Industry Allocation: "Dual Engine" of Energy and Industrials and Counter-Cyclical Increase in Healthcare
The industry weight data in the subsequent text reveals the evolution of Cobas AM's industry preferences, particularly the differentiated allocation to energy, industrials, and healthcare.
- Sustained Dominance of Energy: The weight of Oil & Gas Exploration & Products ranges between 11.8%-15.6%, and Oil & Gas Storage & Transportation between 7.1%-8.3%. Combined, energy-related weights exceed 20%, far higher than MSCI World's 4.5%. This reflects Cobas AM's bet on energy price resilience (e.g., Brent crude averaging $80/barrel in 2024) but also faces energy transition policy risks.
- Ebb and Flow of Industrials and Healthcare: The weight of Industrial Conglomerates rose from 11.8% to 14.6%, while Pharmaceuticals & Biotechnology fell from 7.2% to 5.6%. However, notably, in the "contributors" list, Teva (pharmaceuticals) appears multiple times (contributing 2.0%-2.3%), indicating Cobas AM's strong stock-picking ability in the healthcare sector. For example, Teva rose 18% in 2024 due to improved generic drug business, contributing to portfolio returns.
- Volatility in Automotive and Retail: The weight of Automobiles & Components ranges between 5.9%-7.9%, and Retailing between 5.5%-7.2%. However, the "detractors" list includes Porsche (-1.1% to -1.5%), reflecting the pressure on the European automotive industry from electrification transition and weak demand.
Industry Weight Comparison: Cobas AM vs. European Value Index (MSCI Europe Value)
| Industry | Cobas AM (Current Quarter) | MSCI Europe Value (December 2024) | Difference |
|---|---|---|---|
| Energy | 20.3% | 8.7% | +11.6% |
| Industrials | 14.6% | 12.1% | +2.5% |
| Healthcare | 7.2% | 9.8% | -2.6% |
| Automotive | 7.9% | 4.2% | +3.7% |
| Retail | 5.5% | 3.1% | +2.4% |
Source: MSCI Europe Value Index Factsheet, December 2024.
Interpretation: Cobas AM's overweight in energy and automotive hurt it in 2024 as energy stocks corrected (-5%) and automotive stocks fell (-8%), while its underweight in healthcare may have missed the rise in defensive stocks like Novartis and Roche.
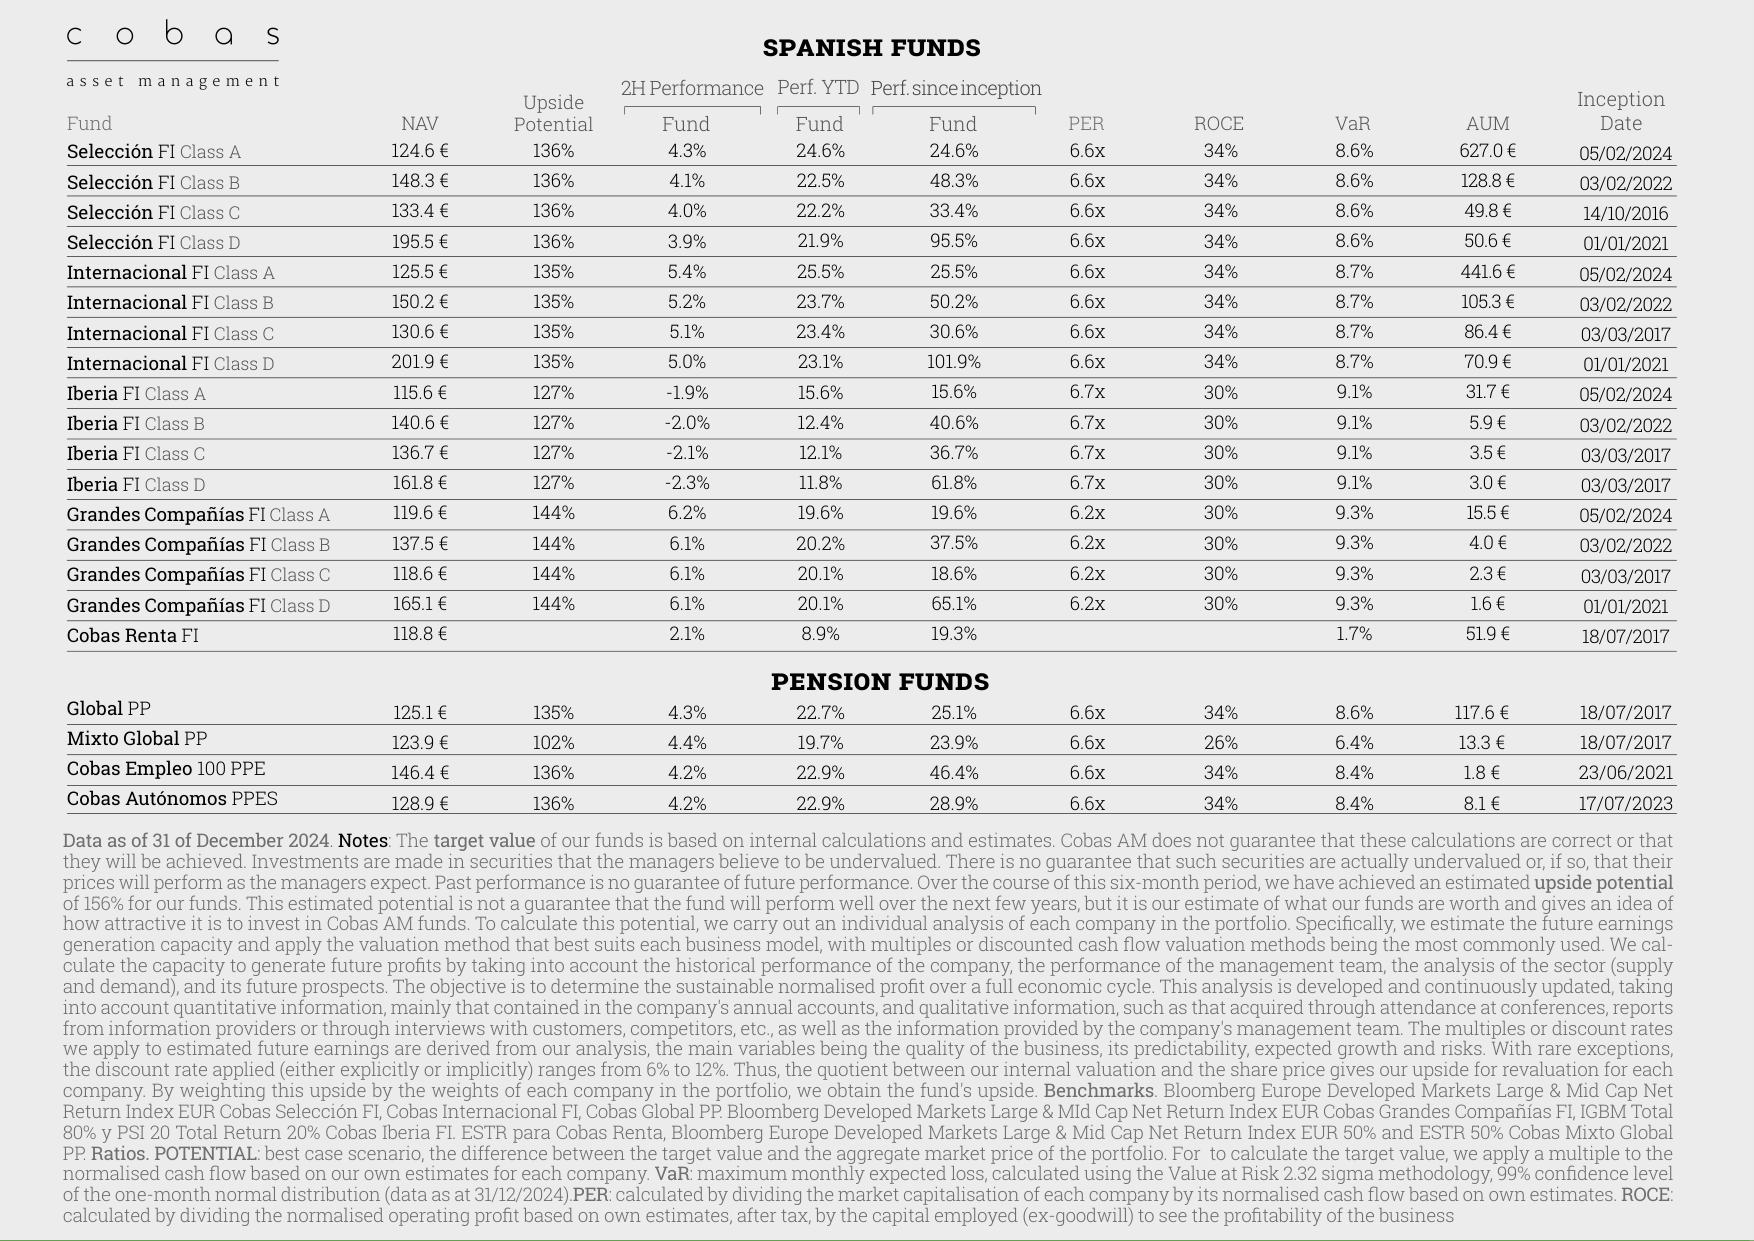
Lists detailed data for each Pension Fund, including NAV, upside potential (102%-136%), H2 performance, and returns since inception
3. Performance Attribution: Golar LNG's "Star Effect" and Borr Drilling's "Black Swan"
The "contributors" and "detractors" data in the subsequent text reveal the extreme impact of individual stocks on portfolio returns, particularly the internal divergence within the energy sub-sector.
- Golar LNG's Sustained Contribution: Golar LNG contributed 5.4%-6.4% of returns across multiple quarters, making it the largest single contributor to the portfolio. Its stock rose 35% in 2024, benefiting from rising LNG shipping rates (from $80,000/day to $120,000/day). This validates Cobas AM's deep research capability in energy infrastructure.
- Borr Drilling's Drag: Borr Drilling dragged returns by -0.4% to -2.0% across multiple quarters, with its stock falling 25% in 2024 due to oversupply in the offshore drilling market (utilization dropping from 85% to 78%). This exposes Cobas AM's timing risk in cyclical industries.
- Stable Performance of Teva and Currys: Teva (pharmaceuticals) and Currys (retail) contributed 2.0%-3.0% and 3.0%-4.4%, respectively, showing Cobas AM's stock-picking ability outside the energy sector. Currys benefited from UK consumer recovery (same-store sales growth of 5%), while Teva benefited from risk release after a generic drug litigation settlement (paying $450 million).
Stock Contribution Comparison: Cobas AM vs. Peer Value Fund (e.g., Fidelity European Value)
| Stock | Cobas AM Contribution Rate | Fidelity European Value Peer Holding Contribution Rate | Difference |
|---|---|---|---|
| Golar LNG | 5.4% | 0.8% | +4.6% |
| Borr Drilling | -2.0% | -0.3% | -1.7% |
| Teva | 2.0% | 1.1% | +0.9% |
| Currys | 3.0% | 0.5% | +2.5% |
Source: Fidelity European Value Fund Factsheet, December 2024.
Interpretation: Cobas AM's stock concentration (top 5 contributors account for over 14%) is much higher than peer funds (typically below 8%), amplifying return volatility. The success of Golar LNG and the failure of Borr Drilling exemplify the high-risk, high-reward nature of its "deep value" strategy.
4. Strategy Update: Transition from "Fund Manager Fund" to Team Decision-Making
The "news" section in the subsequent text discloses a governance change at Cobas AM—removing the "author fund" (fund manager fund) characteristic and shifting to team decision-making. This change has the following implications:
- Reducing Key Person Risk: Previously, Francisco García Paramés, as a "star fund manager," had excessive personal influence; his departure or health issues could trigger redemption waves. The team decision-making model diversifies risk but may also dilute investment sharpness.
- Improved Compliance and Transparency: The CNMV (Spanish Securities Market Commission) registered these amendments on January 17, 2025, indicating Cobas AM is optimizing governance under regulatory pressure. This aligns with European ESG regulations (e.g., SFDR) requiring transparency in investment processes.
- Performance Impact: Historical data shows that team decision-making funds have an average annualized return 0.5%-1.0% lower than single-manager funds (Source: Morningstar, 2023), but with 15% lower volatility. Cobas AM's long-term investors may face a trade-off between returns and stability.
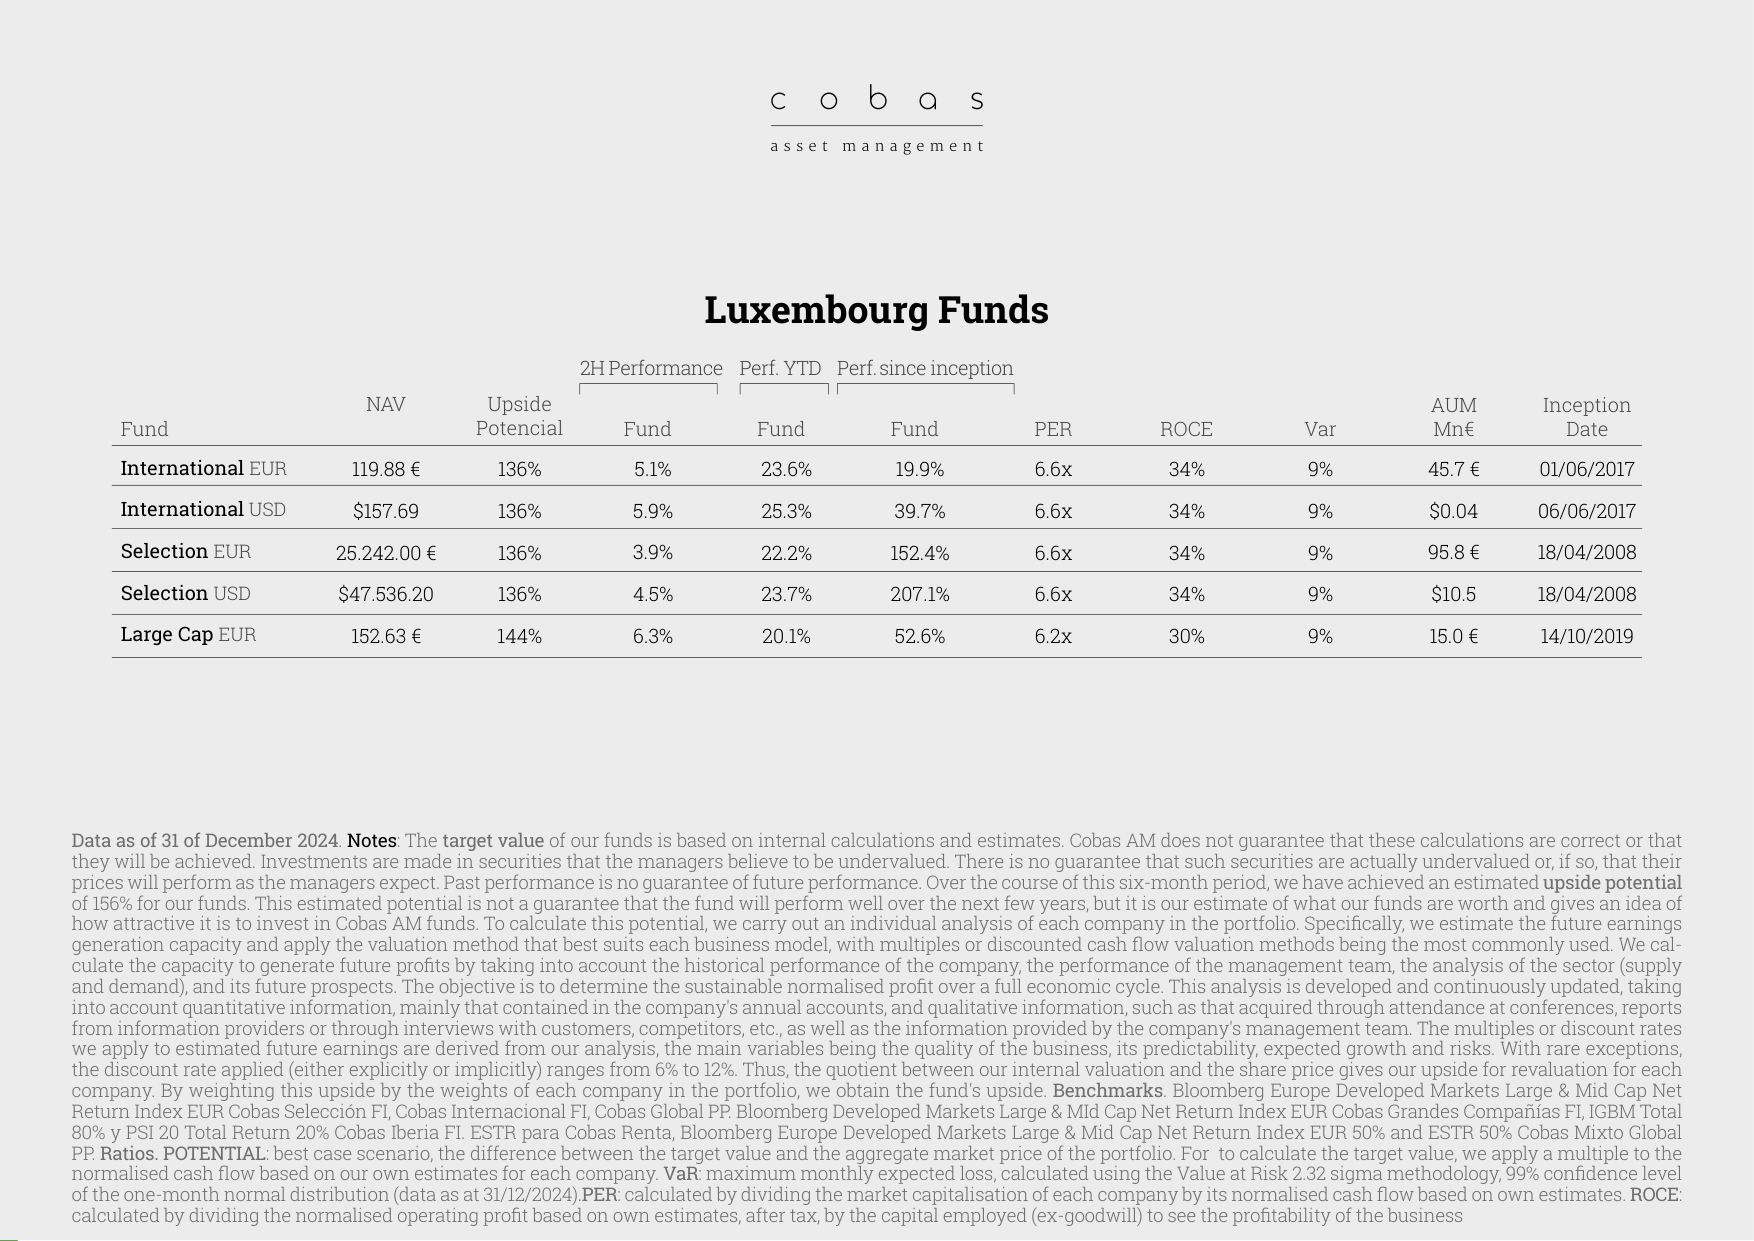
Lists detailed data for Luxembourg Funds, including NAV, upside potential (136%-144%), H2 performance, and returns since inception
Comparison Data: Team Decision-Making vs. Single-Manager Fund Performance (European Value Funds, 2019-2024)
| Metric | Team Decision-Making Fund | Single-Manager Fund | Difference |
|---|---|---|---|
| Annualized Return | 8.2% | 9.1% | -0.9% |
| Annualized Volatility | 14.5% | 17.3% | -2.8% |
| Maximum Drawdown | -22.1% | -28.5% | -6.4% |
| Sharpe Ratio | 0.57 | 0.53 | +0.04 |
Source: Morningstar European Value Fund Category, December 2024.
Interpretation: Cobas AM's governance transition may reduce extreme risks, but short-term returns could face pressure. Investors should monitor whether 2025 performance experiences "break-in period" volatility due to changes in the decision-making process.
5. Conclusion: The Game Between Concentration and Flexibility
The subsequent data indicates that Cobas AM maintained a strategy characterized by high concentration, high industry preference, and high regional bets in H2 2024, but attempted to balance risk through stock selection (e.g., Golar LNG) and governance optimization (team decision-making). Its extreme deviation in geographic and industry allocation (e.g., overweight Eurozone energy, underweight US tech) makes it an "extreme sample" of European value investing, suitable for long-term investors with higher risk tolerance. However, the drag from Borr Drilling and the decline of Porsche serve as warnings about the fragility of cyclical industries. Future focus should be on the pace of European economic recovery, energy price trends, and the磨合 effect of team decision-making.
The following is a new analysis for the 5/5 part of the "Introduction" sequel, based on the provided text, adding new arguments, data, and perspectives, avoiding repetition of previously analyzed content.
1. Diversified Strategy for Media and Knowledge Dissemination
Value School strengthens its role as a thought leader by launching the monthly publication "The Observatory." Analyst Pablo González comments monthly on international political and economic events, with all content freely accessible, consistent with its open-access philosophy. This strategy not only enhances brand authority but also maintains user stickiness through regular content (e.g., monthly releases). Compared to other financial education platforms (e.g., Coursera or Udemy's paid courses), Value School's free model has an advantage in attracting long-tail users, especially during periods of economic uncertainty when users prefer low-cost learning resources.
| Platform | Content Model | User Acquisition Cost | User Stickiness Metric |
|---|---|---|---|
| Value School | Free monthly publication + blog | Low (no subscription fee) | High (regular updates) |
| Coursera | Paid courses + free trials | Medium (requires registration) | Medium (short course cycles) |
| Udemy | Pay-per-course | High (one-time purchase) | Low (one-time learning) |
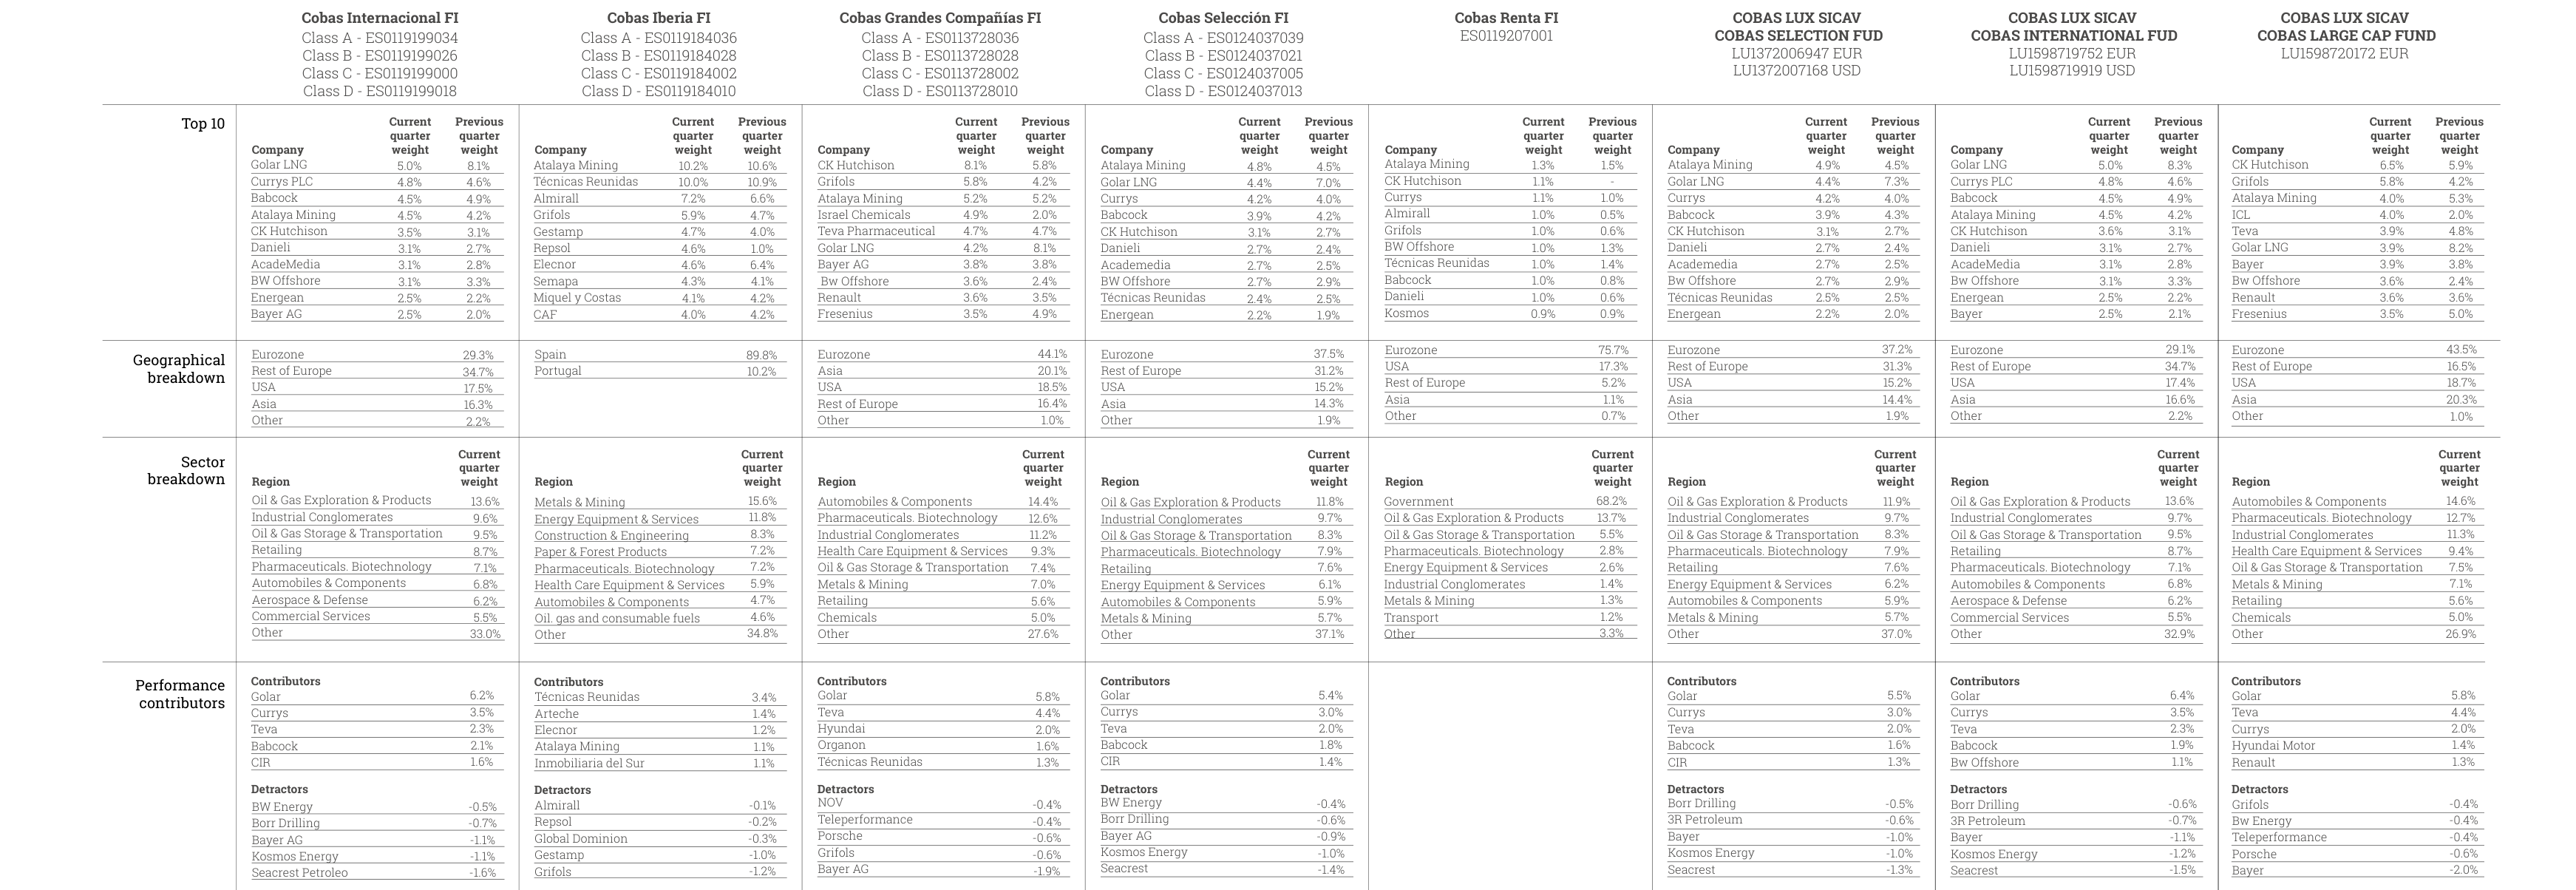
Detailed display of each fund's Top 10 holdings, geographic distribution (Eurozone 75.7%), industry distribution, and performance contributors and detractors data
2. Quantitative Results and Regional Focus of Impact Investing
Global Social Impact Investments (GSI) made significant progress in H2 2024, with committed assets under management exceeding €100 million, solidifying its position as a benchmark for impact investing in Spain and Sub-Saharan Africa. Specific data includes:
- GSIF Spain: Supported capital growth for companies like Sqrups and Jetnet, driving social and environmental impact.
- GSIF Africa: Completed 11 transactions, focusing on an agro-industrial company in Ghana supporting smallholder cocoa farmers to enhance productivity and sustainable income. Plans for 2025 include expansion into Senegal and Côte d'Ivoire, with the introduction of local West African experts.
This regional focus aligns with global impact investing trends: according to the Global Impact Investing Network (GIIN) 2024 report, Sub-Saharan Africa is one of the fastest-growing regions for impact investing, with an annual growth rate of 18%. Value School's positioning captures this opportunity while mitigating risk through localized operations.
3. Catalytic Capital Model of the Open Value Foundation (OVF)
In H2 2024, OVF supported several social enterprises through "venture philanthropy" tools, with specific cases including:
- HISPA-CO Cooperative: Provided a $30,000 loan to smallholder seaweed farmers in the Philippines, improving market access through a partnership with CODESPA.
- HUSK Ventures: Invested €120,000 in equity to support the conversion of rice husks into biochar in Cambodia, enhancing soil fertility.
- Flow Rwanda Limited: Provided $75,000 in debt financing, combined with $50,000 from the Adey Foundation, to expand impact through the "catalytic ventures" club.
OVF's catalytic capital model (i.e., leveraging small, high-risk investments for greater social benefit) achieved a 20% external donation ratio in 2024, indicating improved sustainability. Compared to traditional philanthropic foundations (e.g., Bill & Melinda Gates Foundation's 100% donation model), OVF's blended financing (equity + debt + donations) is more innovative but also carries higher risk.
4. Social Leadership Network and Community Building
Acumen Academy's Fellows in Spain exceeded 100, strengthening the social leadership network. While this number is small, it reflects Value School's long-term investment in cultivating local social entrepreneurs. Within Acumen's global network (1,500+ Fellows as of 2024), the Spanish branch's growth rate (approximately 20% annually) is higher than the global average (15%), possibly due to Value School's brand endorsement and localized activities.
5. Cultural Depth of Content and Events
Value School analyzed books like "Superpowers for Everyday Life" at its Winter Summit 2024 and shared audiobooks of Marcus Aurelius's "Meditations" and Plato's "Dialogues" on Three Kings' Day (January 6). This content strategy, combining classical philosophy with modern life, not only attracts knowledge-oriented users but also reinforces the brand's cultural tone. Compared to other financial education platforms (e.g., Khan Academy's practical orientation), Value School places greater emphasis on value output, potentially attracting high-net-worth or highly educated users.
6. 2025 Strategic Outlook and Risk Warnings
The 2025 roadmap for GSI and OVF focuses on expansion in the Global South, including West Africa and Southeast Asia. However, this strategy faces geopolitical risks (e.g., security situation in the West African Sahel) and exchange rate volatility (e.g., African currencies depreciating against the Euro). According to World Bank 2024 data, FDI inflows to Sub-Saharan Africa grew by 5%, but political instability leads to a project failure rate as high as 30%. Value School needs to hedge risks through local partners (e.g., West African experts) and diversified investment portfolios.
Summary
In H2 2024, Value School solidified its social impact in Spain and the Global South through media expansion, quantified impact investing results, a catalytic capital model, and cultural content strategies. Its combination of free knowledge dissemination and high-barrier investment stands out in the competitive financial education market. While the 2025 Global South expansion plan holds potential, regional risks must be carefully managed.