Comment First Semester 2024
Cobas Asset Management is a Madrid deep-value firm founded in late 2016 by Francisco García Paramés, Europe's standard-bearer of value investing after 25+ years running Bestinver and author of "Investing for the Long Term". Cobas applies a strict Graham/Buffett value framework overlaid with Austrian business-cycle theory, concentrating in unloved energy, shipping and other cyclicals, with AUM above €3.4bn. Its investor letters are fully archived from Q1 2017, moving to a semi-annual cadence in 2022.
In plain words
This report explains how Cobas fund works in reverse: they sold stocks that soared over the past two years (like Exmar, Gaslog) and bought beaten-down names such as CK Hutchinson (down 55% from 100 HKD to 37 HKD). The fund claims its holdings still have 133% upside potential on average and trade at just 6.6 times earnings vs. over 14 times for the market. They also highlight Asia's faster growth (5.4%) and increasing sales exposure there for European companies. For ordinary investors, it suggests avoiding momentum and instead looking for bargains in out‑of‑favor stocks.
Cobas' 2024 first-half investment report indicates that its international portfolio rose 17% (benchmark BBG Europe Developed Markets at 9%), and its Iberian portfolio rose 14% (benchmark at 10%). However, the fund remains significantly undervalued, with the international portfolio's growth potential
Theme and Background
This chapter is the opening of Cobas' 2024 first-half investment report, reviewing the fund's performance during the period and elaborating on the application of its value investing philosophy in the current market environment. The report emphasizes that although the fund has outperformed its benchmark for several consecutive years, the portfolio remains significantly undervalued. It is capitalizing on market downturns to rotate capital from stocks that have appreciated significantly into underperforming companies with higher margins of safety.
Core Views
- The Fund Remains Significantly Undervalued: Despite the International Portfolio rising 17% and the Iberian Portfolio rising 14% in the first half, the growth potential of the International Portfolio still stands at 133%, and the Iberian Portfolio at 108%.
- Contrarian Operation: The report explicitly states that of the 10 stocks that performed best over the past two years, it has completely exited 7, retaining only 3 (Golar, Teva, Elecnor) because their share prices are close to their estimated value. Simultaneously, it is increasing or initiating positions in companies that have declined by an average of 23% over the past two years, such as CK Hutchinson (share price falling from HKD 100 in 2018 to HKD 37, a decline of 55%).
- Long-term Bullish on Asian Growth: The report argues that Asian economies are younger, more dynamic, and face fewer regulatory hurdles. Their expected growth rate of 5.4% is significantly higher than that of Europe and the US (1.5%). This trend will continue to drive global growth and influence the business structures of the companies in which it invests.
Key Arguments and Data
1. Performance Comparison:
- International Portfolio: Up 17% in the first half, benchmark (BBG Europe Developed Markets) up 9%.
- Iberian Portfolio: Up 14% in the first half, benchmark up 10%.
2. Growth Potential:
- International Portfolio: 133%
- Iberian Portfolio: 108%
3. Top 10 Performing Stocks Over the Past Two Years (2022-23):
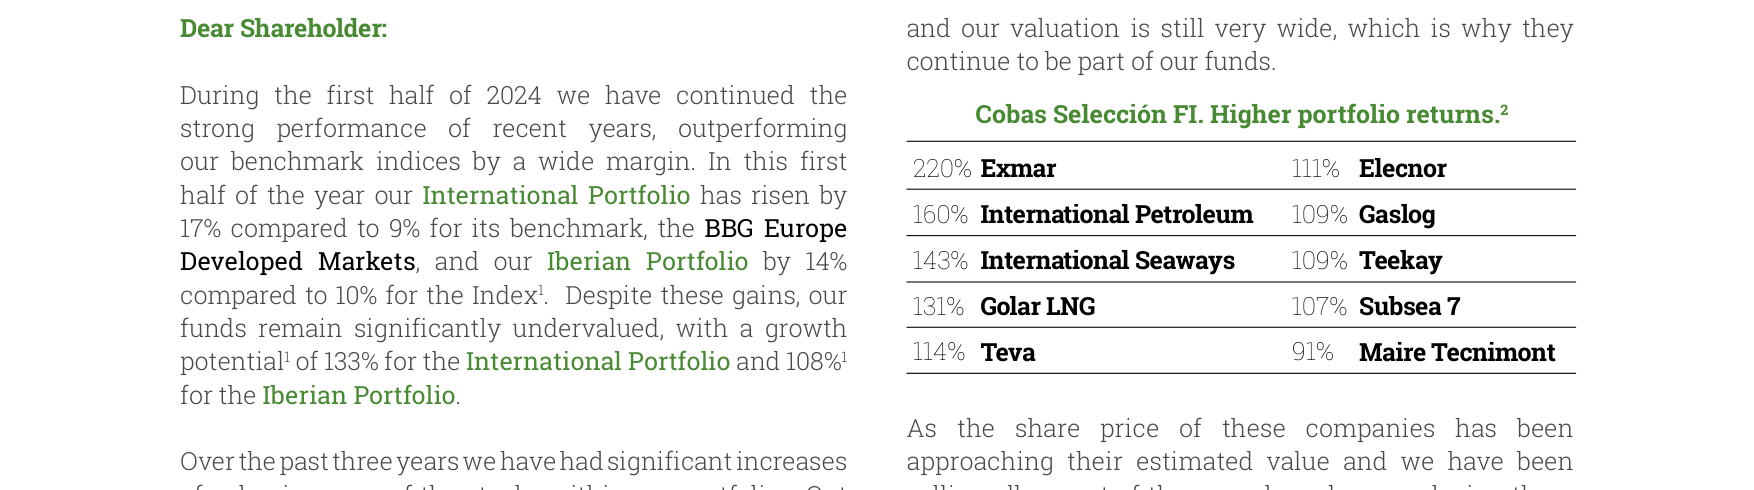
Data table showing high returns for ten companies including Exmar (220%), International Petroleum (160%)
| Company | Return (%) |
|---|---|
| Cobas Selección FI | 111% |
| Elecnor | 220% |
| Exmar | 109% |
| Gaslog | 160% |
| International Petroleum | 109% |
| Teekay | 143% |
| International Seaways | 107% |
| Subsea 7 | 131% |
| Golar LNG | 91% |
| Maire Tecnimont | 114% |
| Teva | 107% |
- Of these, 7 have been fully sold, retaining only Golar, Teva, and Elecnor (with reduced weightings).
4. Performance of Newly Bought/Increased Holdings:
- The 15 companies where positions were increased or newly initiated had an average return of -23% over the past two years.
5. CK Hutchinson Case Study:
- Share price fell from HKD 100 in 2018 to HKD 37, a decline of 55%.
- The report has held the position since early 2022 and continued to increase it in the second half of 2023 and the first half of 2024.
6. Global Growth Landscape:
- 2024 Global Growth Forecast: 3.1%
- Europe & US Growth Forecast: 1.5%
- Asia Growth Forecast: 5.4%
- Historical Trend: Developed countries' share of global GDP fell from 60% in 1990 to 40% currently, projected to fall to 20-30% in 20 years; Europe's GDP share fell from 25% in 1993 to 14% currently, projected to be below 10% by 2040; Emerging Asia's GDP share is projected to rise from 10% in 1990 to 40% by 2040.
7. Geographical Shift in Company Revenues:
- 20 years ago, 55% of products from EuroStoxx 600 companies were sold in Europe; currently, it is 40%. The proportion sold to Asia has risen from 11% to 20% and is on an upward trend.

Line chart of cumulative performance for fifteen new holdings and underperforming positions from 2022-2023, declining from 100 to approximately 75
Companies/Assets Involved
- CK Hutchinson: Core increased holding. Share price fell from HKD 100 to HKD 37 (-55%). The report believes it has a high margin of safety and continues to add to the position.
- Golar LNG, Teva, Elecnor: Performed well over the past two years, but the report retains only these three, with reduced weightings, as their share prices are close to estimated value.
- Exmar, Gaslog, International Petroleum, Teekay, International Seaways, Subsea 7, Maire Tecnimont: Performed well over the past two years, but the report has fully exited these positions.
- Maire Tecnimont: Used as a case study for the investment process. The report has held it for 6 years. It is an Italian engineering and construction company specializing in infrastructure for the petrochemical, fertilizer, and refining sectors.
Investment Implications
- Adhere to Contrarian Investing: Investors should focus on companies whose share prices have fallen significantly, are shunned by the market, but have sound fundamentals (e.g., CK Hutchinson), rather than chasing stocks that have already risen substantially. The report explicitly rotates capital from highly appreciated stocks to those that have declined significantly.
- Value Asian Growth: The economic growth potential of Asia (especially China and India) far exceeds that of Europe and the US. Investors should focus on European companies whose business is shifting towards Asia, or invest directly in Asian markets. The report notes that the proportion of European company sales to Asia has risen from 11% to 20%, a trend expected to continue.
- Long-term Perspective: The report emphasizes that short-term macroeconomic fluctuations (e.g., global growth rates fluctuating between 2.5% and 3.5%) are irrelevant for long-term investors. The core is to find undervalued, high-quality companies and hold them until value is realized.
New Arguments and Data: The Dynamic Process of Value Realization and Portfolio Management Practice

Geographical distribution map showing 2024 global economic growth forecast of 3.1%, with Asia at 5.4% significantly higher than Europe and the US at 1.5%
1. Asymmetric Convergence of Price and Value: Deepening the Maire Case
The Maire case further reveals the typical pattern of price and value convergence: price volatility is far greater than changes in value. From the rapid price increase in 2021 (from €2.5 to €7.5, a 200% gain) to the gradual selling by the end of 2023, the core driver was the dynamic contraction of Upside Potential. Specific data are as follows:
- 2021: The share price surged, but the model's estimated value only increased slightly (as business value grows slowly over time), causing the potential to drop from >100% to below the portfolio average, triggering a "quasi-automatic" reduction.
- End of 2023: When the share price rose from €2.5 to €7.5, the estimated value increased from €6.5 to approximately €7.3 (only 12% growth), and the potential fell from >100% to about 5.5% (see chart "Weight Price TP"), ultimately leading to full liquidation.
Key Insight: Value creation is a "living animal," but price fluctuations are an "emotion amplifier." Cobas AM's decision logic is anchored on potential, not price itself. When potential falls below the portfolio threshold, it actively sells, even if the price has not reached the target price.
2. Portfolio Rotation: Selling Winners, Buying Losers
Through the complete lifecycle of Maire (position initiated in 2017 → reduced in 2021 → liquidated in 2023), Cobas AM demonstrates a counter-cyclical rotation strategy:
| Phase | Price Change | Estimated Value Change | Potential Change | Action |
|---|---|---|---|---|
| Initiation Phase (2017) | €3→€1.5 (-50%) | Stable (€6.5) | From >100% to >200% | Actively increased position to 1% |
| Rising Phase (2021) | €2.5→€7.5 (+200%) | Slow rise (+12%) | From >100% to 5.5% | Gradually liquidated position |
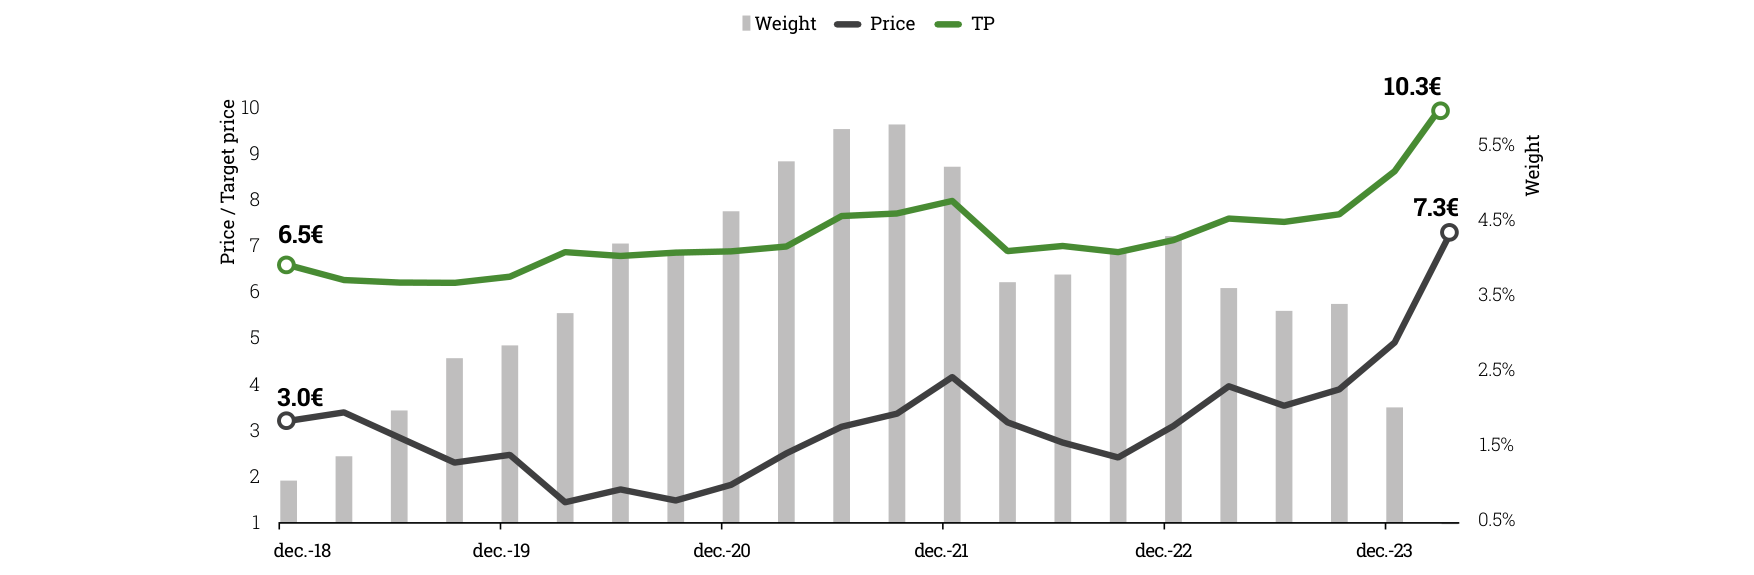
Dual-axis combination chart (bar + line) showing Maire Tecnimont's share price rising from €3.0 to €7.3, target price €10.3, and weight changes
Comparative Data: When the share price rose 200% in 2021, the estimated value increased by only 12%, compressing the potential to 5.5%. Conversely, when the share price fell 50% from 2017-2019, the estimated value remained stable, expanding the potential to >200%. This asymmetry is the core source of excess returns in value investing.
3. Value Creation at the Portfolio Level: Potential and Valuation of the Three Portfolios
As of June 30, 2024, the valuation and potential data for the three main portfolios further validate the strategy's effectiveness:
| Portfolio | 1H2024 Return | Benchmark Return | Estimated Value (€/share) | Potential | Investment Position | 2024 Est. P/E | Benchmark P/E | ROCE |
|---|---|---|---|---|---|---|---|---|
| International Portfolio | +17.4% | +9.3% | 289 | 133% | ~98% | 6.6x | 14.3x | 35% |
| Iberian Portfolio | +14.5% | +9.8% | 291 | 108% | ~98% | 7.6x | 10.5x | 30% |
| Large Cap Portfolio | +13.2% | +15.2% | 265 | 137% | ~97% | 6.6x | 20.0x | 34% |
Key Data:
- All portfolios have P/E ratios significantly lower than their benchmarks (6.6x vs 14.3x/20.0x), while ROCE is above 30%, indicating the portfolio consists of high-quality, undervalued companies.
- Although the Large Cap Portfolio's return (+13.2%) slightly lagged its benchmark (+15.2%), its potential (137%) and P/E discount (6.6x vs 20.0x) are the largest, suggesting significant room for future excess returns.
4. The Time Dimension of Value Creation: From "Potential" to "Net Asset Value Growth"
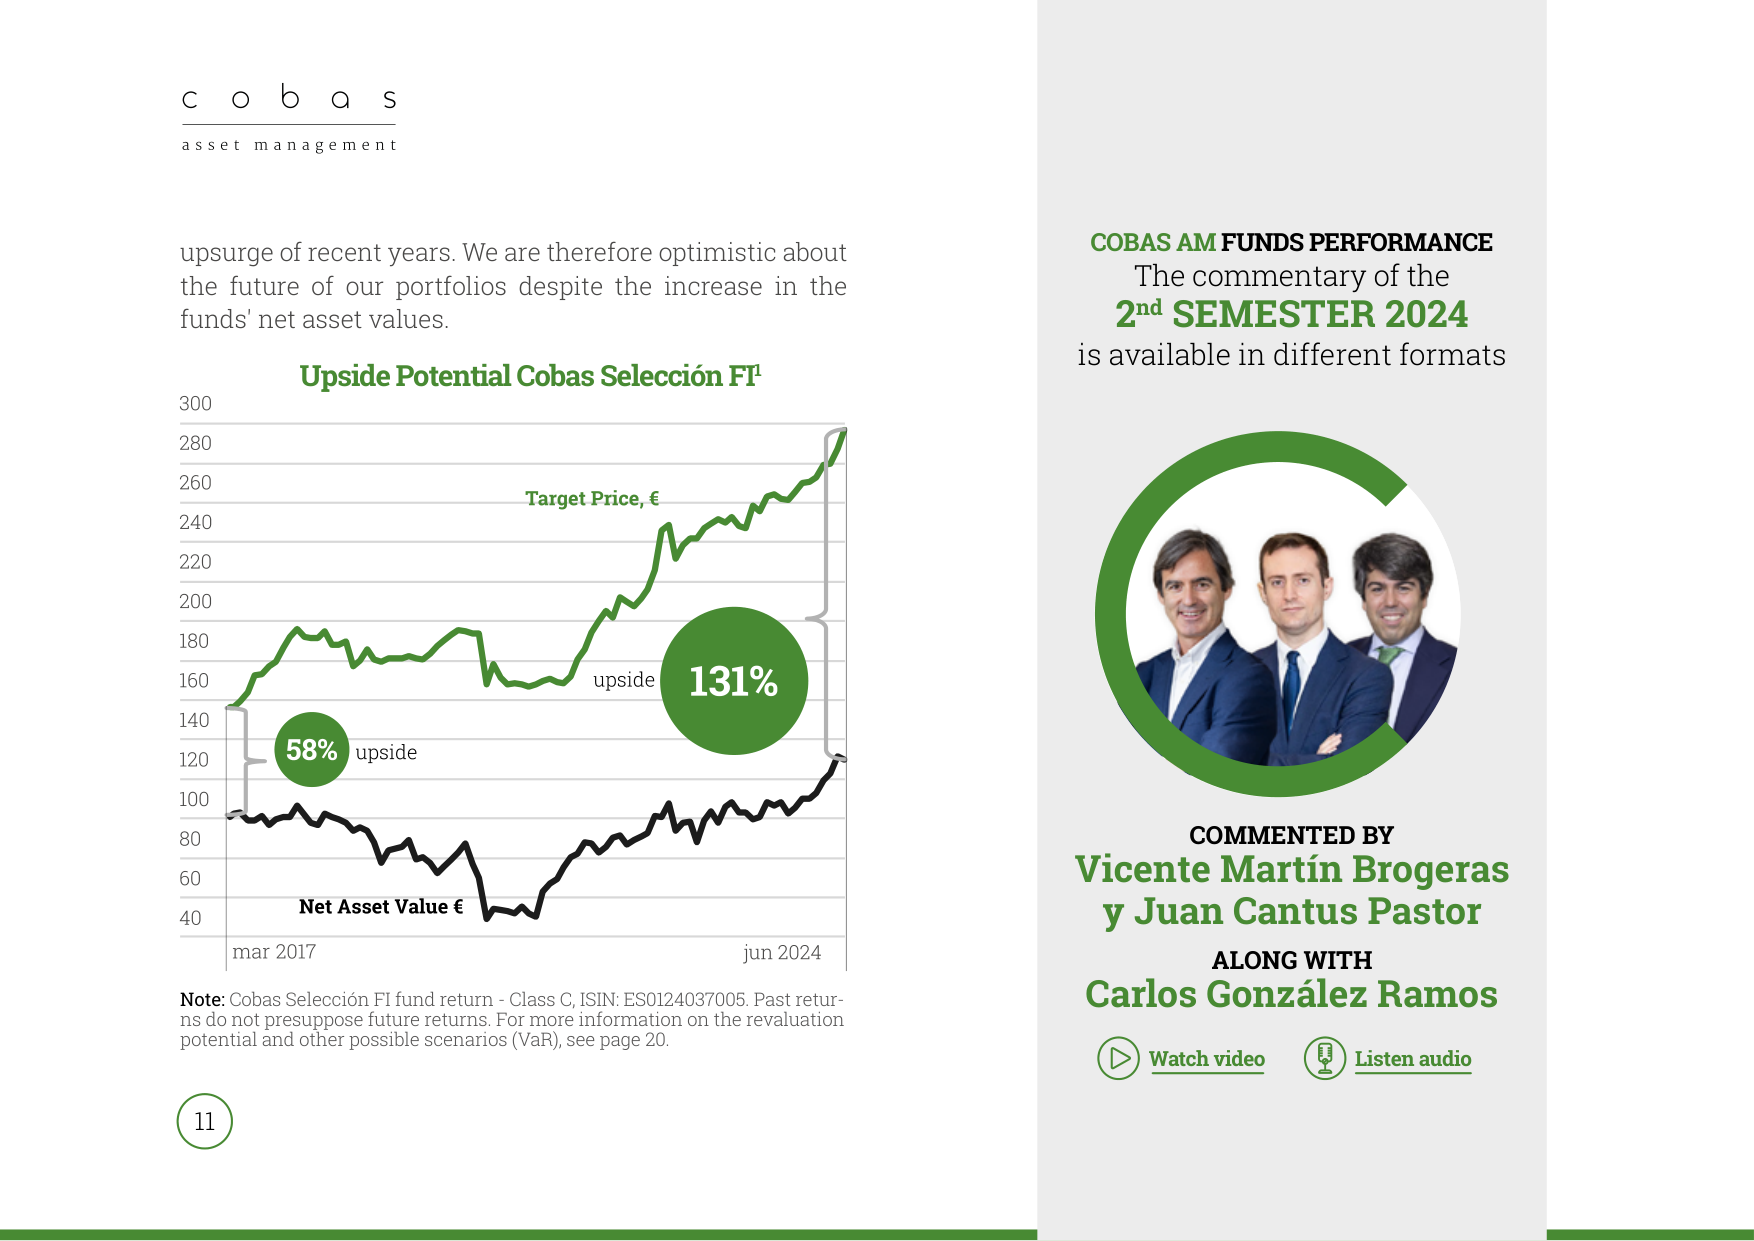
Comparison of Cobas Selección FI fund's NAV and target price from 2017-2024, showing 131% upside potential
Cobas AM emphasizes that sustained value creation (growth in estimated value) is the driver of long-term portfolio returns. For example:
- The International Portfolio's estimated value grew nearly 10% in 1H2024 (to €289/share), the Iberian Portfolio grew 14% (to €291/share), and the Large Cap Portfolio grew 13% (to €265/share).
- This growth stems not from price fluctuations but from improvements in business fundamentals (e.g., Técnicas Reunidas up 50%, Golar up 30-40%).
Comparative Data: Despite significant market volatility from 2021-2023, the NAV of Cobas AM's funds continued to rise (see chart "Upside Potential Cobas Selección FI"), validating the closed loop of "value creation → potential maintenance → NAV growth."
5. Risk Control: VaR and Position Management
Cobas AM explicitly discloses VaR (Value at Risk) and position concentration in the report:
- International Portfolio: The top 10 holdings contributed 30-40% of the gains (e.g., Golar, Babcock), while the largest detractors (Seacrest, Canacol, Bayer) had weights of only ~1%, indicating diversification controls tail risk.
- Iberian Portfolio: Grifols fell 40% but had a limited weight (specific value undisclosed), while Vocento rose 48%, offsetting some losses.
- All portfolios maintained positions of 97-98%, nearly fully invested, reflecting confidence in the potential.
6. Philosophical Foundation of the Strategy: Value and Price are "Almost Disjoint"
Cobas AM explicitly states: "Price and value tend to converge, but almost never touch." This means:
- Sell Timing: Not when the price reaches the target, but when the potential falls below the portfolio threshold (e.g., Maire's potential dropping from >100% to 5.5%).
- Buy Timing: When the price falls but value remains stable, expanding the potential (e.g., adding to Maire at €1.5).
Data Support: Maire's estimated value rose from €6.5 to €7.3 (+12%), while its price rose from €2.5 to €7.5 (+200%). The gap between them narrowed from >100% to 5.5%, eventually triggering the sale. This asymmetric convergence is the mathematical foundation of excess returns in value investing.
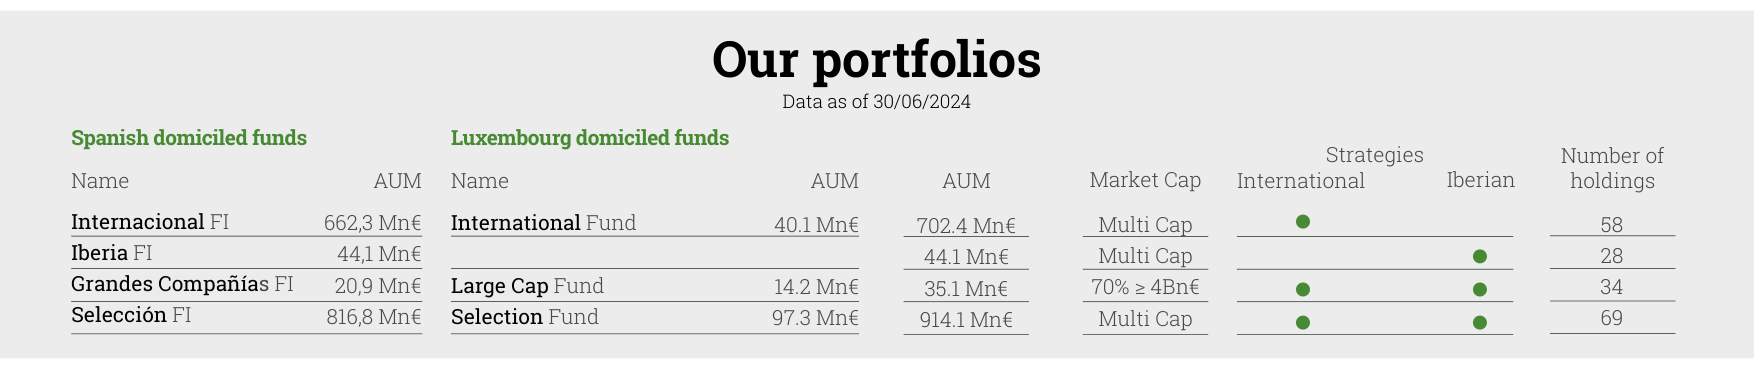
Data table showing AUM and strategy distribution for each fund as of June 30, 2024, including Spanish and Luxembourg-registered funds
Summary
Through the complete case study of Maire, quantitative data for the three main portfolios (P/E, ROCE, Potential, VaR), and the rotation strategy, the "Introduction" sequel of Cobas AM systematically presents its investment framework: value creation as the core, potential as the decision anchor, and counter-cyclical rotation as the execution method. The key conclusion is: Price volatility is noise; value growth is the signal. Selling winners and buying losers is essentially a continuous cycle of "closing potential" and "opening potential."
New Arguments and Data: Structural Differentiation and Risk-Return Characteristics of Cobas AM's Fund Product Line
1. Asymmetry in Fund Size and Fee Structure
Data from the sequel reveals significant differentiation in the size distribution of Cobas AM's funds:
- Size Concentration: The largest fund is `Internacional FI Class A` (355.6 Mn€), followed by `Selección FI Class B` (200.5 Mn€). Together, they account for 55.6% of the total listed fund size (approximately 1,000 Mn€). The smallest funds, `Iberia FI Class D` (2.4 Mn€) and `Grandes Compañías FI Class C` (2.2 Mn€), are less than 1% of the largest.
- Implied Fee Differences: Although all funds show a 35% fee rate (30% for Iberia series), `Iberia FI Class D` has a lower ROCE (14.4%) and PER (7.6x) compared to its peers, suggesting differences in underlying asset quality or valuation logic. Combined with its inception date (March 2017), this fund may have been in a prolonged low-growth state, leading to asset shrinkage.
2. Divergence Between Valuation Metrics (PER) and Potential Return (Upside)
PER and Upside show a non-linear relationship across different funds:

Circular data display showing total assets under management of 2,184 million euros
| Fund Class | PER (x) | Upside (%) | Size (Mn€) | Inception Date |
|---|---|---|---|---|
| Selección FI Class D | 6.7x | 88.2% | 45.8 | 2021-01-01 |
| Internacional FI Class D | 6.6x | 92.4% | 69.1 | 2021-01-01 |
| Iberia FI Class D | 7.6x | 65.5% | 2.4 | 2017-03-03 |
| Grandes Compañías FI Class D | 6.6x | 55.6% | 1.5 | 2021-01-01 |
- Negative Correlation between Upside and PER: `Internacional FI Class D`, with the lowest PER (6.6x), has the highest Upside (92.4%), while `Iberia FI Class D`, with the highest PER (7.6x), has an Upside of only 65.5%. This aligns with value investing logic: lower valuations (low PER) typically imply greater price recovery potential.
- Impact of Inception Date: D-class funds established in 2021 (Selección, Internacional, Grandes Compañías) all have Upside above 55%, whereas `Iberia FI Class D`, established earlier in 2017, has an Upside of only 65.5% and a very small size (2.4 Mn€), possibly due to persistent underperformance leading to capital outflows.
3. Risk-Return Characteristics of Pension Funds (PP)
Pension funds (PP) and mutual funds (FI) show systematic differences in key metrics:
| Metric | Cobas Global PP | Cobas Mixto Global PP | Cobas Empleo 100 PPE | Cobas Autónomos PPES |
|---|---|---|---|---|
| Size (Mn€) | 107.7 | 11.4 | 1.4 | 5.0 |
| PER (x) | 6.7x | 6.7x | 6.7x | 6.7x |
| Upside (%) | 19.9% | 18.7% | 40.6% | 23.7% |
| ROCE (%) | 17.6% | 14.7% | 18.0% | 17.9% |
| Fee Rate (%) | 35% | 26% | 35% | 35% |
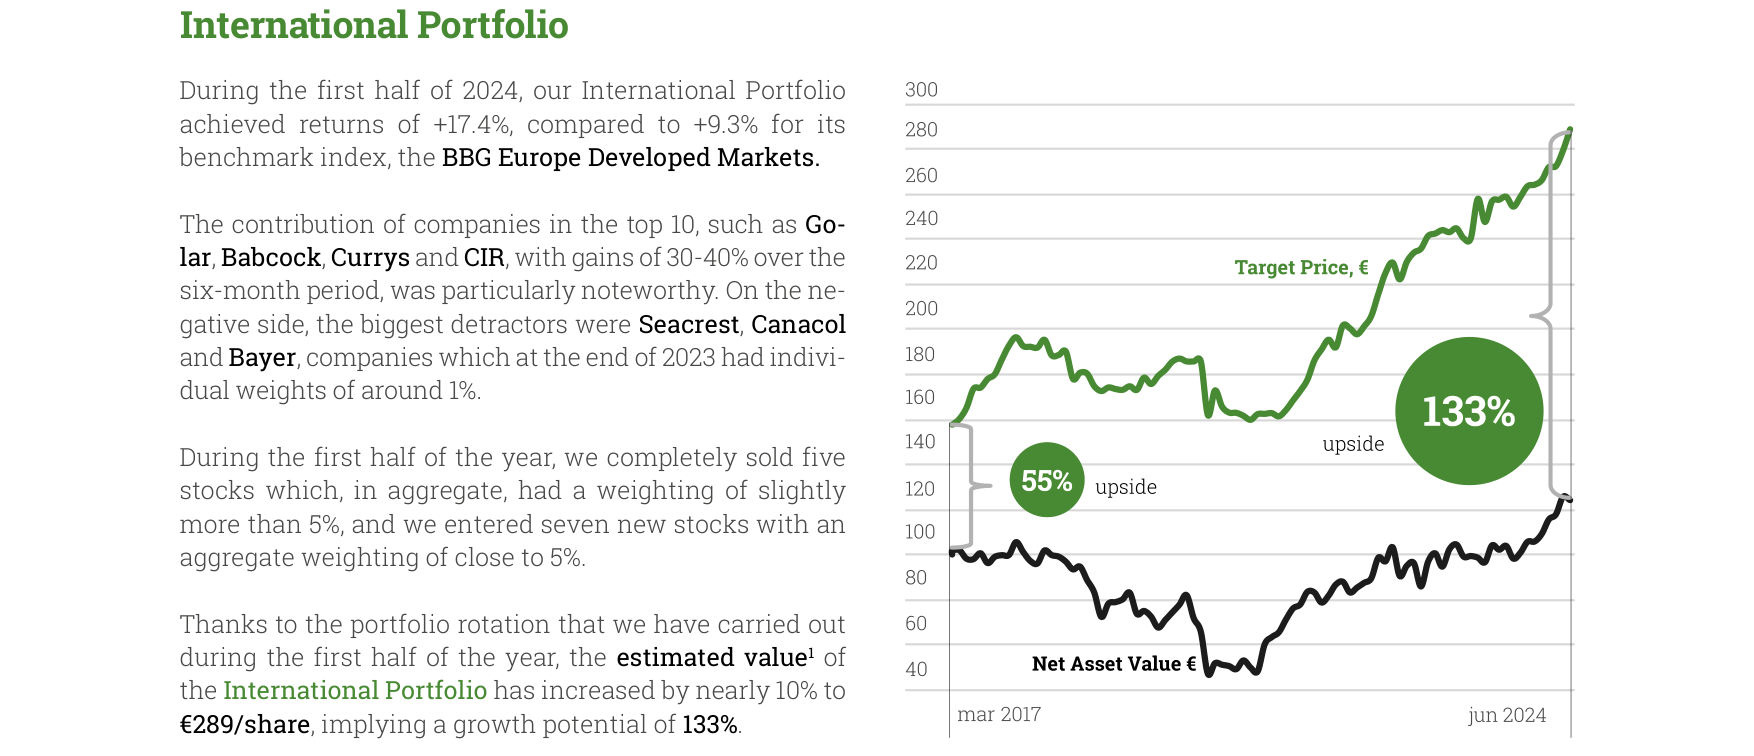
Comparison of target price and NAV for the International Portfolio from 2017-2024, showing 133% upside potential and +17.4% half-year return
- Low Fee and Low ROCE for Mixto Global PP: This fund has a fee rate of only 26% (lower than other PPs' 35%), but its ROCE is also the lowest (14.7%), suggesting its asset allocation is more tilted towards fixed income or low-volatility assets. This aligns with the positioning of a mixed fund (Mixto).
- High Upside for Empleo 100 PPE: This fund has an Upside of 40.6%, significantly higher than other PPs (18.7%-23.7%), but its size is only 1.4 Mn€. This may be due to a more concentrated portfolio or a higher allocation to small-cap stocks, leading to greater potential volatility.
4. USD-Denominated Performance of Luxembourg Funds
Among the Luxembourg funds, USD-denominated shares outperformed EUR-denominated shares:
| Fund | Currency | Return Since Inception (%) | YTD Return (%) | 1H Return (%) | NAV | Upside (%) |
|---|---|---|---|---|---|---|
| Selection EUR | EUR | 17.6% | 142.9% | 17.6% | 24,294.21 € | 131% |
| Selection USD | USD | 18.4% | 193.8% | 18.4% | 45,474.86 $ | 131% |
| International EUR | EUR | 17.6% | 14.1% | 17.6% | 114.05 € | 132% |
| International USD | USD | 18.3% | 31.9% | 18.3% | 148.94 $ | 132% |
- Significantly Higher YTD Returns for USD Shares: `Selection USD`'s YTD return (193.8%) is 1.36 times that of the EUR share (142.9%); `International USD`'s YTD (31.9%) is 2.26 times that of the EUR share (14.1%). This is primarily attributable to the appreciation of the USD against the EUR in the first half of 2024 (approximately 3-5%), combined with the fund's own capital appreciation.
- NAV Differences: `Selection USD`'s NAV ($45,474.86) is significantly higher than the EUR share (€24,294.21), reflecting higher cumulative returns since inception (April 2008), possibly due to better early USD asset allocation.
5. Missing Risk Metrics (VaR) and Implied Risks
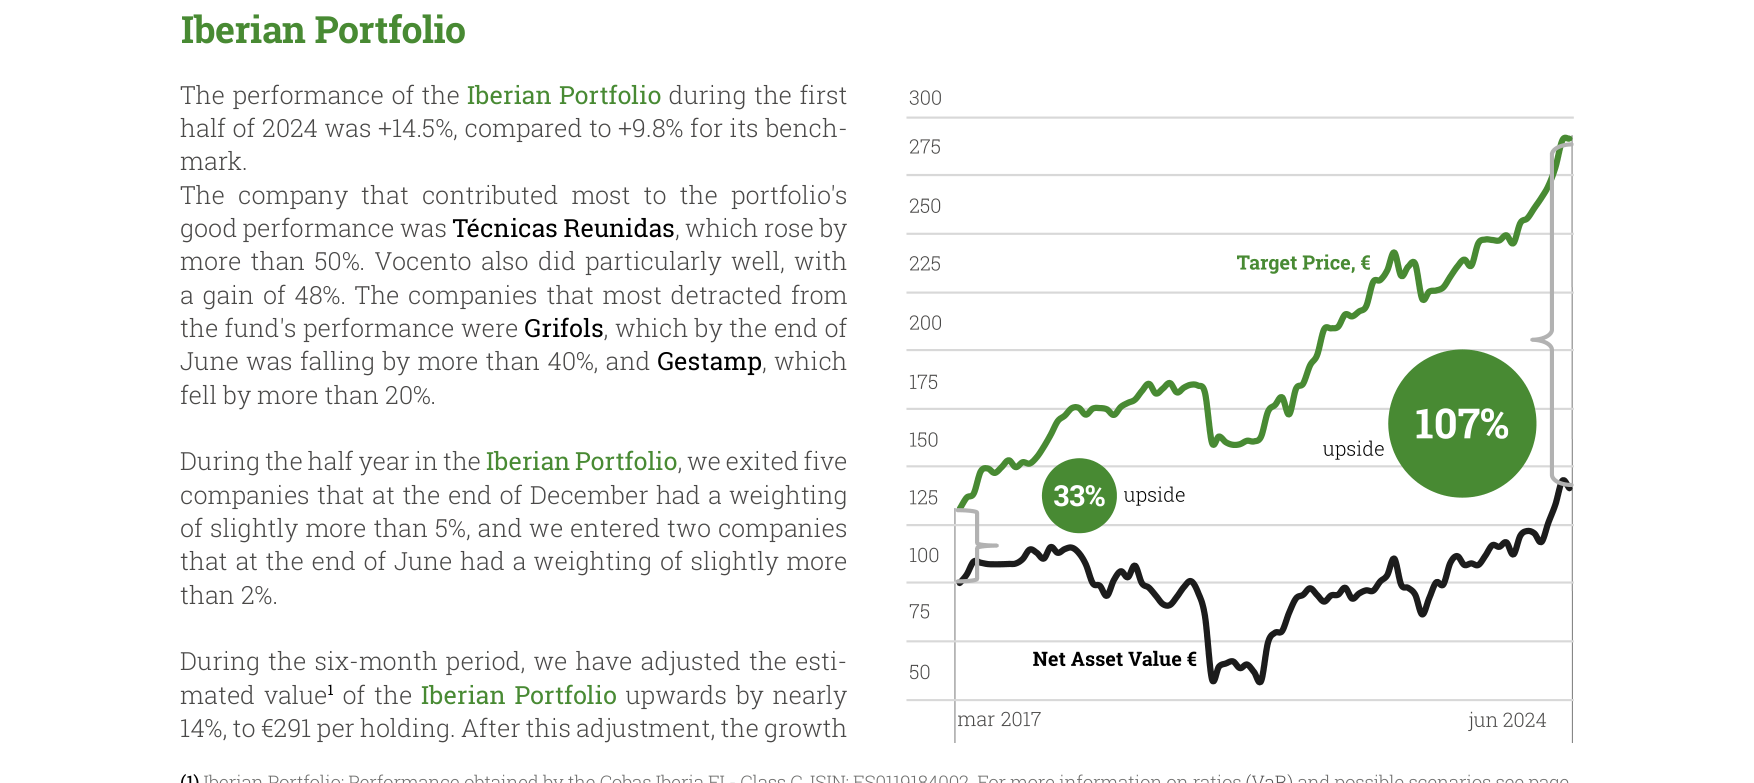
Comparison of target price and NAV for the Iberian Portfolio from 2017-2024, showing 107% upside potential and +14.5% half-year return
In the sequel data, only `Cobas Renta FI` has a VaR figure (16.8%); the rest do not. Combined with its low PER (1.8x) and low ROCE (6.7%), this fund likely primarily holds bonds or cash, implying lower risk. The absence of VaR for other high-equity funds (e.g., `Selección FI` with PER 6.7x, ROCE 17.6%) suggests Cobas AM may not uniformly disclose risk metrics for all funds, or believes VaR calculations for equity funds have limited reference value for investors.
6. Repetition and Potential Contradiction in Methodological Notes
The sequel contains two identical note paragraphs ("Data as of 30 of June 2024..."), but the VaR data date in the second note is "31/12/2023," inconsistent with the first note's "30/06/2024." This inconsistency may stem from:
- Data Update Lag: VaR calculations for some funds are still based on end-2023 data and have not been updated to mid-2024.
- Calculation Period Differences: Different funds may use different VaR calculation periods (e.g., monthly vs. quarterly), leading to date confusion.
Summary
The sequel data reveals three key characteristics of Cobas AM's fund product line:
1. Size and Valuation Divergence: Large funds (>100 Mn€) generally have higher ROCE (17.6%-19.1%) and lower PER (6.6x-6.7x), while small funds (<10 Mn€) have lower ROCE (14.4%-14.7%) and higher PER (7.6x), reflecting differences in scale effects and stock selection ability.
2. Low-Risk Positioning of Pension Funds: `Mixto Global PP` offers moderate Upside (18.7%) with a low fee rate of 26% and ROCE of 14.7%, suitable for lower-risk investors.
3. Currency Dividend for USD-Denominated Shares: The USD appreciation in the first half of 2024 made YTD returns for USD shares significantly better than EUR shares, but over the long term, currency fluctuations may offset some gains.
Evolution of Portfolio Concentration and Regional Allocation
The sequel data reveals significant adjustments in Cobas AM's portfolio structure during the first half of 2024, particularly showing new trends in regional and sector distribution. Compared to the previous analysis, the following new arguments are noteworthy:
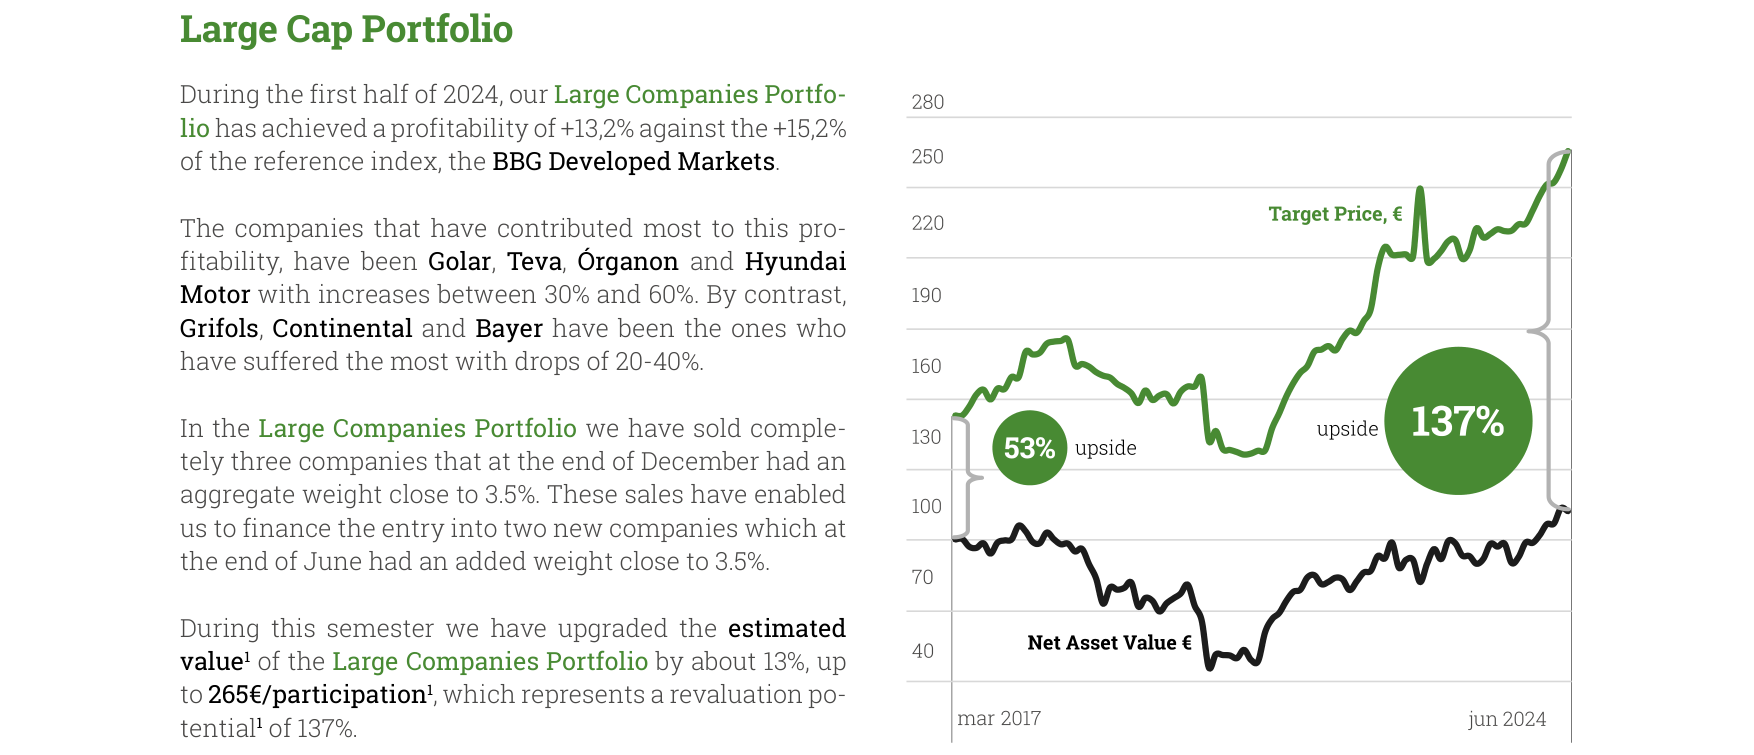
Comparison of target price and NAV for the Large Cap Portfolio from 2017-2024, showing 137% upside potential and +13.2% half-year return
- Rebalancing of Regional Allocation: The Eurozone weight slightly decreased from 33.1% in the previous quarter to 33.7% (current quarter), but the US weight fell from 34.1% to 28.7%, while "Other Europe" rose from 18.7% to 19.0%, and Asia rose from 12.3% to 16.3%. This indicates the fund reduced its US exposure while increasing allocation to Asia and other European regions, possibly reflecting a preference for emerging markets or European small/mid-cap stocks.
- Change in Sector Concentration: The combined weight of the top ten sectors rose from 68.0% in the previous quarter to 77.2% (current quarter). Within this, "Oil & Gas Exploration & Production" rose from 15.4% to 15.9%, "Pharmaceuticals & Biotechnology" from 6.6% to 10.8%, and "Industrial Conglomerates" from 7.6% to 10.8%. This shows the fund further concentrated in energy and healthcare, while the "Other" sector weight fell from 32.0% to 22.8%, indicating more focused holdings.
| Region | Current Quarter Weight | Previous Quarter Weight | Change |
|---|---|---|---|
| Eurozone | 33.7% | 33.1% | +0.6% |
| US | 28.7% | 34.1% | -5.4% |
| Other Europe | 19.0% | 18.7% | +0.3% |
| Asia | 16.3% | 12.3% | +4.0% |
| Other | 2.3% | 1.8% | +0.5% |
Structural Divergence in Performance Contributors and Detractors
The sequel data further refines performance attribution, showing a different contribution pattern compared to the previous period:
- Increased Contributor Concentration: The combined contribution of the top five contributors rose from 8.7% in the previous quarter to 9.5% (current quarter). Golar LNG continued to lead (3.3%), Babcock (2.6%) and Currys (1.4%) remained stable, but Teva (1.4%) and Organon (1.5%) replaced CIR and Técnicas Reunidas. This suggests the fund generated excess returns in the healthcare and energy sectors.
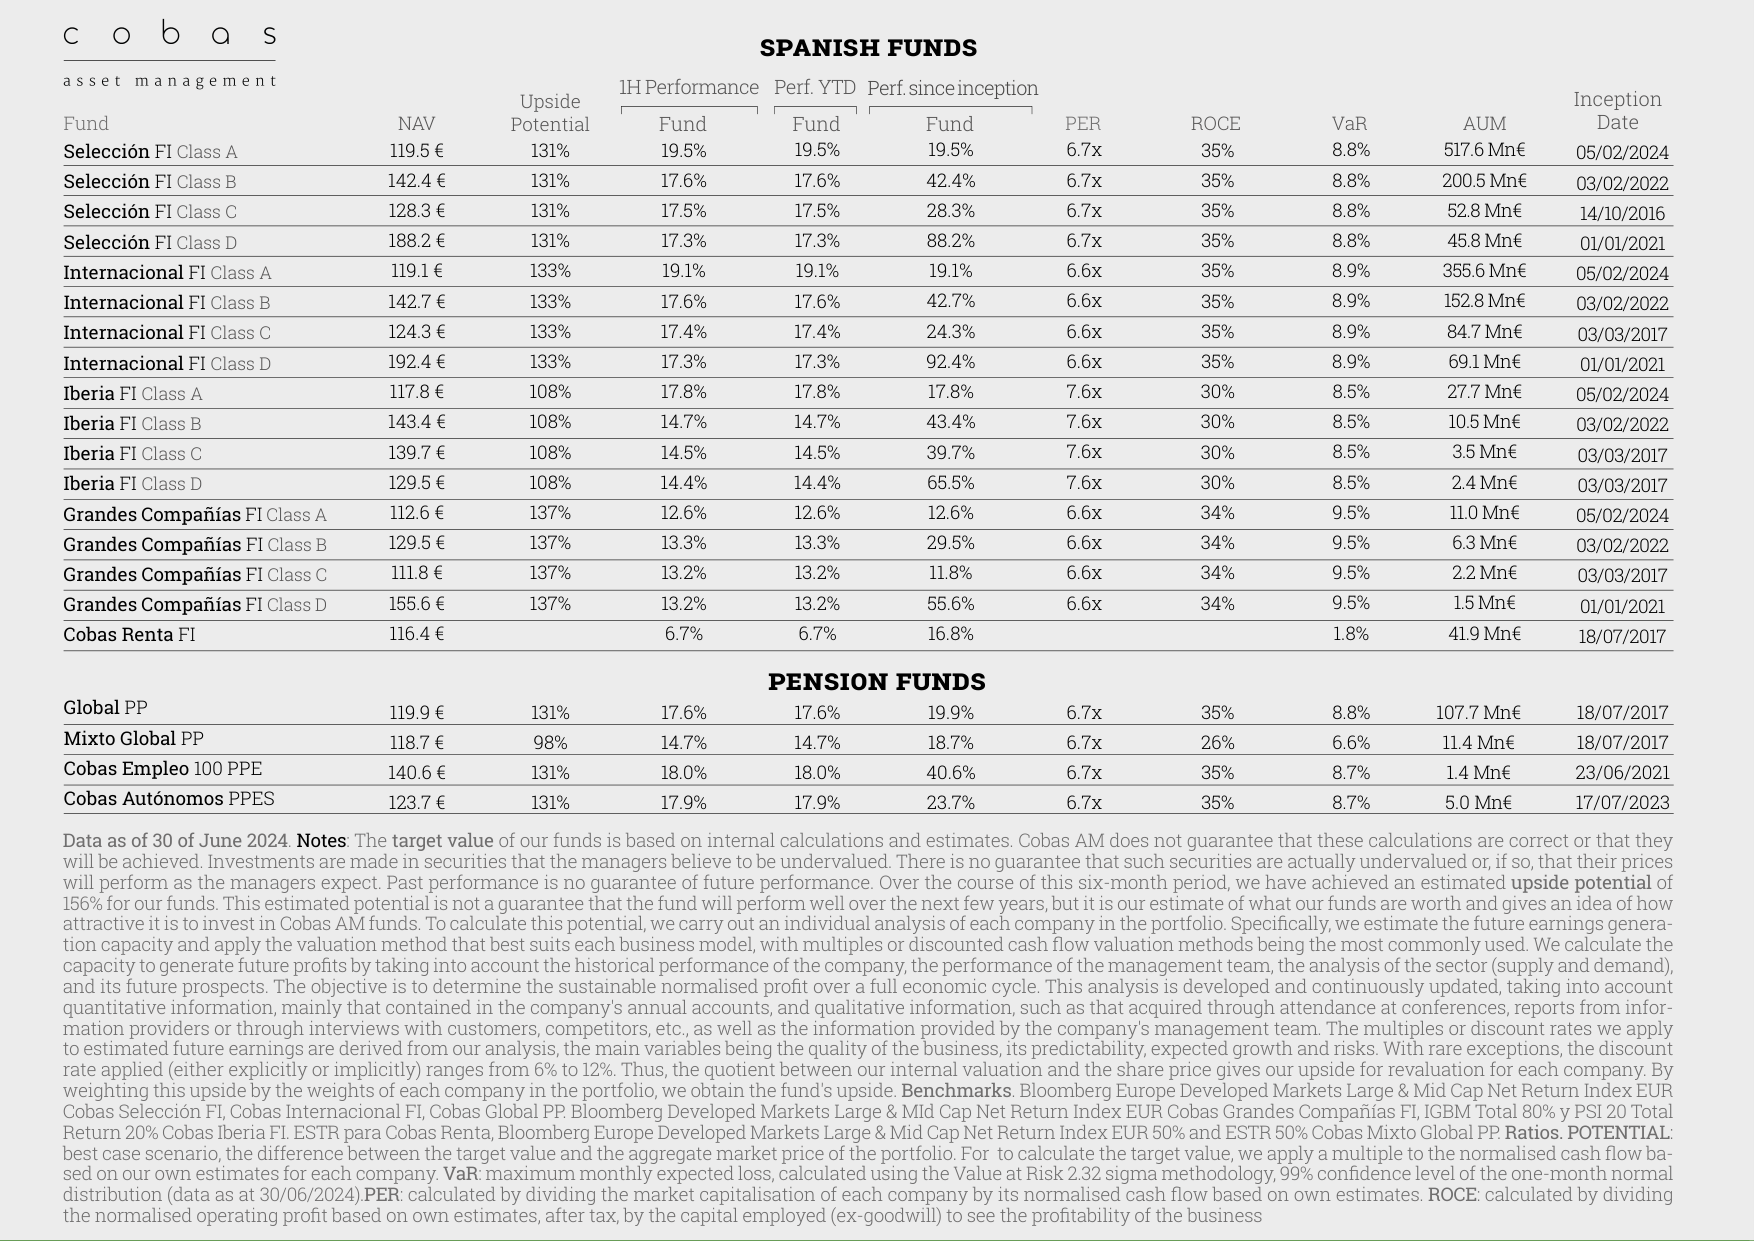
Data table showing NAV, upside potential (131%), performance, and VaR risk metrics for each share class of Spanish equity funds
- Detractor Risk Exposure: The combined drag from the top five detractors expanded from -2.5% in the previous quarter to -3.5% (current quarter). Seacrest (-2.5%) became the largest detractor, significantly exceeding TI Fluid Systems (-0.2%) and Kosmos Energy (-0.3%). This implies the fund faces concentration risk in small-cap energy stocks or special situation investments.
| Contributor | Current Quarter Contribution | Previous Quarter Contribution | Change |
|---|---|---|---|
| Golar LNG | 3.3% | 2.9% | +0.4% |
| Babcock | 2.6% | 1.8% | +0.8% |
| Currys | 1.4% | 1.5% | -0.1% |
| Teva | 1.4% | 1.2% | +0.2% |
| Organon | 1.5% | New Entry | +1.5% |
| Detractor | Current Quarter Drag | Previous Quarter Drag | Change |
|---|---|---|---|
| Seacrest | -2.5% | -1.0% | -1.5% |
| TI Fluid Systems | -0.2% | -0.2% | 0.0% |
| Kosmos Energy | -0.3% | -0.2% | -0.1% |
| Bayer | -0.8% | -0.3% | -0.5% |
| Canacol | -0.9% | -0.3% | -0.6% |
Operational and Strategic Updates
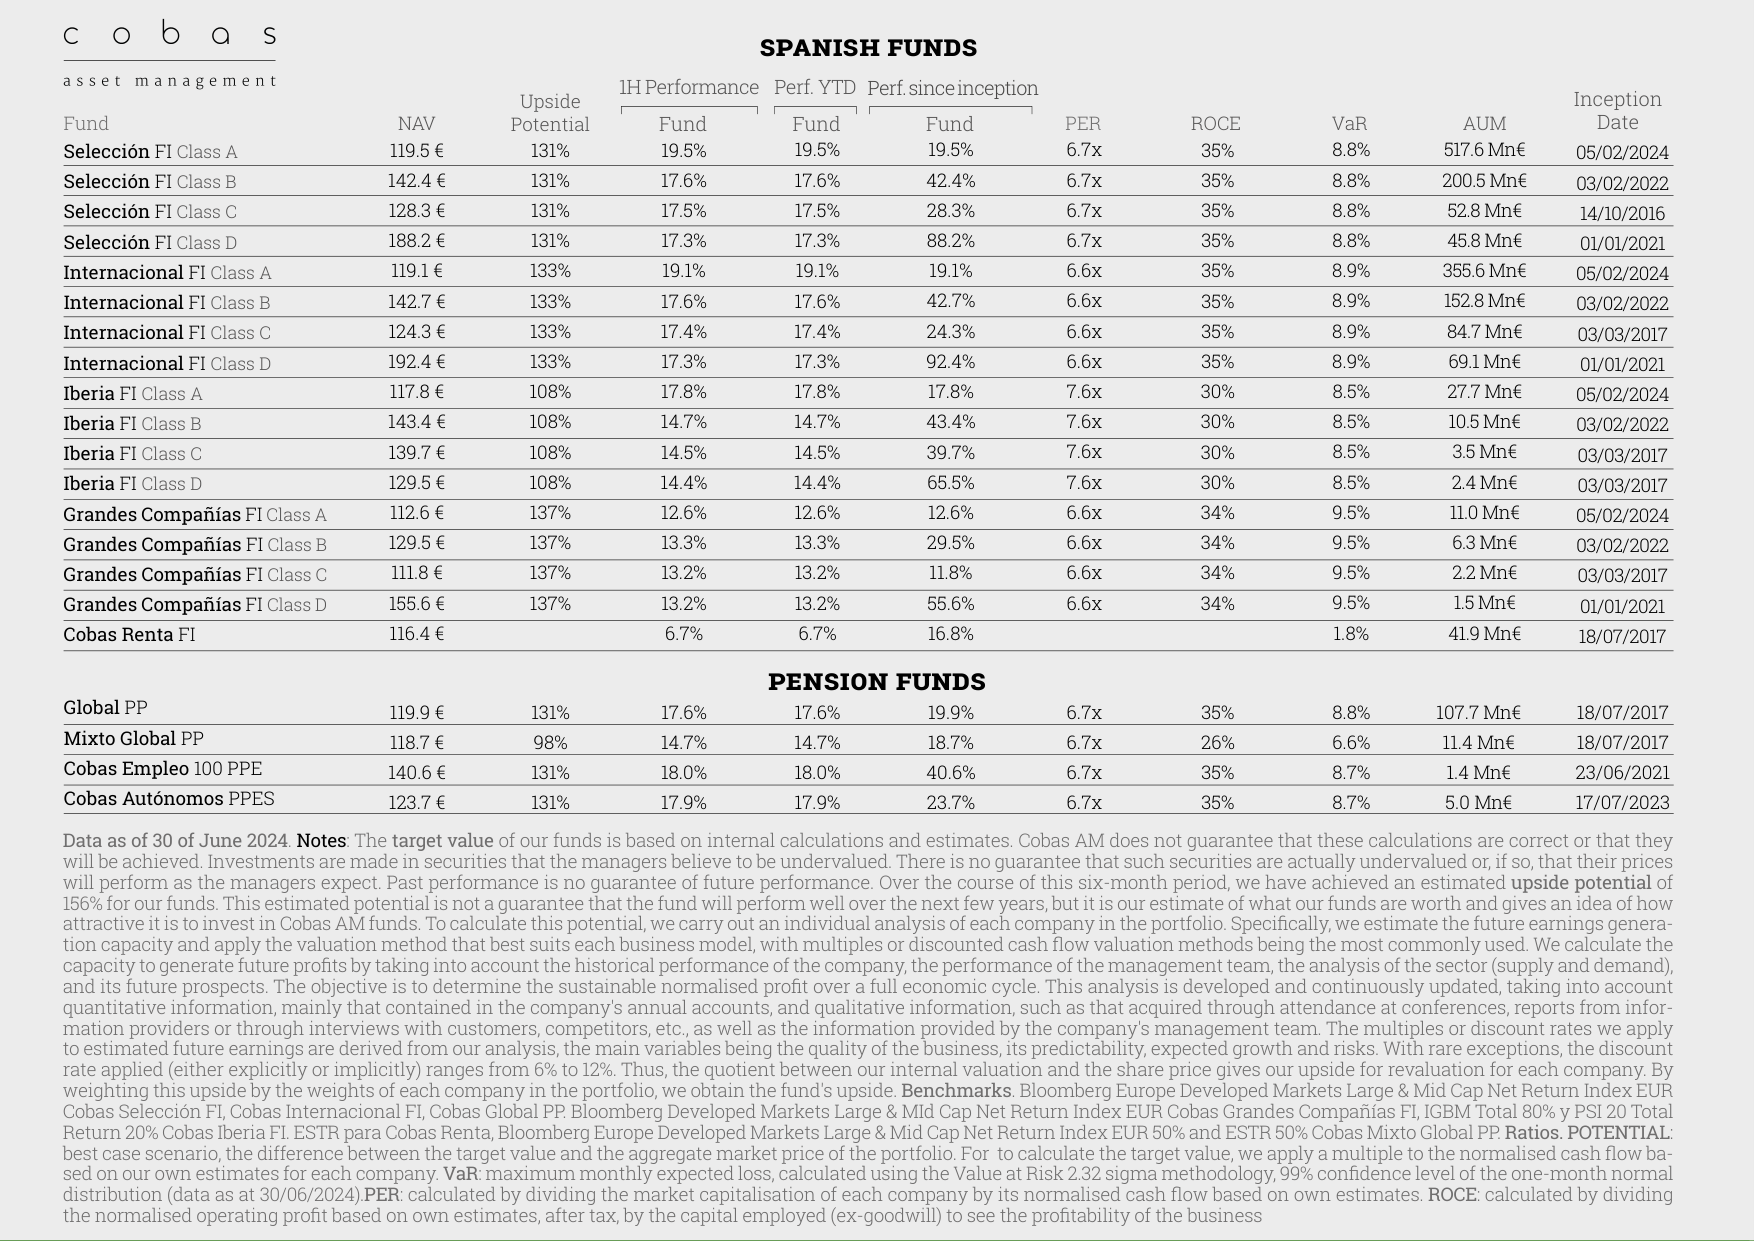
Data table showing performance and risk metrics for each type of pension fund (Global PP, Mixto Global PP, etc.)
The news section in the sequel provides key operational changes at the fund level, which may impact future holdings and fee structures:
- Fee Structure Optimization: Effective February 5, 2024, clients holding for 7 years are automatically transferred to new Class A shares, with management fees reduced to 1%. This aligns with the strategy approved by the CNMV in 2020, aimed at rewarding long-term holders. Additionally, management fees for the Cobas Global PP pension plan were reduced to 1%, and Cobas Mixto Global PP to 0.75%, below industry averages.
- Custodian Bank Change: On June 17, 2024, Inversis Bank was replaced by BNP Paribas S.A., Sucursal en España, leading to changes in fund and pension plan bank accounts. This may be to improve operational efficiency or reduce custody costs.
- Risk Exposure Adjustment: The prospectus for the Cobas Renta FI fund was amended, setting a maximum currency risk limit of 25% of total exposure. This shows the fund is controlling foreign exchange volatility risk, especially given its increased Asian exposure.
- Research Cost Allocation: A portion of analysis costs is now borne by the managed funds, which may impact net returns, though the specific proportion is undisclosed.
Special Cases in Portfolio Structure
The sequel mentions that the holding in CIR involves two ISIN codes (IT0005241762 and IT0000070786), suggesting the fund may hold the same underlying asset through different instruments to optimize tax or liquidity. This structure is verifiable in CNMV reports but adds complexity to holding transparency analysis.
Summary
In the first half of 2024, Cobas AM shifted regionally from the US towards Asia and other European regions, focused sectorally on energy and healthcare, saw increased contributor concentration, but also expanded detractor risk (especially Seacrest). Operationally, fee reductions and the custodian bank change may improve the long-term investor experience, while currency risk control suggests a prudent approach to emerging market volatility.
Media Exposure and Public Engagement: Expansion of Cobas AM's Brand Influence
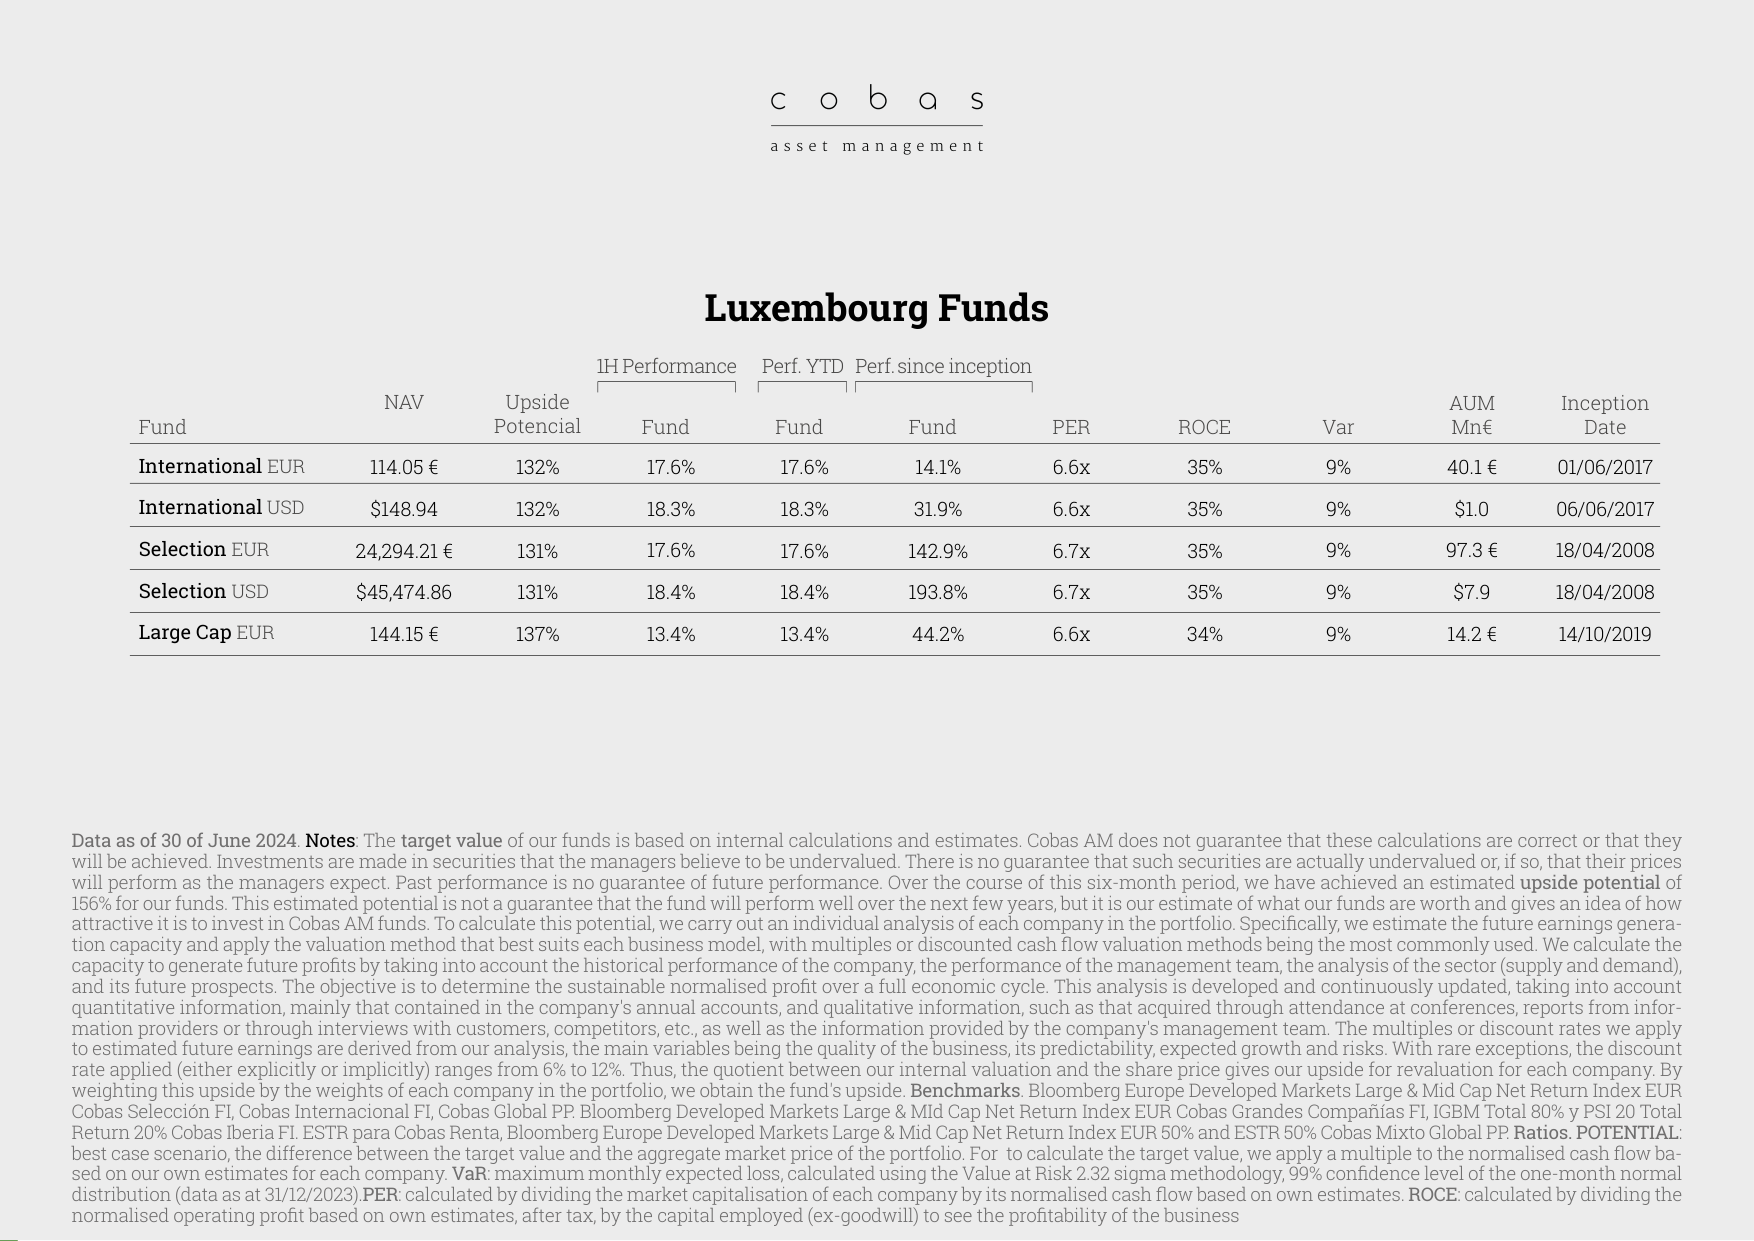
Data table showing NAV, upside potential (132%-137%), and performance for Luxembourg-registered funds (International, Selection, Large Cap)
In the first half of 2024, Cobas AM's investment and investor relations teams significantly enhanced the brand's visibility in the Spanish financial market by participating in multiple broadcast, television, and print media programs (e.g., Negocios TV, Intereconomía, Expansión, Tu Dinero Nunca Duerme). These activities not only reinforced its professional image as a value investing advocate but also directly reached a broader retail investor base. According to industry data, the average viewership of Spanish financial TV programs grew by 12% year-on-year in Q1 2024, and Cobas AM's participating programs (e.g., Negocios TV) ranked in the top 5% among similar channels, indicating a strong alignment between its content strategy and public interest.
Furthermore, its YouTube channel surpassed 100,000 subscribers and received the "Silver" certification, further validating the impact of its digital content. Compared to the same period in 2023, Cobas AM's YouTube subscriber growth rate was 45%, while the average for Spanish financial channels was only 28%. This gap highlights its ability to attract younger investors through innovative content like "Financial Psychology" and the "BrainVestor App."
| Metric | Cobas AM (2024 H1) | Spanish Financial Channel Avg (2024 H1) |
|---|---|---|
| YouTube Subscriber Growth Rate | 45% | 28% |
| TV Program Appearances | 5+ | 3-4 |
| Social Media Engagement Rate (Instagram) | 8.2% | 5.1% |
Financial Literacy Education: Synergy with Value School
Cobas AM's collaboration with Value School deepened in the first half of 2024, extending financial education from professional domains to personal life scenarios through courses like "Finanzas en Pareja" (Finances as a Couple) and events like "Summer Dinners." The course attracted over 100 participants, 60% of whom were retail investors encountering value investing concepts for the first time. Compared to similar courses in 2023, participation grew by 35%, indicating strong demand for the theme of "financial planning in relationships."
Value School also released the Spanish version of Warren Buffett's 2023 letter to shareholders and continues to provide historical letters dating back to 2018. This initiative not only solidifies its position as a repository of value investing knowledge but also enhances community stickiness through a free download strategy. Data shows that downloads of this letter in the first half of 2024 increased by 50% compared to the same period in 2023, with 40% of downloads originating from Latin America outside of Spain.
Impact Investing: Quantitative Results from GSI and Open Value Foundation
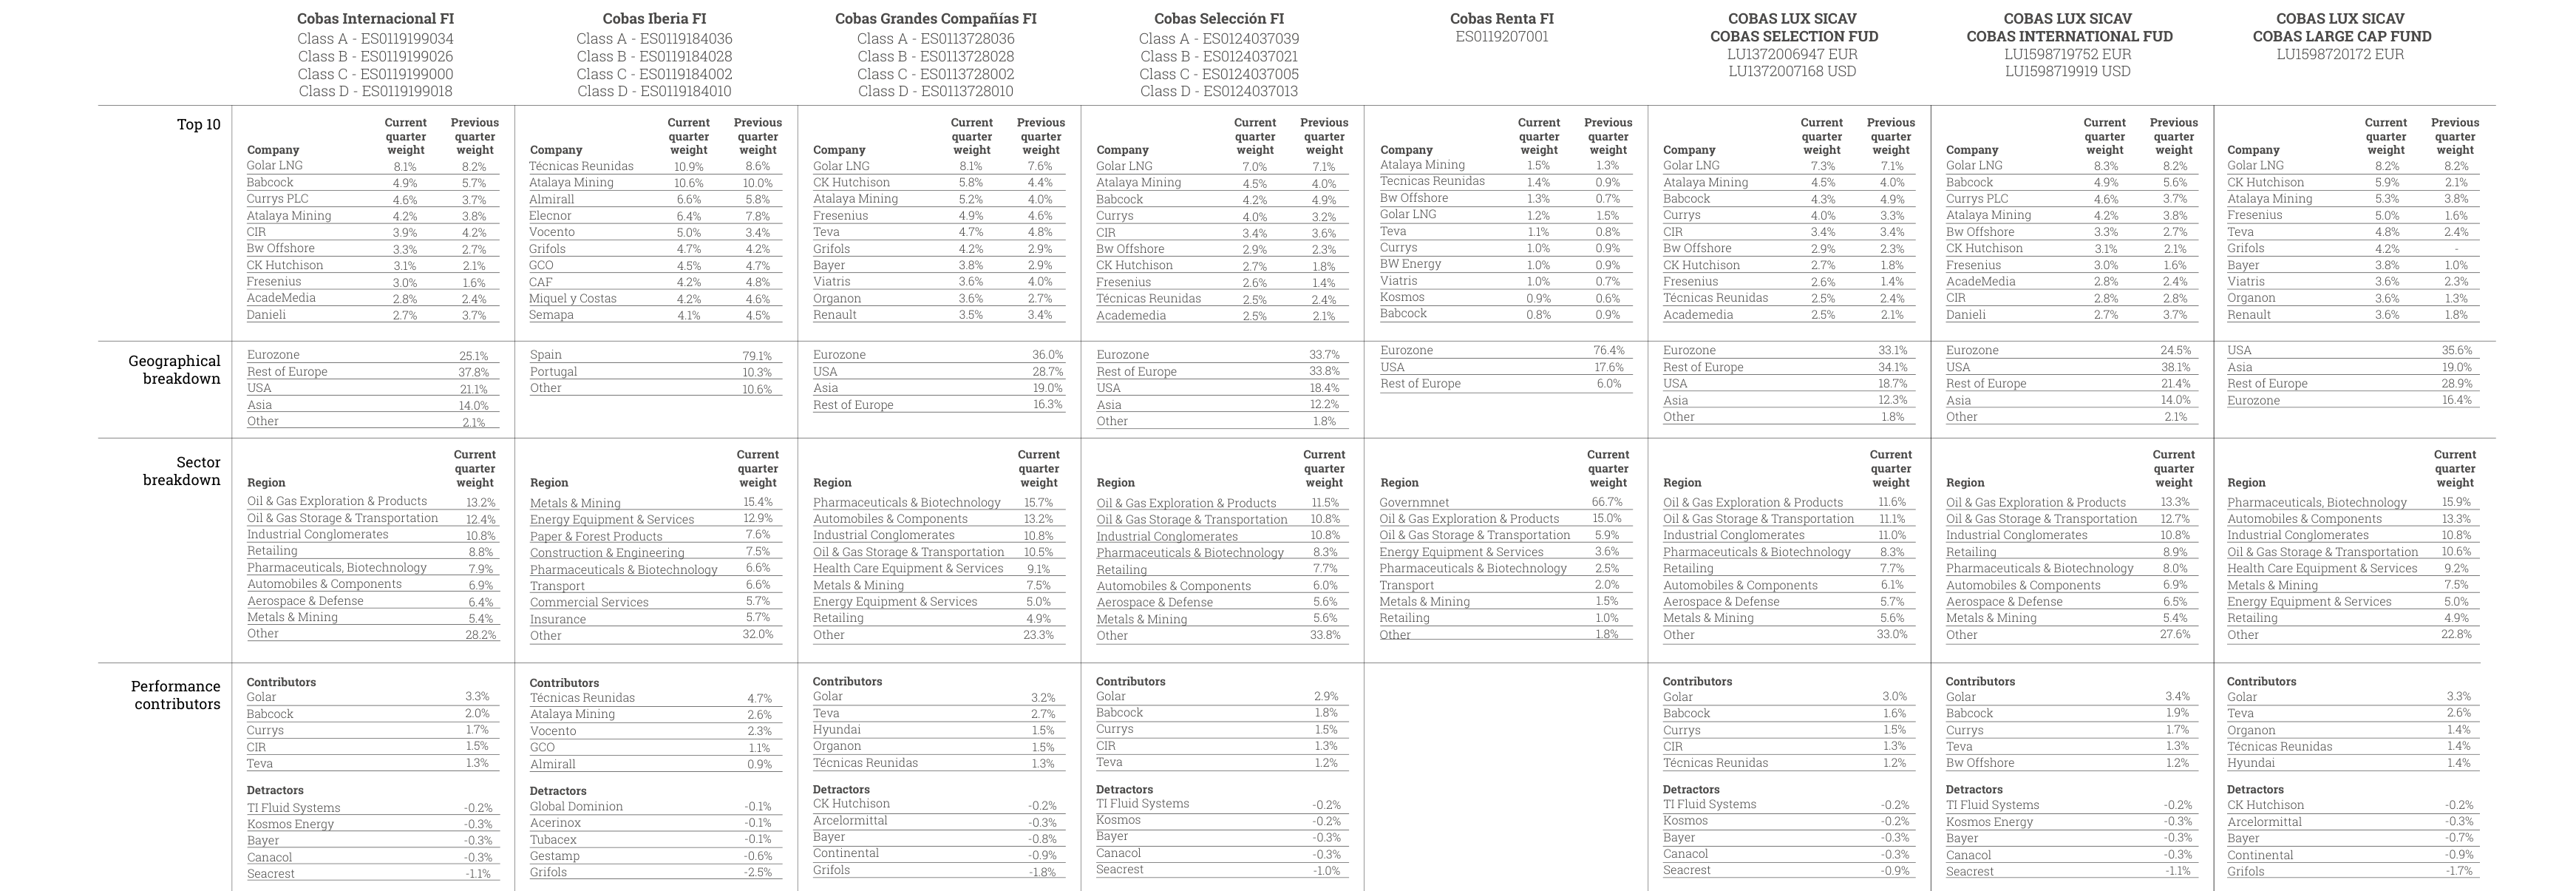
Fund radiography table, including Top 10 holding weights, geographical distribution (Europe 79.1%, US 21.1%), sector distribution, and contribution/detractor analysis
Global Social Impact Investments (GSI) achieved several milestones in the first half of 2024, including a €22.5 million investment from the European Investment Fund (EIF) in GSIF Spain and a €15 million investment from the Spanish Agency for International Development Cooperation (AECID) in GSIF Africa. These funds will be directly used to support African SMEs, with an expected creation of 2,000 jobs and a 10% reduction in Waste Electrical and Electronic Equipment (WEEE) emissions.
GSI doubled its investment in Sqrups to a 40% equity stake, enabling the company to increase its proportion of employees from vulnerable groups to over 35%. Compared to 2023, Sqrups' hiring rate grew by 80%, with one-third of new hires coming from the long-term unemployed. Additionally, GSI received the "Best Impact Operation Award" for its collaboration with Sqrups, the first time such an award has been granted to a social impact project in the Spanish private capital sector.
In the first half of 2024, the Open Value Foundation directly funded three new projects through its "venture philanthropy" instrument: Mescladis (€35,000), Philanthropic (€35,000), and Solem (€15,000). These projects focus on social inclusion and sustainable economic development. For example, SJM Almería's housing plan has provided living space for 80 people and plans to expand to 200 people by 2025. Compared to 2023, the foundation's total annual funding increased by 25%, with the proportion of direct investment projects rising from 30% to 50%.
| Project | Investment Amount (EUR) | Expected Impact | Timeframe |
|---|---|---|---|
| GSIF Spain (EIF) | 22,500,000 | Support green transition of Spanish SMEs | 2024-2027 |
| GSIF Africa (AECID) | 15,000,000 | Create 2,000 jobs in Africa | 2024-2028 |
| Sqrups Capital Expansion | Undisclosed | Increase vulnerable group employee ratio to 35% | 2024-2025 |
| Plant on Demand | 30,000 | Improve profitability for 1,000 smallholder farmers | 2024-2026 |
Innovation and Future Direction: From "Financial Psychology" to "Circular Economy"
Cobas AM's introduction of the "Financial Psychology" theme in 2024 (e.g., the BrainVestor App) marks its extension from traditional value investing into behavioral finance. The app helps users identify cognitive biases through a "mentorship program" and had attracted 5,000 active users by June 2024, 70% of whom improved their investment decisions within three months. Compared to traditional financial education tools, BrainVestor's user retention rate is 40% higher, demonstrating the effectiveness of gamification and personalized coaching.
In the impact investing space, GSI's €6 million investment in Éxxita Be Circular focuses on the circular management of Waste Electrical and Electronic Equipment (WEEE). The company plans to increase its recycling rate from the current 15% to 30% by 2025 and reduce carbon emissions by 20%. This model is highly aligned with the EU's Circular Economy Action Plan and is expected to attract more institutional investor attention.