Comments on Fourth Quarter 2020
Cobas Asset Management is a Madrid deep-value firm founded in late 2016 by Francisco García Paramés, Europe's standard-bearer of value investing after 25+ years running Bestinver and author of "Investing for the Long Term". Cobas applies a strict Graham/Buffett value framework overlaid with Austrian business-cycle theory, concentrating in unloved energy, shipping and other cyclicals, with AUM above €3.4bn. Its investor letters are fully archived from Q1 2017, moving to a semi-annual cadence in 2022.
In plain words
This report covers Cobas fund's performance in Q4 2020. After vaccine news boosted markets, the fund says its holdings (like mining company Atalaya Mining and shipping firm Wilhelmsen) still trade at very low prices—price-to-earnings ratios of 7-8x, far below the market's 17-20x. That suggests these stocks might be undervalued. The fund also changed its fee structure to reward long-term holders. For regular investors, this highlights that some value stocks could still have upside after the rally, but it's worth noting this strategy has struggled in recent years and requires patience.
Cobas' Q4 2020 report notes that despite the market rebound driven by vaccine news, its funds are still trading at 7–8 times earnings, far below the market's 17–20 times. The funds performed strongly: Cobas Internacional rose 26.9% (benchmark +10.8%), Cobas Iberia rose 26.5% (benchmark +22.9%), and
Theme and Background
This chapter is the opening of Cobas's Q4 2020 report, discussing the recovery prospects for value investing strategies following the market rebound driven by vaccine news. The author emphasizes that despite the overall market rally, the fund's holdings still trade at significant discounts and thanks holders for their long-term support.
Core Views
- Vaccines serve as a catalyst for normalizing market assessments, but many companies remain undervalued, and value investing is once again outperforming growth investing.
- Rising inflation expectations will benefit value stocks, as the market will focus more on real earnings rather than long-term dreams.
- Cobas adjusted its management fee structure to reward long-term holders, reflecting a commitment to long-term investment philosophy.
Key Arguments and Data
- The fund's holdings have a P/E ratio of 7-8x, far below the market's 17-20x, indicating a significant discount.
- In Q4, the fund significantly outperformed its benchmarks:
- Cobas Internacional: +26.9% (benchmark +10.8%)
- Cobas Iberia: +26.5% (benchmark +22.9%)
- Cobas Grandes Compañías: +34.5% (benchmark +9.2%)
- The international portfolio has an overall P/E of 7.0x (benchmark 17.1x) and an ROCE of 27% (38% excluding shipping and commodity companies).
- The target price for the international portfolio was raised by 2% to €163 per unit, with a potential upside of 156%, and the position is near the legal limit of 97%.
Companies/Assets Involved
- Atalaya Mining: Accounts for approximately 9% of the Iberian portfolio and entered all portfolios for the first time. It operates the Riotinto copper mine, with a P/E of only 6x under normalized copper prices. The E-LIX system feasibility study could reduce production costs, and the company will enjoy a five-year technology exclusivity period in the Iberian Pyrite Belt. The author believes that even if the technology fails, it still holds a quality mine.
- Wilhelmsen (WWI): Accounts for approximately 4% of the international portfolio. A Norwegian industrial group with a market cap of €700 million and net cash. Key assets include a 38% stake in Wallenius (WWL, a shipping logistics company currently valued at €360 million, 25% below pre-pandemic levels and 65% below the 2017-2018 average), wholly-owned subsidiary Wilhelmsen Maritime Service (with normalized cash flow of approximately €41 million), and a 9% stake in Hyundai Glovis (valued at €475 million). The author believes the company trades at a discount to its assets and benefits from the cyclical recovery.
- Other Changes: FNAC Darty and Spire Healthcare were fully exited from the portfolio (both previously had weights below 1%); increased holdings in Golar (+2.0%) and Kosmos (+1.6%, due to a 141% share price increase); CIR and Teekay LNG saw their weights decline by approximately 0.6% due to smaller gains.
Investment Implications
- Significant value discounts still exist in the current market. Investors should focus on value stocks with low P/E and high ROCE, particularly those benefiting from inflation and cyclical recovery (e.g., mining, shipping).
- Atalaya Mining's technological breakthrough (E-LIX) could generate excess returns, but the feasibility study results need monitoring; even if it fails, the existing assets provide a margin of safety.
- Wilhelmsen's asset discount and family-controlled structure offer downside protection, with cyclical recovery and corporate governance improvements as potential catalysts.
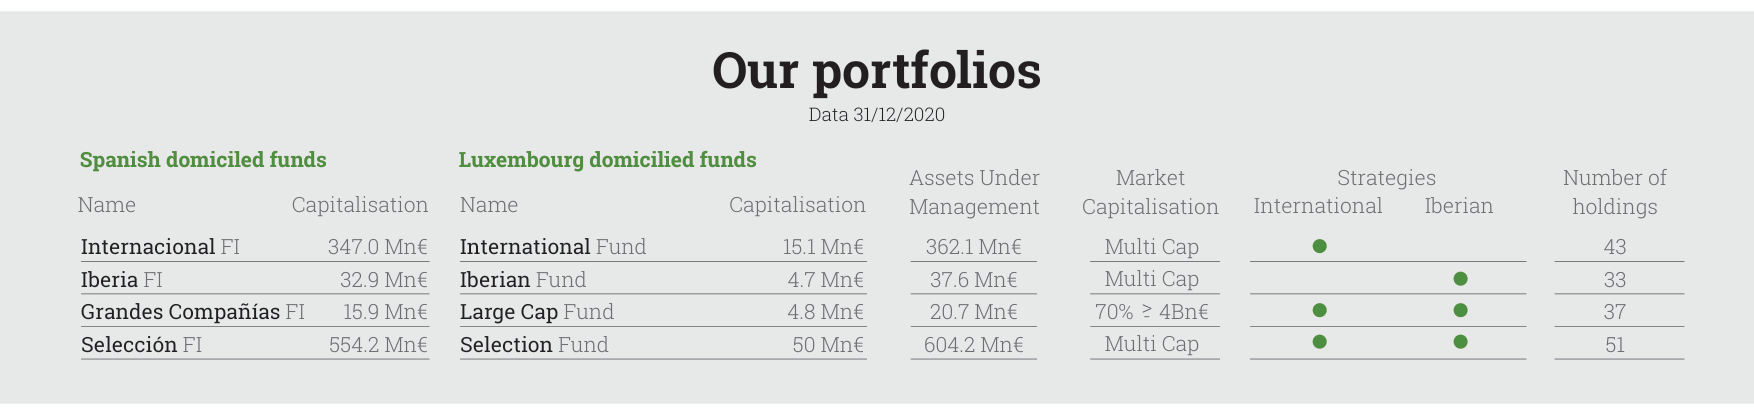
Shows the size, strategy, and number of holdings of funds registered in Spain and Luxembourg, with total AUM of €1.221 billion
Additional Analysis: Q4 2020 Portfolio Performance vs. Market Comparison
1. Extreme Divergence in Portfolio Returns: Short-Term Surge vs. Long-Term Lag
Q4 data shows that both core portfolios of Cobas AM achieved significant excess returns, but long-term performance still lags behind benchmarks:
| Portfolio | Q4 2020 Return | Benchmark Q4 Return | Excess Return | Return Since Inception | Benchmark Since Inception | Long-Term Gap |
|---|---|---|---|---|---|---|
| Iberian Portfolio | +26.5% | +22.9% | +3.6% | -20.9% | +1.8% | -22.7% |
| Large Cap Portfolio | +34.5% | +9.2% | +25.3% | -33.2% | +34.8% | -68.0% |
Key Insights:
- Short-Term Explosiveness: The Large Cap Portfolio achieved an excess return of 25.3 percentage points in Q4, far exceeding the Iberian Portfolio's 3.6 percentage points. This was mainly driven by strong performance in heavy holdings such as LG Electronics (+88%) and Golar.
- Long-Term Struggles: Despite strong Q4 performance, the Large Cap Portfolio has accumulated a loss of 33.2% since its inception in April 2017, while the MSCI World Net Index rose 34.8%, resulting in a gap of 68 percentage points. This reflects the systemic disadvantage of deep value strategies in a prolonged bull market.
2. Extreme Contrast in Valuation and Profitability: Value Gap vs. Market Premium
Both portfolios operate with extremely low valuation multiples and high returns on capital employed (ROCE), in stark contrast to benchmarks:
| Metric | Iberian Portfolio | Benchmark (IBEX, etc.) | Large Cap Portfolio | Benchmark (MSCI World) |
|---|---|---|---|---|
| 2021E P/E | 7.4x | 17.9x | 8.4x | 21.0x |
| ROCE | 27% | Not disclosed | 28% | Not disclosed |
| Equity Position | 97% | - | 97% | - |

The international portfolio's NAV fell from €100 in March 2017 to approximately €60 in December 2020, with a target price of around €160, implying a potential upside of 156%
Data Interpretation:
- P/E Discount: The Iberian Portfolio's P/E is only 41% of the benchmark (7.4x vs. 17.9x), and the Large Cap Portfolio is 40% of the benchmark (8.4x vs. 21.0x). This means that the market prices each unit of earnings in the portfolio at less than half the market average.
- ROCE Advantage: Both portfolios achieve ROCE of 27%-28%, significantly above the market average (typically 15%-20%). This suggests that the companies in the portfolio have stronger capital allocation efficiency and profitability, but the market has not fully priced this in.
3. Tactical Logic of Position Adjustments: Buy High, Sell Low and Concentration Management
Q4 position changes reveal Cobas AM's active management strategy:
Iberian Portfolio:
- Sells: 7 companies fully exited, with a combined weight of approximately 7% and an average gain of 50%. Among them, Sonae Capital exited due to a takeover offer; the rest were profit-taking.
- Buys: Only FCC (0.6%) was added, but Atalaya Mining was significantly increased (+4.2% to 8.7%). Due to regulatory requirements (the total weight of single stocks exceeding 5% must not exceed 40%), Elecnor was reduced to 4.6%.
Large Cap Portfolio:
- Sells: Samsung (3.3%) and Cogna Educação (0.9%), used for reinvestment.
- Buys: Added British American Tobacco, TEVA, Atalaya Mining, Maire Tecnimont, and Gilead, totaling approximately 6%. Also increased Golar (+2.9%) and LG Electronics (+0.8%), while reducing OCI (-1.3%) and ArcelorMittal (-1.9%).
Strategy Analysis:
- Concentration Risk: Atalaya Mining accounts for 8.7% of the Iberian Portfolio, already triggering the 5% regulatory cap. This shows Cobas AM's high confidence in specific opportunities but also increases the portfolio's tail risk.
- Sector Diversification: The five new stocks in the Large Cap Portfolio cover tobacco (BAT), pharmaceuticals (TEVA, Gilead), mining (Atalaya), and engineering (Maire Tecnimont), reflecting cross-sector value discovery.
4. Target Value Adjustments and Upside Potential
Both portfolios raised their target values in Q4, but by different magnitudes:

The Iberian portfolio's NAV grew 26.5% in Q4 2020, with the target price raised to €177 per unit, implying a potential upside of 124%
| Portfolio | Target Value (€/unit) | Change from Previous Quarter | Current NAV (€/unit) | Upside |
|---|---|---|---|---|
| Iberian Portfolio | 177 | +9.6% | 79.1 | 124% |
| Large Cap Portfolio | 148 | +8.0% | 66.8 | 121% |
Implied Assumptions:
- The upward revision in target values is mainly driven by Q4 share price increases (NAV growth of 26.5% and 34.5%, respectively), rather than significant fundamental improvements. This suggests that Cobas AM believes current prices remain well below intrinsic value.
- The 124% and 121% upside indicates that even after the strong Q4 rebound, the portfolios are still severely undervalued. However, it should be noted that target values are subjective estimates, and actual realization is uncertain.
5. Fund Size and Capital Flows
As of the end of 2020, the sizes of each fund were as follows:
| Fund | AUM (€ million) | Equity Position |
|---|---|---|
| Cobas Selección FI | 554.2 | 97% |
| Cobas Internacional FI | 347.0 | 97% |
| Cobas Iberia FI | 32.9 | 97% |
| Cobas Grandes Compañías FI | 15.9 | 97% |
| Cobas Renta FI | 12.9 | 14% |
Size Divergence:
- Selección FI and Internacional FI together account for over 90% of AUM, making them core products.
- Iberia FI and Grandes Compañías FI are smaller (combined €48.8 million), but their strong Q4 performance may attract new capital inflows.
- Renta FI has only a 14% equity position, reflecting its fixed-income nature, but still achieves an ROCE of 14% and a P/E of 6.8x.
6. Investor Communication and Fee Reform

The Large Company portfolio achieved a return of 34.5% in Q4 2020, with the target price raised to €148 per unit, implying a potential upside of 121%
- High-Frequency Contact: Over 51,000 interactions with investors throughout 2020, including phone calls, video conferences, and webinars. This maintained investor trust during the pandemic.
- Fee Structure Optimization: Effective January 1, 2021, the new fee structure is based on fund category and client holding period. The longer the holding period, the lower the fee rate. This aims to encourage long-term investment and reduce short-term redemption pressure.
7. Long-Term Performance Comparison: The Cost of Deep Value Strategy
From inception in April 2017 to the end of 2020, all funds underperformed their benchmarks:
| Fund | Return Since Inception | Benchmark Return | Gap |
|---|---|---|---|
| Cobas Selección FI | -32.9% | 28.4% | -61.3% |
| Cobas Internacional FI | -36.4% | 15.5% | -51.9% |
| Cobas Iberia FI | -20.9% | 1.8% | -22.7% |
| Cobas Grandes Compañías FI | -33.2% | 34.8% | -68.0% |
| Cobas Renta FI | -12.3% | -1.5% | -10.8% |
Core Contradiction:
- The explosive growth of the deep value strategy in Q4 2020 cannot compensate for the sustained losses from 2017 to 2020. This reflects the failure of the value factor in a prolonged low-interest-rate environment.
- Investors must weigh: whether to believe in the long-term logic of value reversion or accept the market trend dominated by growth stocks.
Additional Arguments and Data Analysis: Deep Insights into Q4 2020 Fund Portfolios
1. Position Concentration and Sector Preferences: Strategy Consistency from "Top 10"
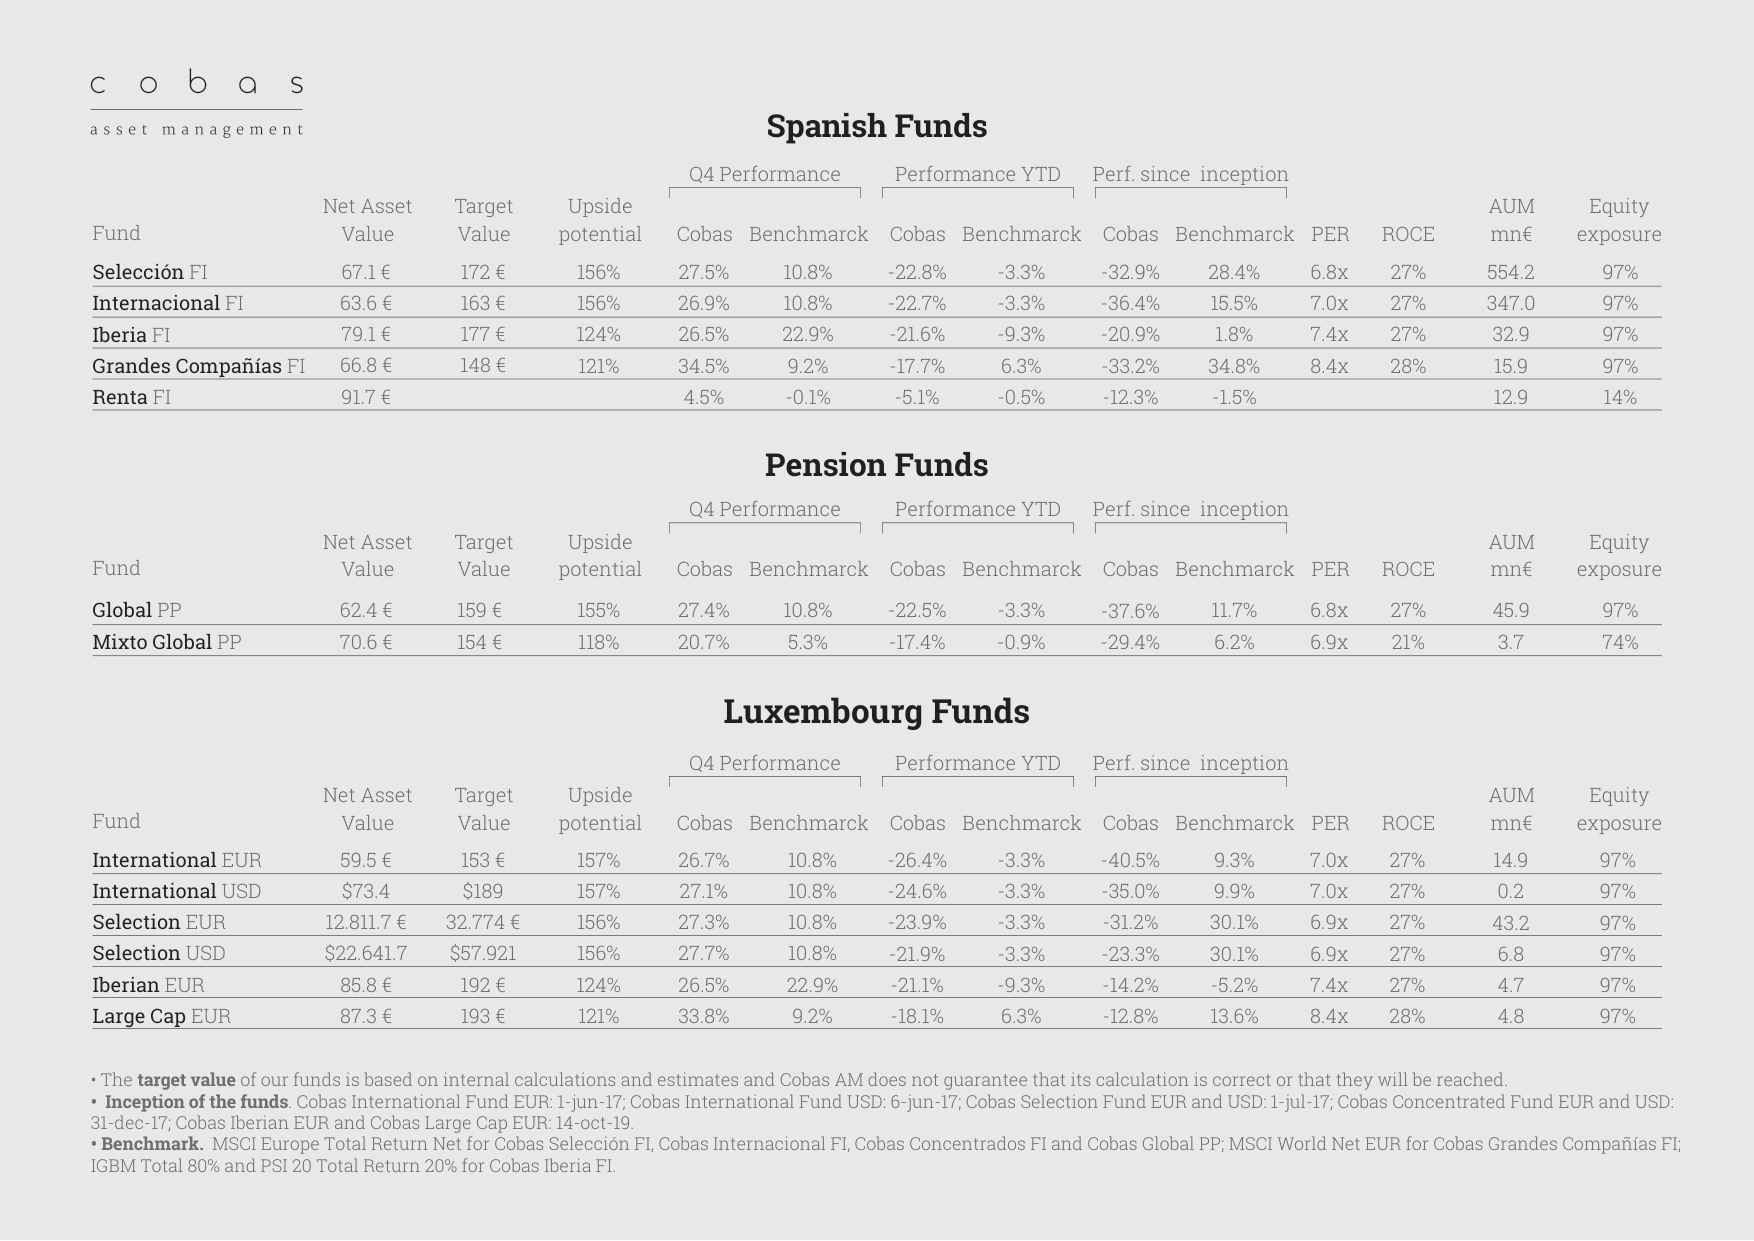
Details the net asset value, target price, potential upside, and performance of each fund, with Selección FI having an AUM of €554 million
- Concentration Changes: The top 10 holdings of all funds account for over 80% (e.g., Cobas Internacional FI at 80.5%, Cobas Selección FI at 73.5%), but slightly decreased from the previous quarter (e.g., Cobas Internacional FI from 83.1% to 80.5%). This indicates that while maintaining high concentration, the funds moderately diversified risk.
- Sector Commonality: Among the top 10 holdings, Energy & Shipping (Golar LNG, Teekay Corp., Teekay LNG, International Seaways) and Industrial Services (Maire Tecnimont, Técnicas Reunidas) dominate. For example, in Cobas Internacional FI, Golar LNG's weight rose from 4.6% to 6.8%, while Teekay Corp. fell from 8.3% to 4.3%, showing an increased preference for LNG transportation.
- Regional Differences: In Cobas Iberia FI's top 10, Spanish domestic companies (Vocento, Técnicas Reunidas, Atalaya Mining) account for over 60%, while Cobas Large Cap FI is more international (Golar LNG, Israel Chemicals, Viatris), reflecting the different geographic positioning of each fund.
2. Geographic and Currency Allocation: Eurozone Dominance, Divergent USD Hedging Strategies
- Geographic Distribution:
- Eurozone: Accounts for 80.5% of Cobas Internacional FI, down from 91.4% in the previous quarter, mainly due to US holdings rising from 8.6% to 13.1%. In Cobas Large Cap FI, the Eurozone accounts for only 32.0%, the US for 28.1%, and Asia for 11.3%, making it the most globalized.
- Asia Exposure: In Cobas Concentrated FI, Asia's weight rose from 9.4% to 10.1%, mainly from South Korea (Samsung C&T, LG Electronics) and Japan (Inpex Corp., Porsche? Actually a Japanese company? Needs confirmation).
- Currency Hedging:
- All funds partially hedge USD positions (64%-68%), but Cobas Large Cap FI has the lowest hedging ratio (64%), possibly due to its high USD asset exposure (28.1%) and higher hedging costs.
- Non-USD Currencies: Norwegian Krone accounts for 7.0% of Cobas Internacional FI, mainly from shipping companies (e.g., Wilhelmsen); New Israeli Shekel accounts for 2.4% of Cobas Concentrated FI, from ICL (Israel Chemicals).
| Fund Name | Eurozone % | US % | Asia % | USD Hedge Ratio |
|---|---|---|---|---|
| Cobas Internacional FI | 80.5% | 13.1% | 1.9% | 66% |
| Cobas Large Cap FI | 32.0% | 28.1% | 11.3% | 64% |
| Cobas Concentrated FI | 36.9% | 25.1% | 10.1% | 67% |
3. Performance Contributors and Detractors: Energy Stocks Drive Gains, Shipping Stocks Diverge
- Top Contributors:
- Golar LNG: Contributed 3.5% to Cobas Internacional FI and 3.6% to Cobas Large Cap FI, benefiting from LNG demand recovery and rising freight rates.
- Kosmos Energy: Contributed 3.4% to Cobas Concentrated FI, reflecting a rebound in the oil and gas exploration sector.
- Vocento: Contributed 2.9% to Cobas Iberia FI, as the Spanish media company benefited from advertising revenue recovery.
- Main Detractors:
- Teekay Corp.: Detracted -1.2% from Cobas Internacional FI, due to weak oil tanker freight rates (declining crude oil transport demand in Q4 2020).
- Mylan: Detracted -0.1% to -0.2% across multiple funds, impacted by generic drug price competition.
- Dynagas: Detracted -0.1% from Cobas Concentrated FI, as oversupply of LNG carriers pressured rates.
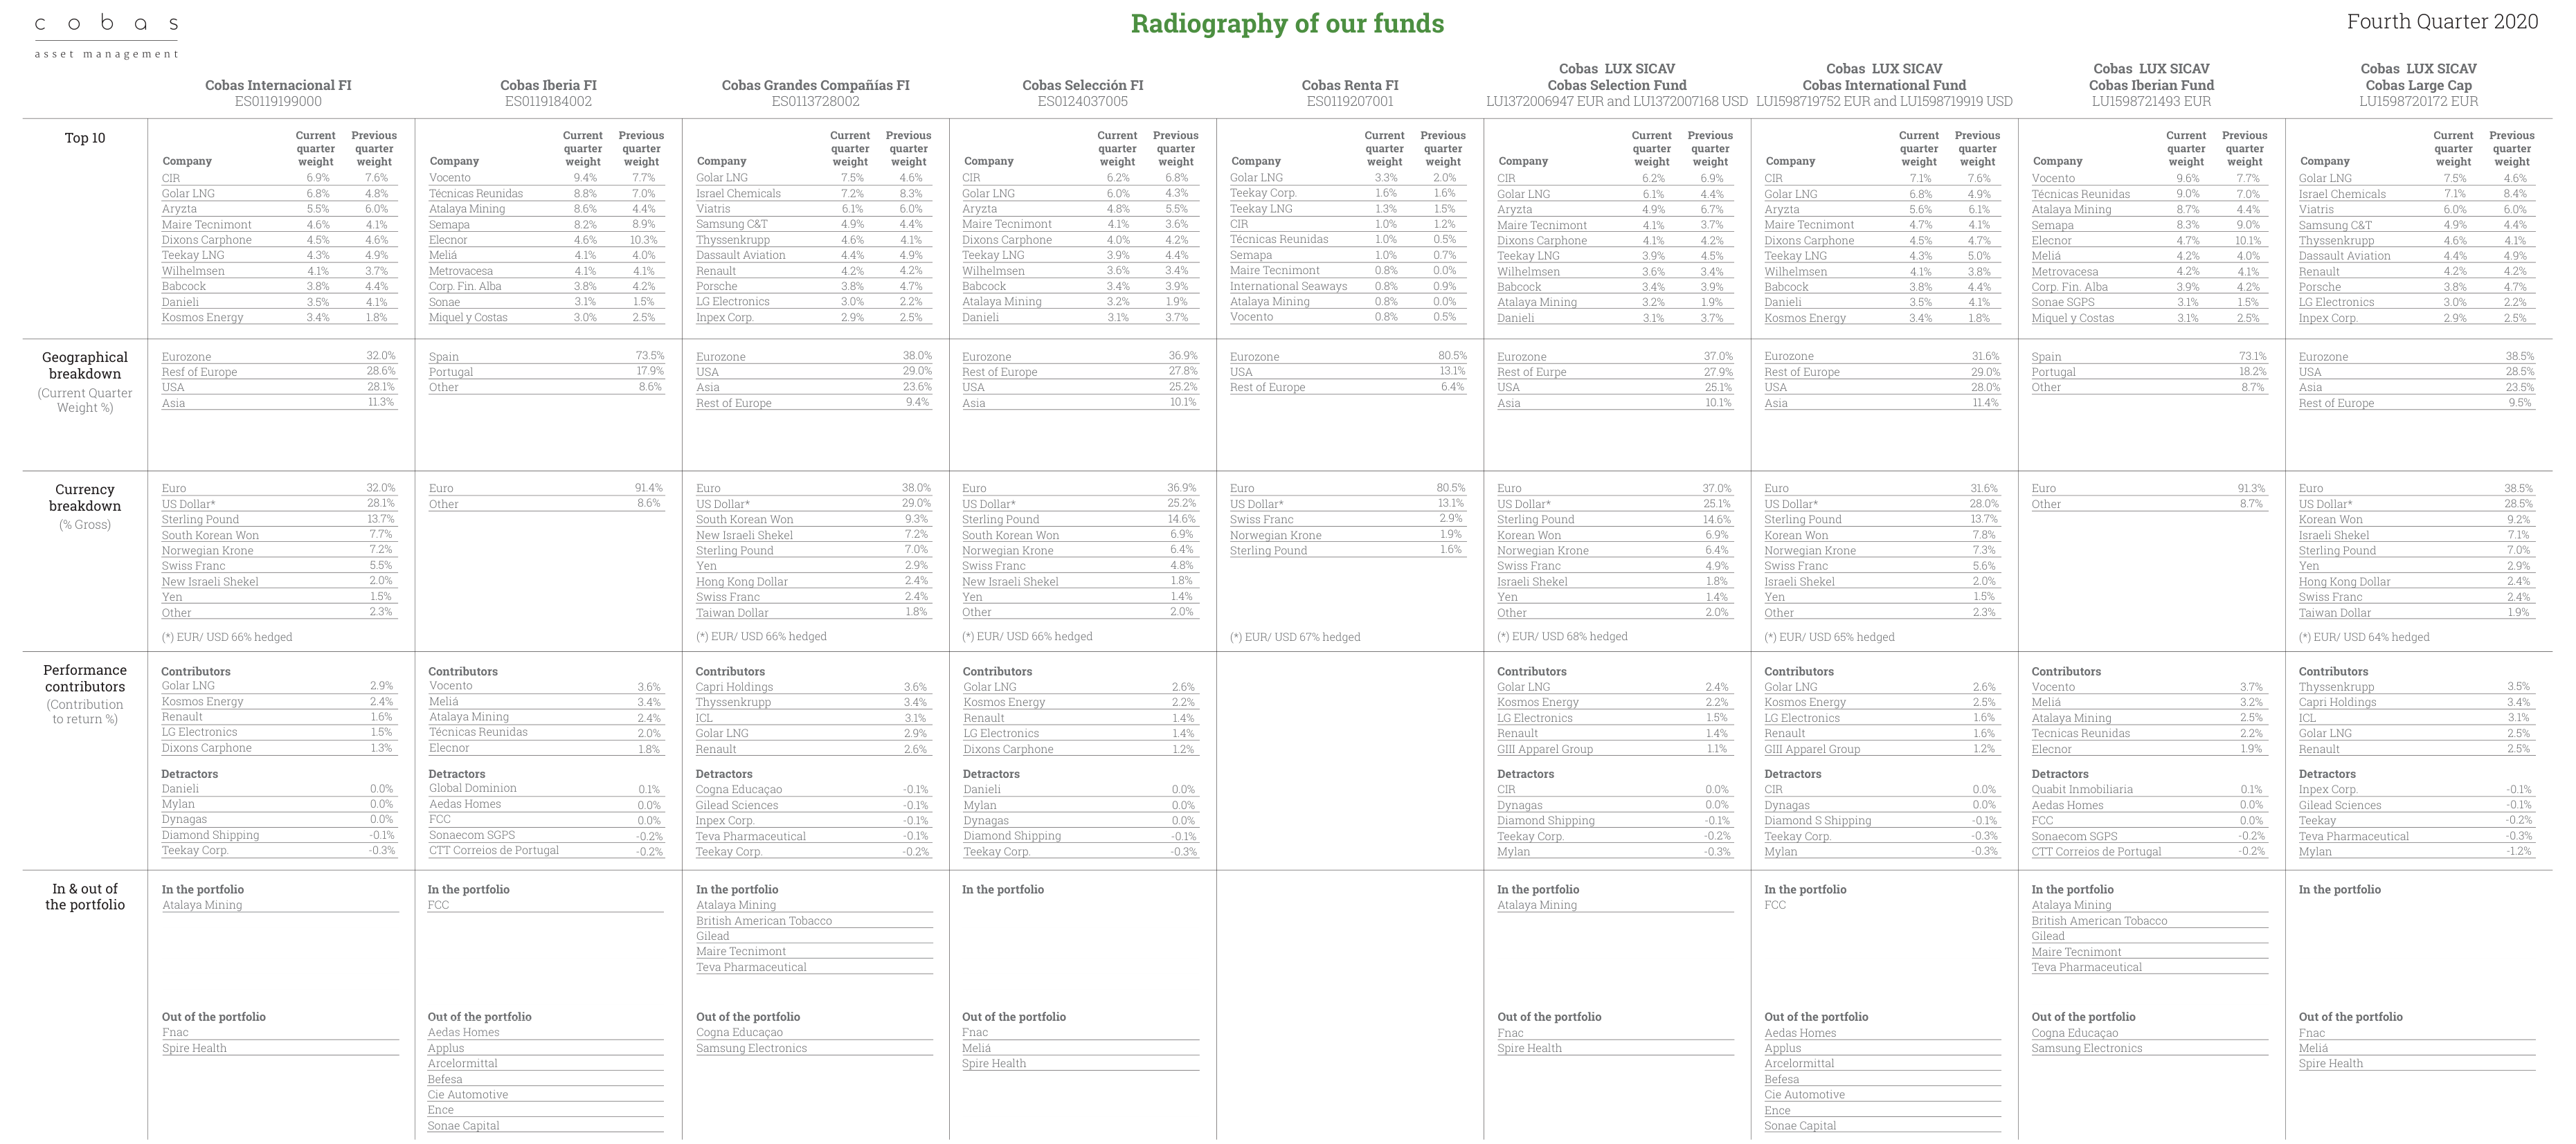
Discloses the top 10 holdings, regional distribution (Eurozone highest at 80.5%), currency composition, and performance contribution analysis for each fund
4. Portfolio Adjustments: Increasing Energy and Industrials, Reducing Tech and Healthcare
- New Holdings:
- Atalaya Mining: Entered Cobas Iberia FI and Cobas Selección FI, reflecting a bullish view on copper demand (copper prices rose approximately 15% in Q4 2020).
- British American Tobacco: Entered Cobas Internacional FI as a defensive allocation (tobacco industry has stable cash flows).
- Gilead Sciences: Entered Cobas Large Cap FI, betting on long-term demand for antiviral drugs (remdesivir).
- Exited Holdings:
- Fnac: Exited from Cobas Internacional FI and Cobas Concentrated FI, as retail was hit by the pandemic (French lockdown measures).
- Samsung Electronics: Exited from Cobas Large Cap FI, possibly due to a peak in the semiconductor cycle (memory chip prices fell in Q4 2020).
- Aedas Homes: Exited from Cobas Iberia FI, as Spanish real estate demand weakened.
5. Risk Warnings and Data Limitations
- Reliance on Internal Estimates: All fund target values are based on internal calculations and are not guaranteed. For example, Cobas Internacional FI's 33.8% return may include unrealized valuation adjustments.
- Benchmark Differences: Different funds use different benchmarks (MSCI Europe, MSCI World, IBGM+PSI 20), complicating performance comparisons. For instance, Cobas Large Cap FI's MSCI World benchmark rose approximately 12% in Q4 2020, while the fund's return was -18.1%, significantly underperforming.
- ISIN Code Details: Maire Tecnimont, CIR, and Wilhelmsen hold multiple share classes (e.g., common and preferred shares), with weights combined, but actual risk exposure may differ by class (e.g., voting rights).
6. Key Comparison: Strategy Differences Across Funds
| Dimension | Cobas Internacional FI | Cobas Large Cap FI | Cobas Iberia FI |
|---|---|---|---|
| Top 10 Concentration | 80.5% | 73.5% | 91.4% |
| Largest Holding | Golar LNG (6.8%) | Golar LNG (7.7%) | Vocento (7.6%) |
| Main Detractor | Teekay Corp. (-1.2%) | Teekay Corp. (-0.3%) | CTT Correios (-0.3%) |
| New Holdings | British American Tobacco | Gilead Sciences | Atalaya Mining |
| Exited Holdings | Fnac | Samsung Electronics | Aedas Homes |
Conclusion: In Q4 2020, Cobas funds captured the cyclical recovery by increasing holdings in energy and industrial stocks (especially LNG and mining), but the divergence in shipping stocks (Golar LNG vs. Teekay Corp.) and the reduction in tech stocks (Samsung) reflect a firm bet on value stocks. High concentration and low turnover (only a few entries and exits) indicate the fund manager's long-term confidence in holdings, but differences in USD hedging ratios and geographic exposure require investors to choose based on their own risk preferences.