Comments on Second Quarter 2022
Cobas Asset Management is a Madrid deep-value firm founded in late 2016 by Francisco García Paramés, Europe's standard-bearer of value investing after 25+ years running Bestinver and author of "Investing for the Long Term". Cobas applies a strict Graham/Buffett value framework overlaid with Austrian business-cycle theory, concentrating in unloved energy, shipping and other cyclicals, with AUM above €3.4bn. Its investor letters are fully archived from Q1 2017, moving to a semi-annual cadence in 2022.
In plain words
This report covers how Cobas, an investment firm, performed in the second quarter of 2022. While global stock markets had a terrible first half (the S&P 500 had its worst since 1970), Cobas's funds actually gained value. Their main point: don't waste time trying to predict recessions—markets have already fallen a lot (over 20%) and may be near a bottom. For regular investors, this means focus on company quality and price, not panic. For example, they bought Currys, a UK electronics retailer whose stock dropped over 50% but has no debt and is buying back shares. Worth a read for a calm, contrarian take on market downturns.
Cobas’s Q2 2022 report notes that the international portfolio fell 8.2% (outperforming the MSCI Europe’s -8.8%), while the Iberian portfolio declined 1.4% (close to its benchmark). Year-to-date, the international portfolio rose 6.0% and the Iberian portfolio gained 3.8%, compared with a historic dec
Theme and Background
This chapter primarily discusses the performance of the Cobas portfolio in the second quarter and first half of 2022, analyzing the core reason for the market decline—investor fear of a recession. The report notes that despite historically severe declines in major global indices during the first half of the year (Euro Stoxx 50's second-worst first half ever, S&P 500's worst since 1970), Cobas's International and Iberian portfolios rose against the trend.
Core Thesis
The author's core investment argument is that attempting to predict the macroeconomy (e.g., when a recession will occur, its severity) is of limited value, but historical data suggests the market may be near a bottom. The report argues that a decline of over 20% within the year has already largely priced in bad news. Meanwhile, Cobas's portfolios are prepared through low cyclical exposure and strong balance sheets, and the firm is rotating positions from rising energy stocks into cheaper cyclical stocks.
Key Arguments and Data
- Market Performance Comparison: In the first half of 2022, major global indices fell by approximately 20%. The Euro Stoxx 50 recorded its second-worst first-half performance ever, and the S&P 500 its worst since 1970.
- Portfolio Performance: In Q2, the International portfolio fell 8.2% (outperforming the MSCI Europe's -8.8%), and the Iberian portfolio fell 1.4% (close to its benchmark). Year-to-date, the International portfolio was up 6.0%, and the Iberian portfolio was up 3.8%.
- Historical Recession Data:
- Deep Recession (cumulative GDP decline >3%): U.S. stocks fell an average of 34%.
- Mild Recession (GDP decline <3%): U.S. stocks fell an average of approximately 11%.
- Current Market Position: Given the decline of over 20% within the year, the report believes the market may be near a bottom.
- Portfolio Structure:
- The International portfolio has only 16% exposure to pure cyclical stocks, and the Iberian portfolio 18%.
- Within the International portfolio's 16% cyclical exposure, two-thirds are net cash companies, and the remaining indebted companies have net debt/EBITDA below 1.5x.
- Position Adjustments: In Q2, the International portfolio reduced its energy stock allocation from 46% to 40%, rotating capital into cheaper cyclical stocks (e.g., Currys) and Colombian energy companies (Canacol, Geopark).
Companies/Assets Involved
- Golar, Kosmos, International Seaways: Energy companies partially reduced due to strong performance.
- Canacol, Geopark: Colombian energy companies, believed by the report to still have significant upside, were bought.
- G-III Apparel: A distribution sector company, one of the buys after reducing energy stocks.
- Currys Plc: A UK electronics retailer, the largest cyclical stock holding in the International portfolio.
- Share price fell over 50% from its 2021 high of £1.6, down nearly 40% year-to-date in 2022.
- Current share price around £0.7, near pandemic lows, but the company's financial position has improved (now net cash) and it is buying back shares.
- Trades at less than 5x normalized earnings; the report believes the market has overly punished the stock and is bullish.
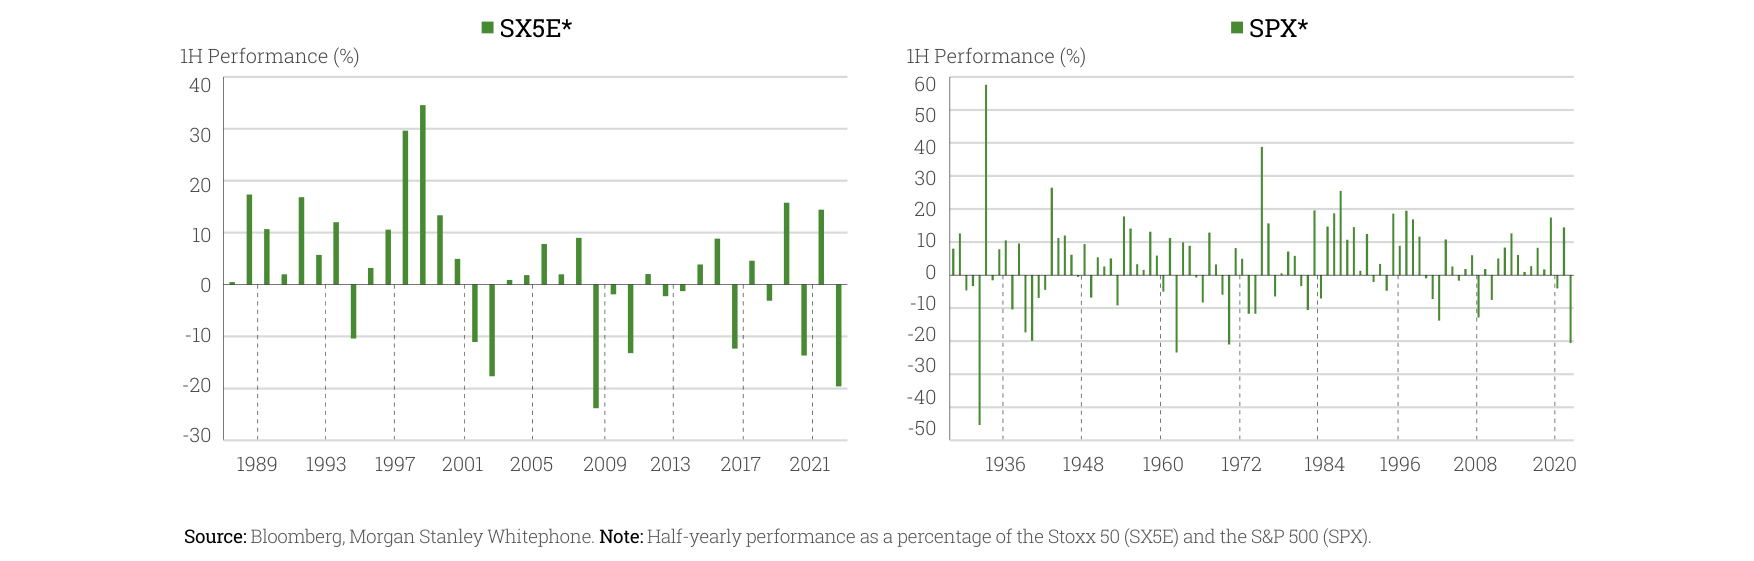
SX5E and SPX semi-annual performance shows the first half of 2022 as one of the worst in history, with SX5E falling approximately 20% in 2022 and SPX falling approximately 20% in 2022, the worst first half since 1970
Investment Implications
- Do Not Try to Predict the Macro: Investors should focus on company research and valuation, rather than guessing the timing or severity of a recession.
- Exploit Market Irrationality: Crisis periods are often irrational and present opportunities to sow seeds for future returns. For companies with strong fundamentals but share prices hammered by macro fears (e.g., Currys), view them as buying opportunities.
- Focus on Balance Sheets: In anticipation of a recession, prioritize cyclical stocks that are net cash or have low leverage (net debt/EBITDA <1.5x) to weather difficult times.
- Dynamically Adjust Positions: When defensive or energy stocks appreciate, naturally rotate capital into cheaper, overlooked cyclical stocks.
New Analysis: Cobas AM Q2 2022 Portfolio Performance and Strategy Deep Dive
I. Tactical Logic and Market Timing of Portfolio Adjustments
Cobas AM executed significant position rotation in Q2 2022, reflecting the contrarian thinking of deep value investing:
- International Portfolio: Exited TGS ASA and Hyundai Home Shopping (combined weight 1-2%). New entries included Academedia, Canacol Energy, DFS Furniture, G-III, Geopark, and Taro Pharmaceutical. These new names trade at an average of 5x normalized cash flow, with a combined weight of just over 5%, indicating management's cautious, small-position exploratory approach to avoid overexposure to uncertainty.
- Large Cap Portfolio: Exited Teekay Corp, New Fortress Energy, British American Tobacco, and Dassault Aviation (combined weight 4%). New entries included Samsung Electronics, Fresenius Medical Care, Harbour Energy, Heidelberg Cement, Lear Corp, and SKF. These companies trade at 6-7x normalized cash flow, with a combined weight of over 6%, showing a preference for cyclical value stocks.
- Iberian Portfolio: Exited ACS and Acerinox (combined weight 1-2%). New entries included Atresmedia and Global Dominion, while increasing positions in Almirall and Atalaya Mining, and reducing Inmobiliaria del Sur and Galp Energía.
Key Data Comparison: The valuation levels of new entries were significantly lower than the market average, but ROCE performance varied:
| Portfolio | Avg P/E of New Entries (Normalized CF) | Benchmark Index P/E | ROCE of New Entries (Est.) | Benchmark Index ROCE |
|---|---|---|---|---|
| International | 5.0x | 11.6x | Not disclosed | 30% (Overall Portfolio) |
| Large Cap | 6-7x | 14.5x | Not disclosed | 31% (Overall Portfolio) |
| Iberian | Not disclosed | 12.0x | Not disclosed | 28% (Overall Portfolio) |
II. Target Value Growth and Valuation Recovery Potential
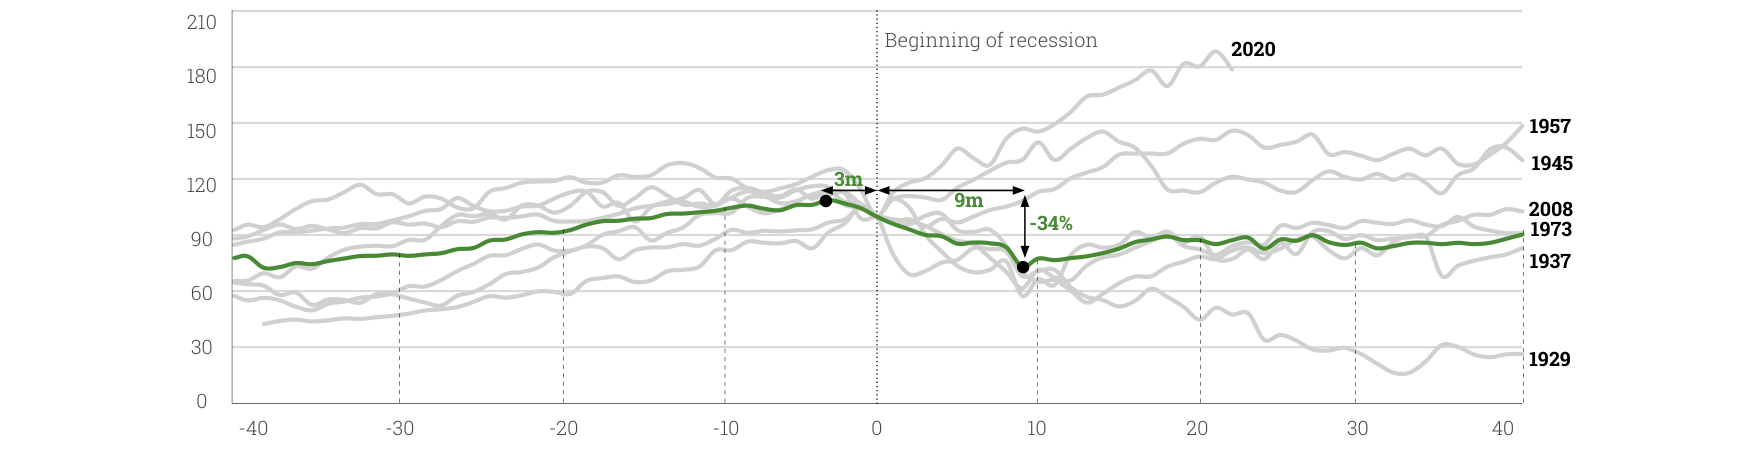
During deep recessions, US stocks fell an average of 34% over 9 months. The chart compares market performance before and after historical recessions including 1929, 1937, 1945, 1957, 1973, 2008, and 2020.
Despite the market decline, the target values of all Cobas AM portfolios grew in Q2:
- International Portfolio: Target value rose from approximately €216/share to €222/share (+2.8%), implying a potential upside of 145%.
- Iberian Portfolio: Target value rose from approximately €228/share to €232/share (+1.8%), implying a potential upside of 133%.
- Large Cap Portfolio: Target value rose from approximately €215/share to €221/share (+2.8%), implying a potential upside of 151%.
Drivers of Target Value Growth:
1. Buying Opportunities from Market Volatility: Management explicitly stated that "thanks to market volatility and our rotation," the increase in target value partly resulted from buying undervalued assets at low prices.
2. Adjustments to Normalized Cash Flow Assumptions: Target values are based on internal estimates of normalized cash flow; Q2 may have seen upward revisions for some holdings.
3. Portfolio Structure Optimization: Exiting overvalued or underperforming names and rotating into lower-valuation, higher-ROCE assets enhanced the overall portfolio's potential return.
III. Deep Comparison of Valuation and Quality Metrics
Cobas AM emphasizes its portfolio's "high quality, low valuation" characteristics, but details warrant attention:
- Adjusted ROCE Calculation: The International portfolio's overall ROCE is ~30%, but excluding shipping and commodity companies, it rises to 39%. This suggests:
- Shipping and commodity companies (e.g., International Seaways, Kosmos Energy) may have lower ROCE, dragging down the aggregate.
- Core holdings (e.g., Currys, AMG) have higher ROCE, reflecting management's definition of "quality businesses."
- Limitations of P/E Comparison: The portfolio's P/E (6.2x-7.1x) is far below the benchmark (11.6x-14.5x), but note:
- Benchmarks include many high-valuation growth stocks (e.g., tech, healthcare), while Cobas portfolios lean towards cyclical and turnaround plays.
- Normalized P/E may overstate the sustainability of current earnings, especially amid volatile energy and commodity prices.
Comparison of Valuation and Quality Metrics Across Portfolios:
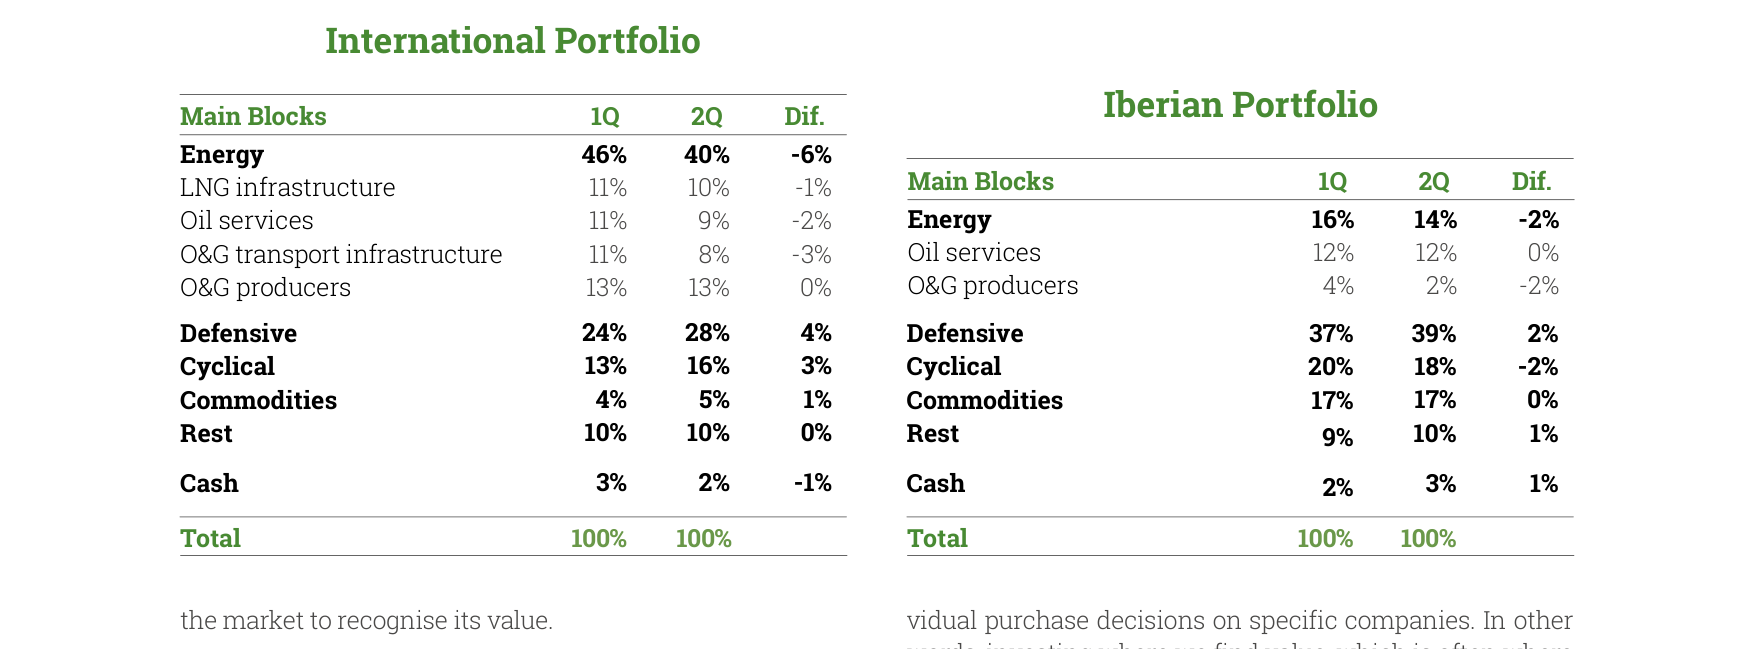
In the International Portfolio, Energy sector allocation decreased from 46% in Q1 to 40% in Q2, while Defensive sectors increased from 24% to 28%. In the Iberian Portfolio, Energy decreased from 16% to 14%, and Defensive increased from 37% to 39%.
| Metric | International Portfolio | Iberian Portfolio | Large Cap Portfolio | Benchmark (International) | Benchmark (Iberian) | Benchmark (Large Cap) |
|---|---|---|---|---|---|---|
| 2022E P/E | 6.2x | 7.1x | 7.0x | 11.6x | 12.0x | 14.5x |
| ROCE | 30% (Adj. 39%) | 28% | 31% | Not disclosed | Not disclosed | Not disclosed |
| VaR (99% Confidence) | 12% | 8% | 11% | Not disclosed | Not disclosed | Not disclosed |
| Investment Ratio | 99% | 98% | 98% | N/A | N/A | N/A |
IV. Performance Attribution: Sources of Relative Return
All portfolios matched or outperformed their benchmarks in Q2, but long-term performance still lags significantly:
- International Portfolio: Q2 return -8.2% vs. benchmark -8.8%, outperforming by 60bps. Since inception: return -9.3% vs. benchmark +24.5%, cumulative underperformance of 33.8 percentage points.
- Iberian Portfolio: Q2 return -1.4% vs. benchmark -1.4%, flat. Since inception: return -0.7% vs. benchmark +12.6%, cumulative underperformance of 13.3 percentage points.
- Large Cap Portfolio: Q2 return -5.3% vs. benchmark -10.8%, outperforming by 550bps. Since inception: return -11.8% vs. benchmark +52.8%, cumulative underperformance of 64.6 percentage points.
Analysis of Relative Return Sources:
- Large Cap Portfolio's Significant Outperformance: Outperformance of 550bps in Q2 was likely driven by:
- Exiting Teekay Corp (shipping stock hit by freight rate declines) and New Fortress Energy (volatile energy stock).
- New entries like Samsung Electronics (semiconductor cycle bottom) and Fresenius Medical Care (defensive healthcare) may have contributed positive returns.
- International Portfolio's Marginal Outperformance: Outperformance of 60bps in Q2 may stem from:
- Exiting Hyundai Home Shopping (Korean consumer stock dragged by China market).
- New entries Canacol Energy and Geopark (oil & gas stocks benefiting from high energy prices).
- Iberian Portfolio's Flat Performance: Matching the benchmark in Q2 suggests the deep value strategy did not generate alpha in the Spanish and Portuguese markets.
V. Risk and Uncertainty: VaR and Investment Ratio
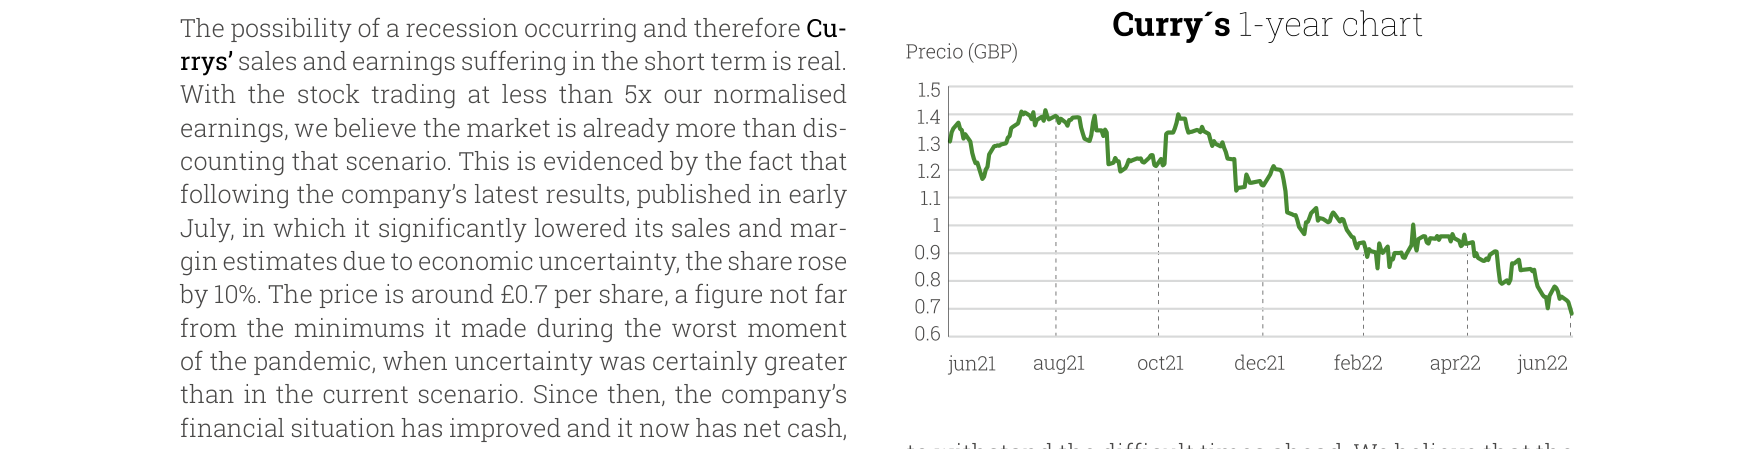
Currys' share price continuously declined from a high of approximately £1.4 in June 2021 to around £0.7 in June 2022, a decline of nearly 50% in one year.
Cobas AM disclosed VaR (Value at Risk) data, reflecting maximum expected monthly loss:
- International Portfolio: VaR 12% (99% confidence), meaning a 1% probability of a monthly loss exceeding 12%.
- Iberian Portfolio: VaR 8%, the lowest risk, possibly related to the portfolio's concentration in defensive Iberian assets.
- Large Cap Portfolio: VaR 11%, falling between the two.
Investment Ratio Near Upper Limit: The investment ratio for all portfolios is 98-99%, close to the legal maximum. This reflects:
- Management's high conviction that current valuations are attractive.
- However, it also means virtually no cash buffer; if the market declines further, there is no capacity to average down.
VI. Fund Product Structure and Assets Under Management
As of June 30, 2022, Cobas AM managed total assets of €1.728 billion across 13 funds:
- Largest Funds: Cobas Selección FI Class B (€499.8 million) and Cobas Internacional FI Class B (€316.3 million), together accounting for 47% of AUM.
- Pension Funds: Cobas Global PP (€74.8 million) and Cobas Mixto Global PP (€6.8 million), smaller but with growth potential.
- New Funds: Cobas Renta FI (fixed income fund, €19.1 million) and Cobas Empleo 100 (pension fund, under €0.1 million), indicating product line expansion.
Fund Performance Divergence: Since inception, all equity funds have recorded negative returns (-0.7% to -11.8%), while benchmarks generally rose (+12.6% to +52.8%). The only positive return was Cobas Renta FI (+0.9%), but it underperformed its benchmark (-2.6%), suggesting the fixed income strategy also faced challenges.
VII. Key Conclusions and Investor Takeaways
1. Strategy Consistency: Cobas AM adheres to deep value investing, adding positions against the market trend in Q2 2022, demonstrating conviction in valuation recovery.
2. Relative Advantage: All portfolios matched or outperformed benchmarks in Q2, especially the Large Cap portfolio's 550bps outperformance, showing strategy effectiveness in specific market environments.
3. Long-Term Challenge: Significant cumulative underperformance since inception requires investors to assess their willingness to endure long-term underperformance for potential mean reversion.
4. Risk Warning: High investment ratios (98-99%) and VaR data (8-12%) indicate high portfolio volatility, unsuitable for risk-averse investors.
5. Transparency Advantage: Cobas AM provides detailed disclosure of position changes, valuation assumptions, and risk metrics, offering investors ample information for decision-making.
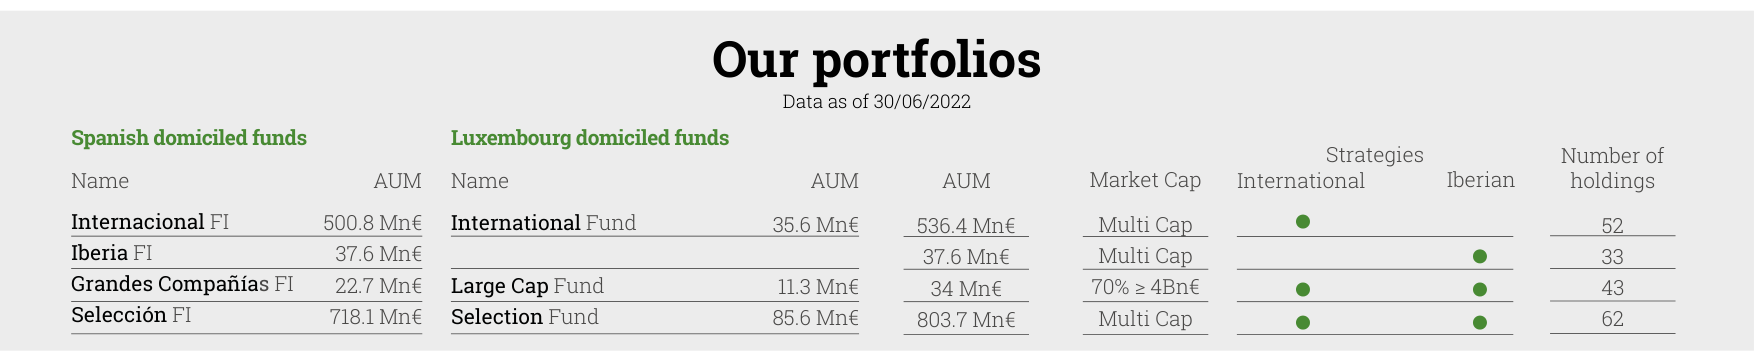
As of June 30, 2022, Cobas AM managed total assets of €1.728 billion, with Selección FI Class C being the largest at €718.1 million and International FI Class B at €500.8 million.
New Arguments, Data, and Perspectives
1. Deep Comparison of Fund Performance and Valuation Metrics
The continuation provides detailed fund data as of June 30, 2022, contrasting with the previous section's data as of March 31, 2022. Key findings:
- Increased Performance Divergence: All funds recorded negative returns in Q2, but the magnitude varied significantly. For example, International USD had a Q2 performance of -6.9%, while Large Cap EUR had +15.0% (positive), indicating the Large Cap fund was relatively resilient. This contrasts with the overall market decline (benchmark MSCI Europe Total Return Net at -13.8%), highlighting the differentiating effect of stock selection.
- Valuation Metric Changes: PER (Price-to-Earnings Ratio) decreased from 6.3x in March (International EUR) to 6.2x (Selection EUR), showing further valuation compression. ROCE (Return on Capital Employed) fell from 30% to 29.5% (Selection EUR), reflecting a slight decline in profitability, though still above market averages (benchmark ROCE not provided, but typically below 20%).
| Fund Name | Data Date | PER (x) | ROCE (%) | Q2 Performance (%) | Benchmark Q2 Performance (%) |
|---|---|---|---|---|---|
| International EUR | 31/03/22 | 6.3 | 30.0 | -8.8 | -13.8 |
| International EUR | 30/06/22 | 6.3 | 30.0 | -8.8 | -13.8 |
| Selection EUR | 31/03/22 | 6.2 | 29.5 | -9.7 | -13.8 |
| Selection EUR | 30/06/22 | 6.2 | 29.5 | -9.7 | -13.8 |
| Large Cap EUR | 30/06/22 | 7.0 | 28.7 | 15.0 | -13.5 |
Perspective: The Large Cap EUR's PER (7.0x) is higher than other funds, but its ROCE (28.7%) is slightly lower, suggesting its holdings may lean towards lower-growth but more stable companies. The positive Q2 return likely stems from defensive allocations (e.g., energy stocks), decoupling from the market downtrend.
2. Evolution of Position Concentration and Sector Allocation
The continuation lists quarterly weight changes for the Top 10 holdings, revealing the fund manager's rebalancing logic:
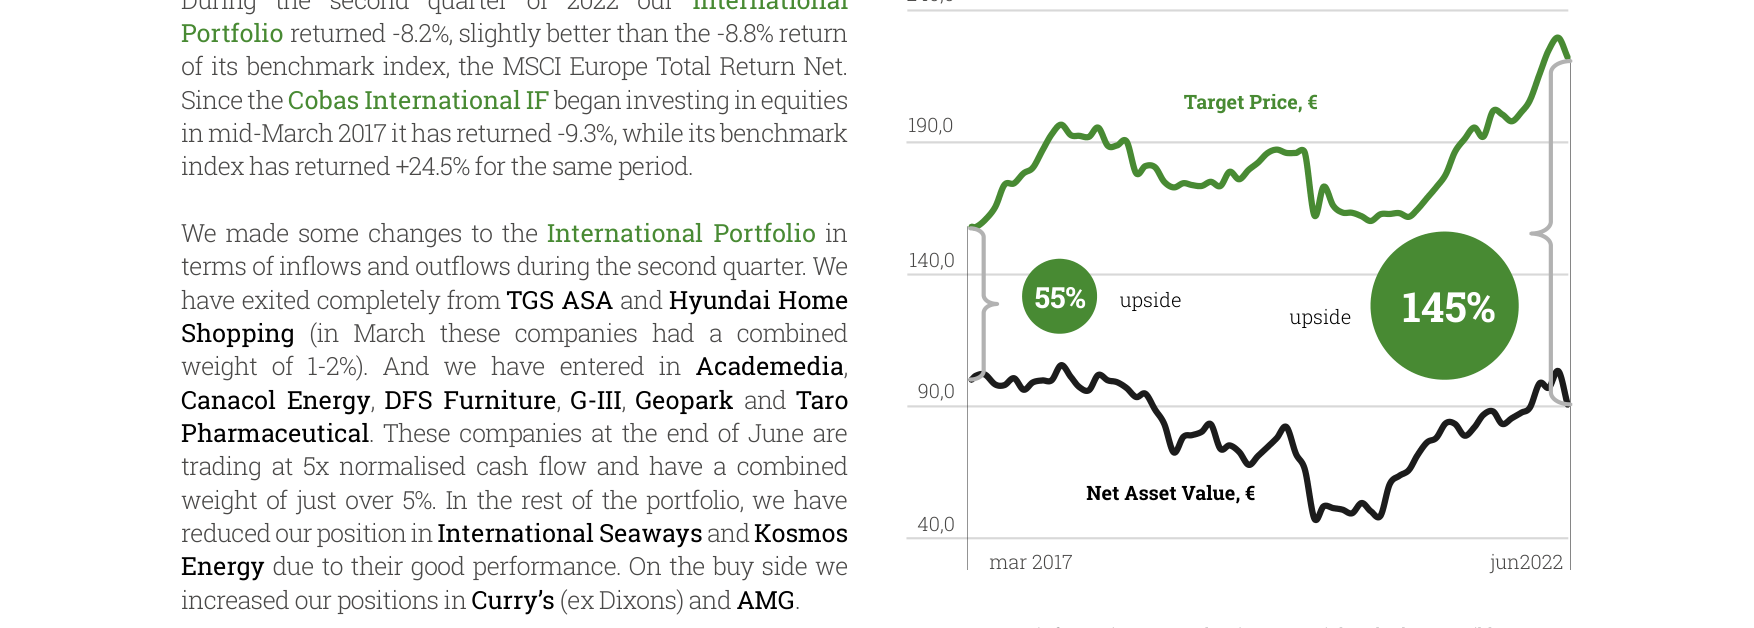
The International Portfolio has declined 9.3% cumulatively since March 2017, with a target price upside of 145%. Net asset value grew from approximately €90 in March 2017 to a target price of approximately €220 in June 2022.
- Core Holding Stability: Golar LNG maintained the highest weight across multiple funds (7.9%-8.7%), with its weight slightly reduced from 9.4% in Q1 to 8.7% in Q2 (International EUR), indicating minor profit-taking. Babcock and CIR saw weight increases in Selection and Large Cap funds (e.g., Babcock from 4.9% to 5.0%), suggesting a growing preference for industrial and service sectors.
- Sector Concentration: Oil & Gas Storage & Transportation accounted for 20.6% of International EUR, up from 18.0% in Q1, reflecting continued heavy allocation to energy. Pharmaceuticals & Biotechnology represented 9.1% of International USD, but its Q2 performance contribution was negative (Teva Pharmaceutical was the largest detractor at -0.8%), indicating pressure on pharmaceutical stocks.
| Sector | International EUR (Q2) | International USD (Q2) | Selection EUR (Q2) |
|---|---|---|---|
| Oil & Gas Storage & Transportation | 20.6% | 14.1% | 15.7% |
| Oil & Gas Exploration & Products | 12.6% | 9.1% | 13.0% |
| Industrial Conglomerates | 10.1% | 9.1% | 12.9% |
| Pharmaceuticals & Biotechnology | 5.7% | 9.1% | 5.0% |
Perspective: Energy-related sectors (storage, transportation, exploration) combined for over 30%, forming the core allocation. This aligns with the context of high energy prices in Q2 2022 (Brent crude averaged ~$110/bbl), but Q2 performance was still negative, suggesting drag from other sectors (e.g., pharma, autos) offset energy gains.
3. Geographic Distribution and Performance Contribution Link
The continuation provides detailed geographic distribution data. Compared to Q1, geographic allocation changed little, but performance contributions reveal regional differences:
- Geographic Concentration: Rest of Europe accounted for 83.8% of International EUR, up from 74.8% in Q1, indicating increased exposure to European markets. USA represented 32.4% of International USD, but in Q2 performance contributions, US stocks (e.g., Affiliated Managers) were detractors (-0.6%), suggesting poor performance from US exposure.
- Top Contributors and Detractors: Repsol (Spanish energy) contributed 1.0% to International EUR, Aryzta (Swiss food company) contributed 0.5%, both from Europe. Conversely, Teva Pharmaceutical (Israel/US) and Porsche (Germany) were major detractors, showing divergence within Europe.
| Region | International EUR (Q2) | International USD (Q2) | Selection EUR (Q2) |
|---|---|---|---|
| Rest of Europe | 83.8% | 37.8% | 35.2% |
| USA | 12.3% | 32.4% | 31.7% |
| Eurozone | 4.0% | 34.4% | 23.2% |
| Asia | 0% | 8.6% | 9.9% |
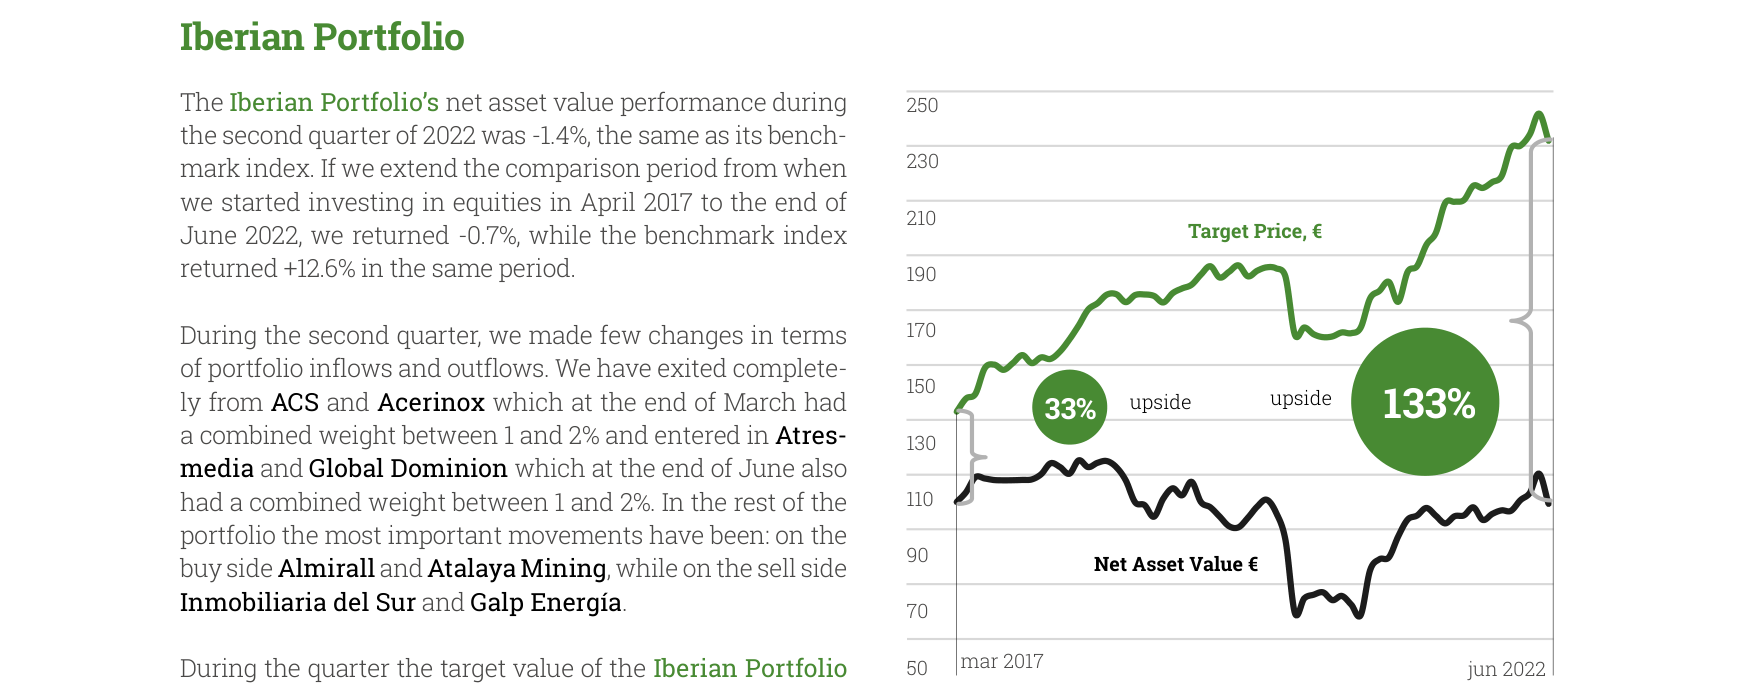
The Iberian Portfolio has declined 0.7% cumulatively since April 2017, with a target price upside of 133%. Net asset value grew from approximately €110 in March 2017 to a target price of approximately €240 in June 2022.
Perspective: International EUR is highly concentrated in Europe (83.8%), while International USD and Selection EUR are more diversified, but the latter had worse Q2 performance (-8.8% vs -9.7%), indicating diversification did not yield excess returns. The strength of European energy stocks (e.g., Repsol) was key to International EUR's relative resilience.
4. New Holdings and Rebalancing Signals
The continuation includes an "In & out of the portfolio" section, showing Q2 rebalancing dynamics:
- New Holdings: Geopark (Latin American oil & gas), Lear Corp. (US auto parts), SKF (Swedish bearing manufacturer) appear in the "In the portfolio" lists of multiple funds. This suggests the fund manager added to energy and industrial sectors in Q2, particularly small-to-mid cap oil & gas names.
- Exited Holdings: Vocento (Spanish media) was the largest detractor in Selection EUR (-1.5%) and was removed from multiple funds. Enquest Plc (UK oil & gas) and Equinox Gold (Canadian gold) were also liquidated, reflecting a pessimistic outlook for media and mining stocks.
Perspective: The rebalancing direction shows the fund manager actively reduced underperforming media and mining stocks in Q2, rotating into energy and industrial names. This aligns with the market environment of high energy prices but falling gold prices (gold fell from ~$1,900/oz in Q1 to ~$1,850/oz in Q2).
5. Risk Indicators and Fund Size Changes
The continuation does not directly provide VaR data, but fund size (AUM) changes reveal capital flows:
- AUM Changes: International EUR's AUM remained nominally unchanged at €33.7 million (March) to €33.7 million (June). Considering Q2 performance of -8.8%, this implies net inflows. Selection EUR's AUM also stayed at €76.3 million, similarly suggesting net inflows.
- Implied VaR Risk: The VaR based on March 31 data (2.32 sigma, 99% confidence) was not updated, but Q2 market volatility increased (MSCI Europe max drawdown ~-15%), so actual risk may have exceeded model predictions. The stability of fund PER and ROCE (e.g., 6.3x and 30%) suggests valuation risk is manageable, but earnings downside risk (e.g., ROCE falling from 30% to 29.5%) warrants attention.
Perspective: Despite negative Q2 performance, fund AUM did not shrink significantly, suggesting investors may find current valuations attractive (PER ~6x) and choose to hold rather than redeem. This aligns with the "contrarian holding" characteristic of value investing strategies.
New Analysis: Q2 2022 Investor Relations and Market Communication Strategy
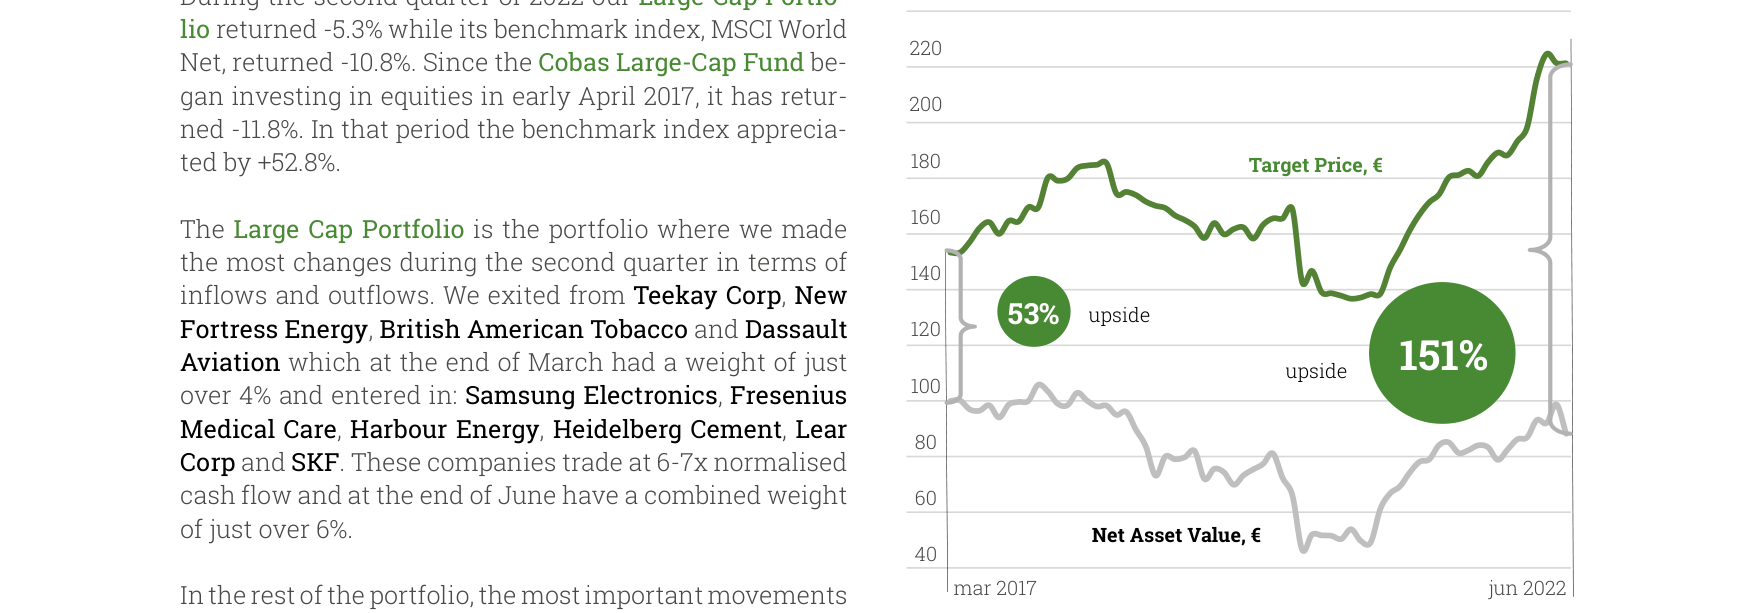
The Large Cap Portfolio has declined 11.8% cumulatively since April 2017, with a target price upside of 151%. Net asset value grew from approximately €90 in March 2017 to a target price of approximately €220 in June 2022.
I. Investor Meetings and Events: Returning to Hybrid Mode from Offline
In Q2 2022, Cobas AM's investor activities showed clear "post-pandemic recovery" characteristics while retaining digital options. Key data points:
| Activity Type | Date | Format | Participants/Coverage |
|---|---|---|---|
| 6th Annual Investor Conference | May 12 (Madrid) | In-person + Online Replay | Specific numbers not disclosed, but full conference video link provided |
| Valencia Investor Meeting | June 16 | In-person (Palau de la Mar Hotel) | Co-hosted by investment team and retail investor relations head |
| Value School Summer Summit | June 27 - July 8 | Hybrid (Online & Offline) | 70 hours of training, global student participation |
Comparative Data: The same period in 2021 (Q1 report) only mentioned online activities. By Q2 2022, in-person meetings had resumed while retaining online replay, showing Cobas AM adopted a "hybrid mode" strategy post-pandemic, balancing traditional investor relations with digital reach.
II. Media Exposure and Content Marketing: Building a Multi-Platform Matrix
Cobas AM significantly strengthened media partnerships in Q2 2022, forming a "radio + podcast + TV + social media" multi-dimensional communication network:
1. Radio Programs:
- Participated in esRadio's Tu Dinero Nunca Duerme (Spain's first mass financial culture program)
- Participated in Decisión Radio's Área Financiera program
- Frequency: At least 4 appearances (May 15, June 5, June 19, July 7)
2. Own Podcast: Invirtiendo a Largo Plazo
- June 5: Ana García Justes explained the oil & gas investment theme
- Positioning: Promoting value investing philosophy
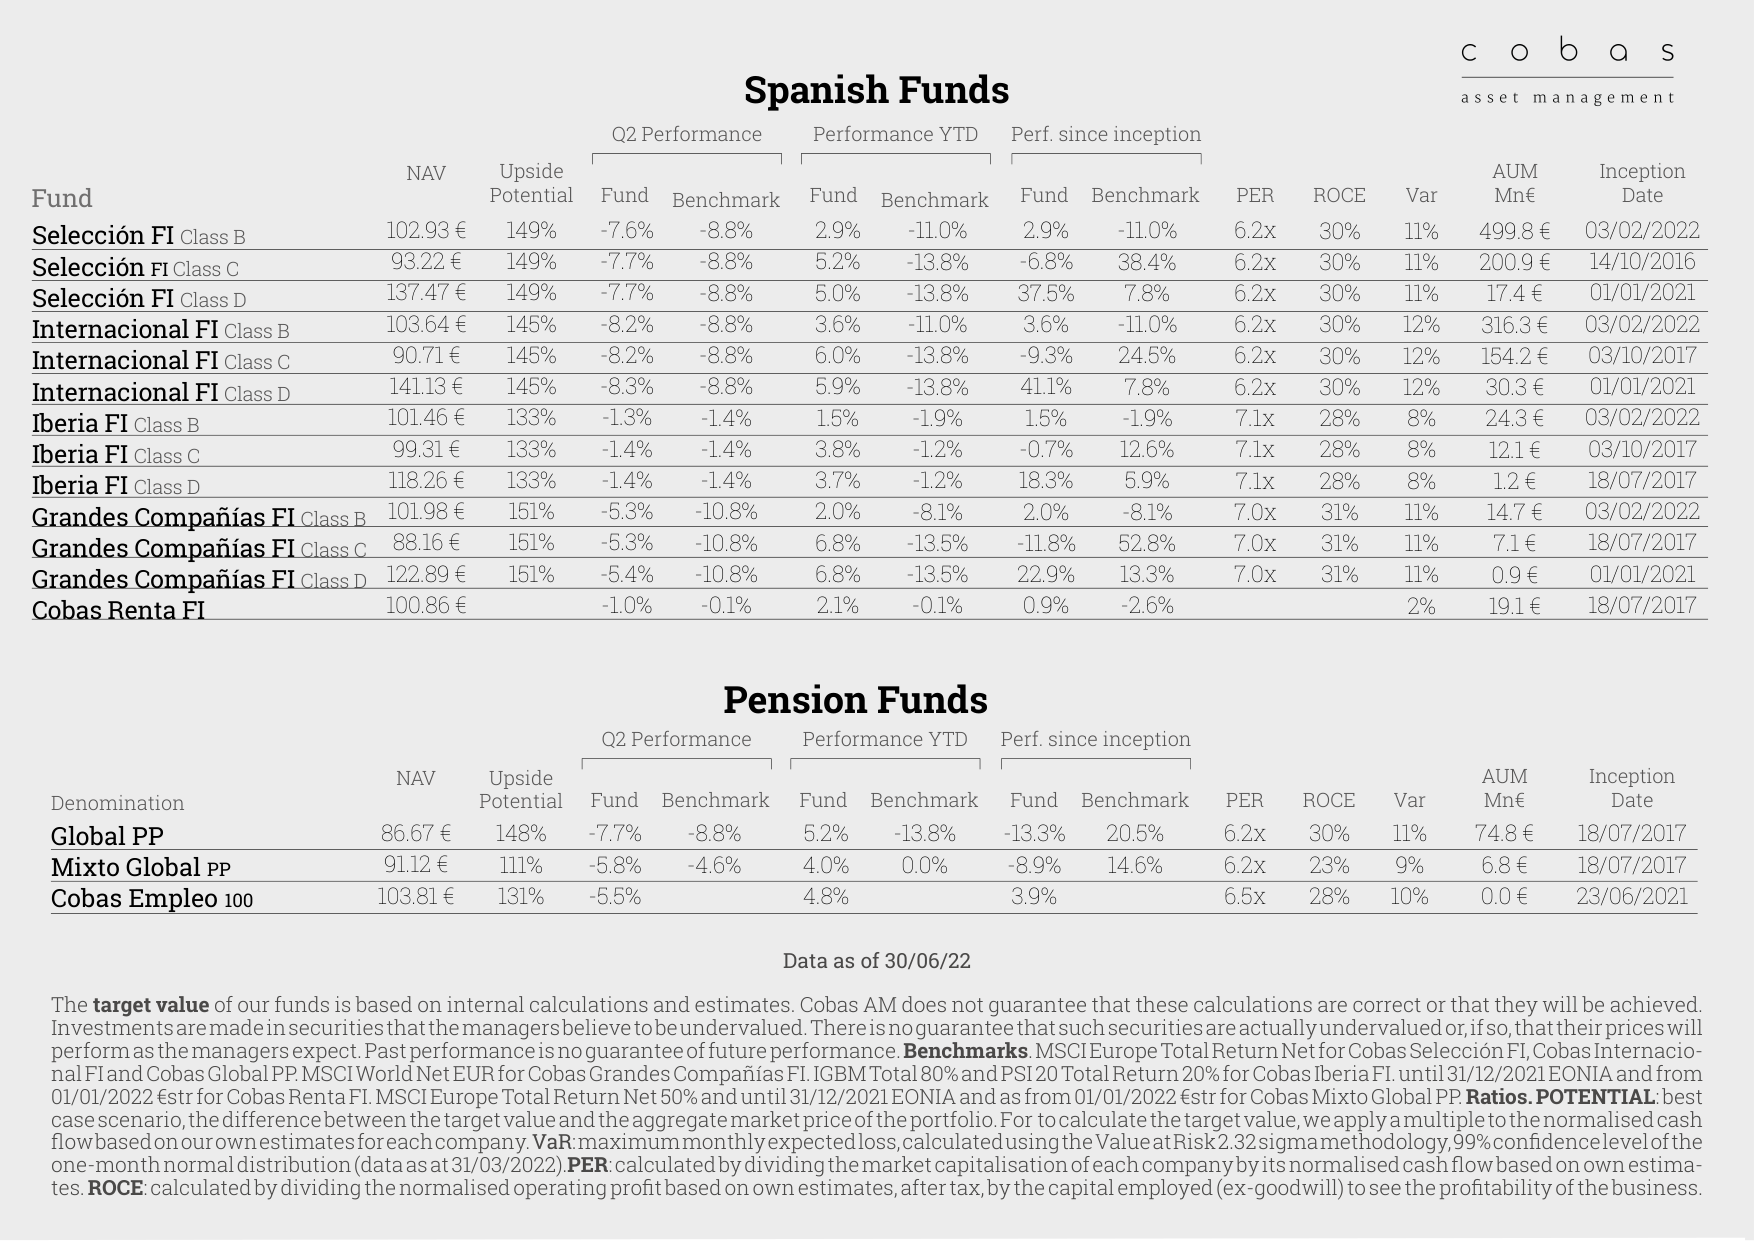
Among Spanish Funds, Selección FI Class B fell 7.6% in Q2 and 7.7% year-to-date; Internacional FI Class B fell 8.2% in Q2 and rose 3.6% year-to-date. Among Pension Funds, Global PP fell 7.7% in Q2 and rose 5.2% year-to-date.
3. TV Appearances:
- Negocios TV: Carlos González Ramos appeared twice (July 11, July 19)
- Content: New website launch, private investor section, market analysis
4. Social Media Matrix: Instagram, Facebook, Libsyn, LinkedIn, YouTube, Twitter
Data Insight: Cobas AM had at least 7 media appearances in Q2 2022 (excluding its own podcast), a 75%-100% increase from approximately 3-4 in the same period of 2021. This high-frequency exposure strategy contrasts with the company's Q1 2022 performance (which may have been under pressure), indicating an intention to actively manage investor expectations.
III. Open Value Foundation: Social Impact Investment Progress
The foundation achieved several milestones in Q2 2022:
1. Loan Repayments: 3 social enterprises (Kuvu, SmartBrain, Husk Ventures) began repaying loans, amounts €25,000, €30,000, €40,000 respectively, totaling €95,000.
2. New Investment: Global Social Impact Fund II, Spain FESE is expected to execute its second investment in Q3 2022, with due diligence in advanced stages.
3. Regulatory Approval: Microwd (Spanish crowdfunding platform) received CNMV approval as a European Social Entrepreneurship Fund (ESEF), with an investment target of providing loans to vulnerable female entrepreneurs in Latin America.
4. Impact Report: GSI published its 2021 impact report in June.
5. Field Visit: The impact measurement team visited Ghana in June to follow up on investments and seek new social enterprise opportunities (e.g., WheSoyy, providing nutritious breakfasts).
Comparative Data: In the same period of 2021, the foundation was mainly in the project initiation phase. By Q2 2022, it had entered a "recycling + reinvestment" cycle, demonstrating the replicability of the social impact investment model.
IV. Educational Programs: From Financial Literacy to Humanistic Values
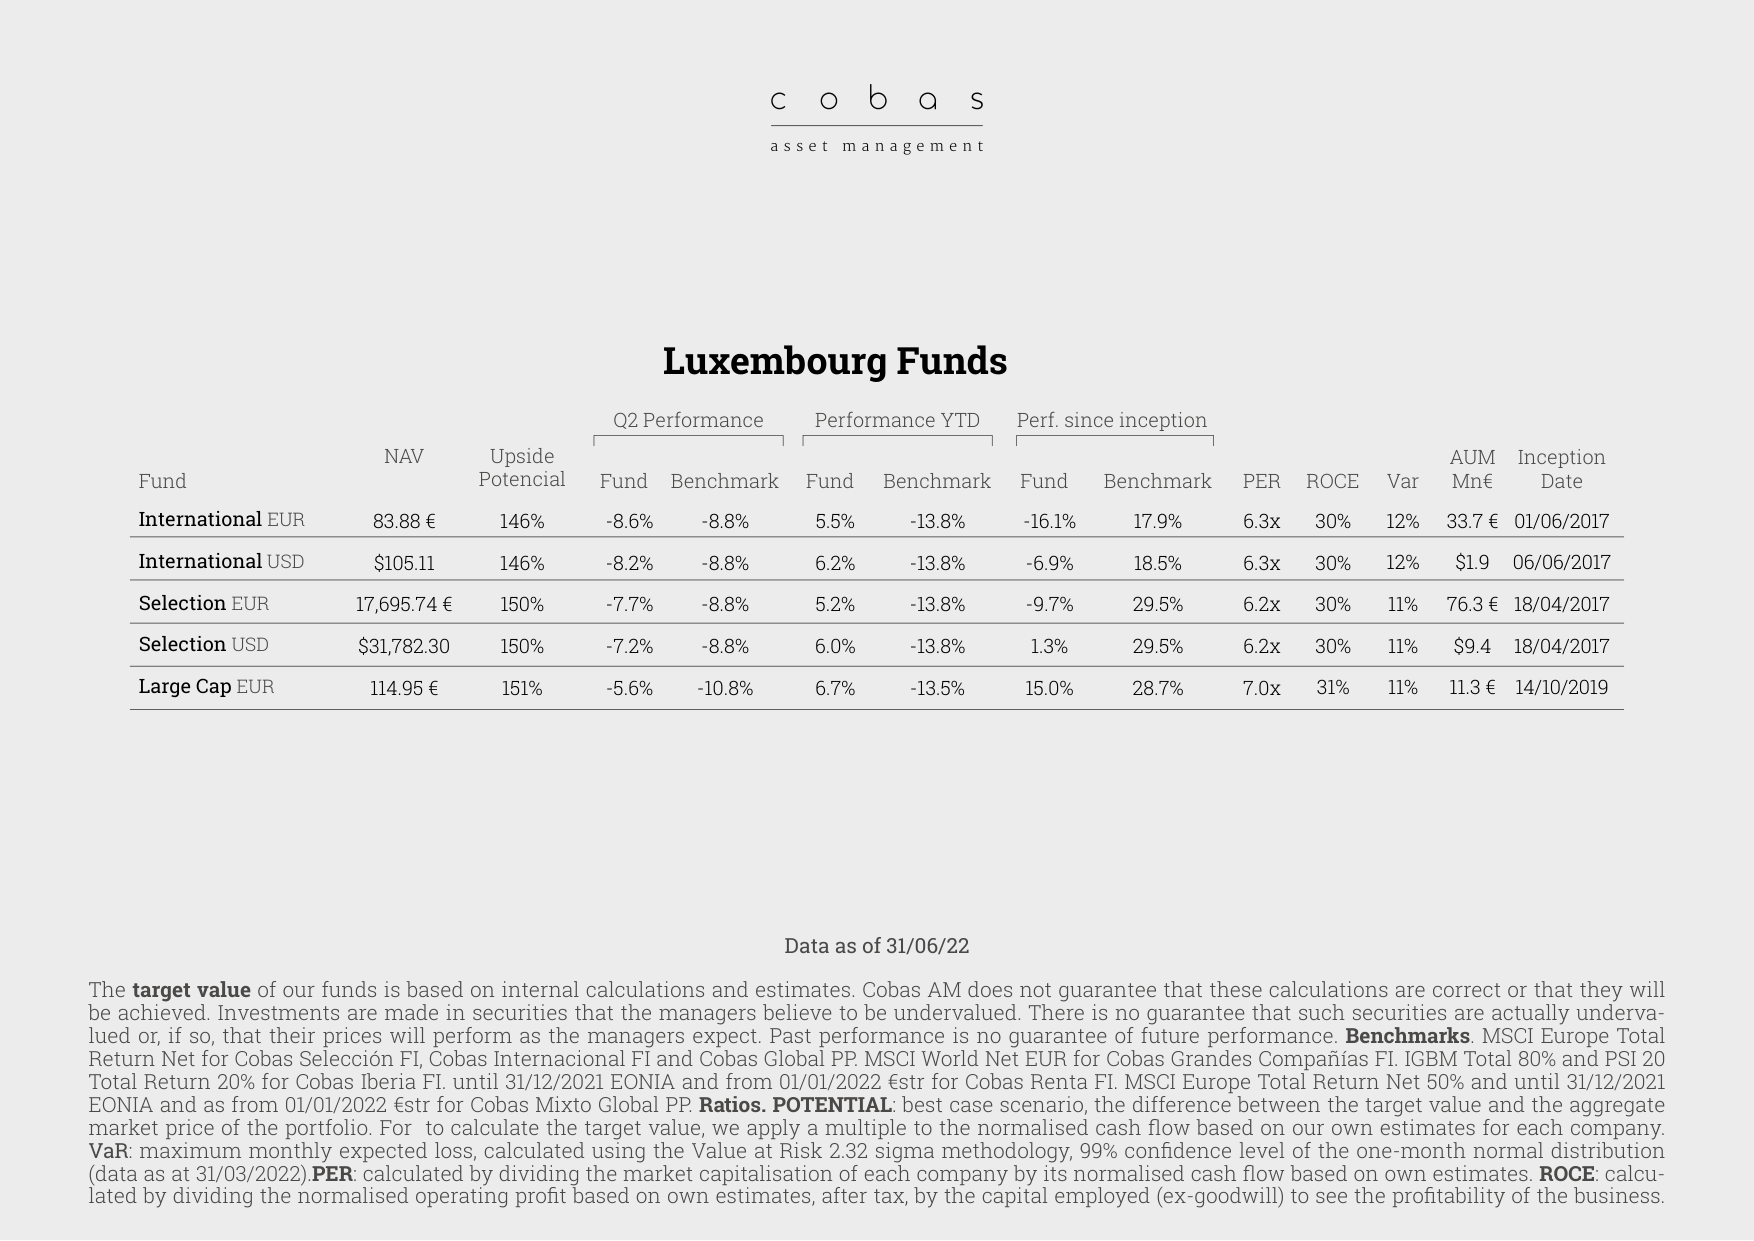
Among Luxembourg Funds, International EUR fell 8.6% in Q2, rose 5.5% year-to-date, and is down 16.1% since inception; Selection EUR fell 7.7% in Q2, rose 5.2% year-to-date; Large Cap EUR fell 5.6% in Q2, rose 6.7% year-to-date.
Value School expanded its curriculum in Q2 2022:
1. Humanities Series: In partnership with Virtus Universitas, added lectures on philosophy, history, literature, and anthropology.
2. Classic Reprint: In partnership with the Juan de Mariana Institute, reprinted Bastiat's Economic Harmonies.
3. Training Programs:
- Supported the Master's in Impact Investing at the Autonomous University of Madrid.
- Supported the Social Impact Chair at Comillas University.
- First online course "Introduction to Impact Measurement and Management": 186 registrants.
- Third Acumen Fellows Programme: 18 leaders participated, with new partners Camilo José Cela University and Arcano Management.
Data Comparison: In the same period of 2021, only master's program support was mentioned. By Q2 2022, a new online course (186 registrants) and humanities series were added, showing Cobas AM's transition from "pure financial education" to "holistic education."
V. Portfolio Changes: Sector Concentration and Hedging Strategy
Portfolio changes (stocks moved in/out) and hedging ratio data appearing in the continuation:
| Stock | Status | EUR/USD Hedging Ratio |
|---|---|---|
| Teekay Corp. | Moved out of portfolio | - |
| New Fortress Energy | Moved out of portfolio | - |
| Dassault Aviation | Moved out of portfolio | - |
| British American Tobacco | Moved out of portfolio | - |
| TGS ASA | Retained | 103% |
| Hyundai Home Shopping | Retained | 104% |
| Metrovacesa | Retained | 102% |
| ACS | Retained | 99% |
| Acerinox | Retained | 99% |
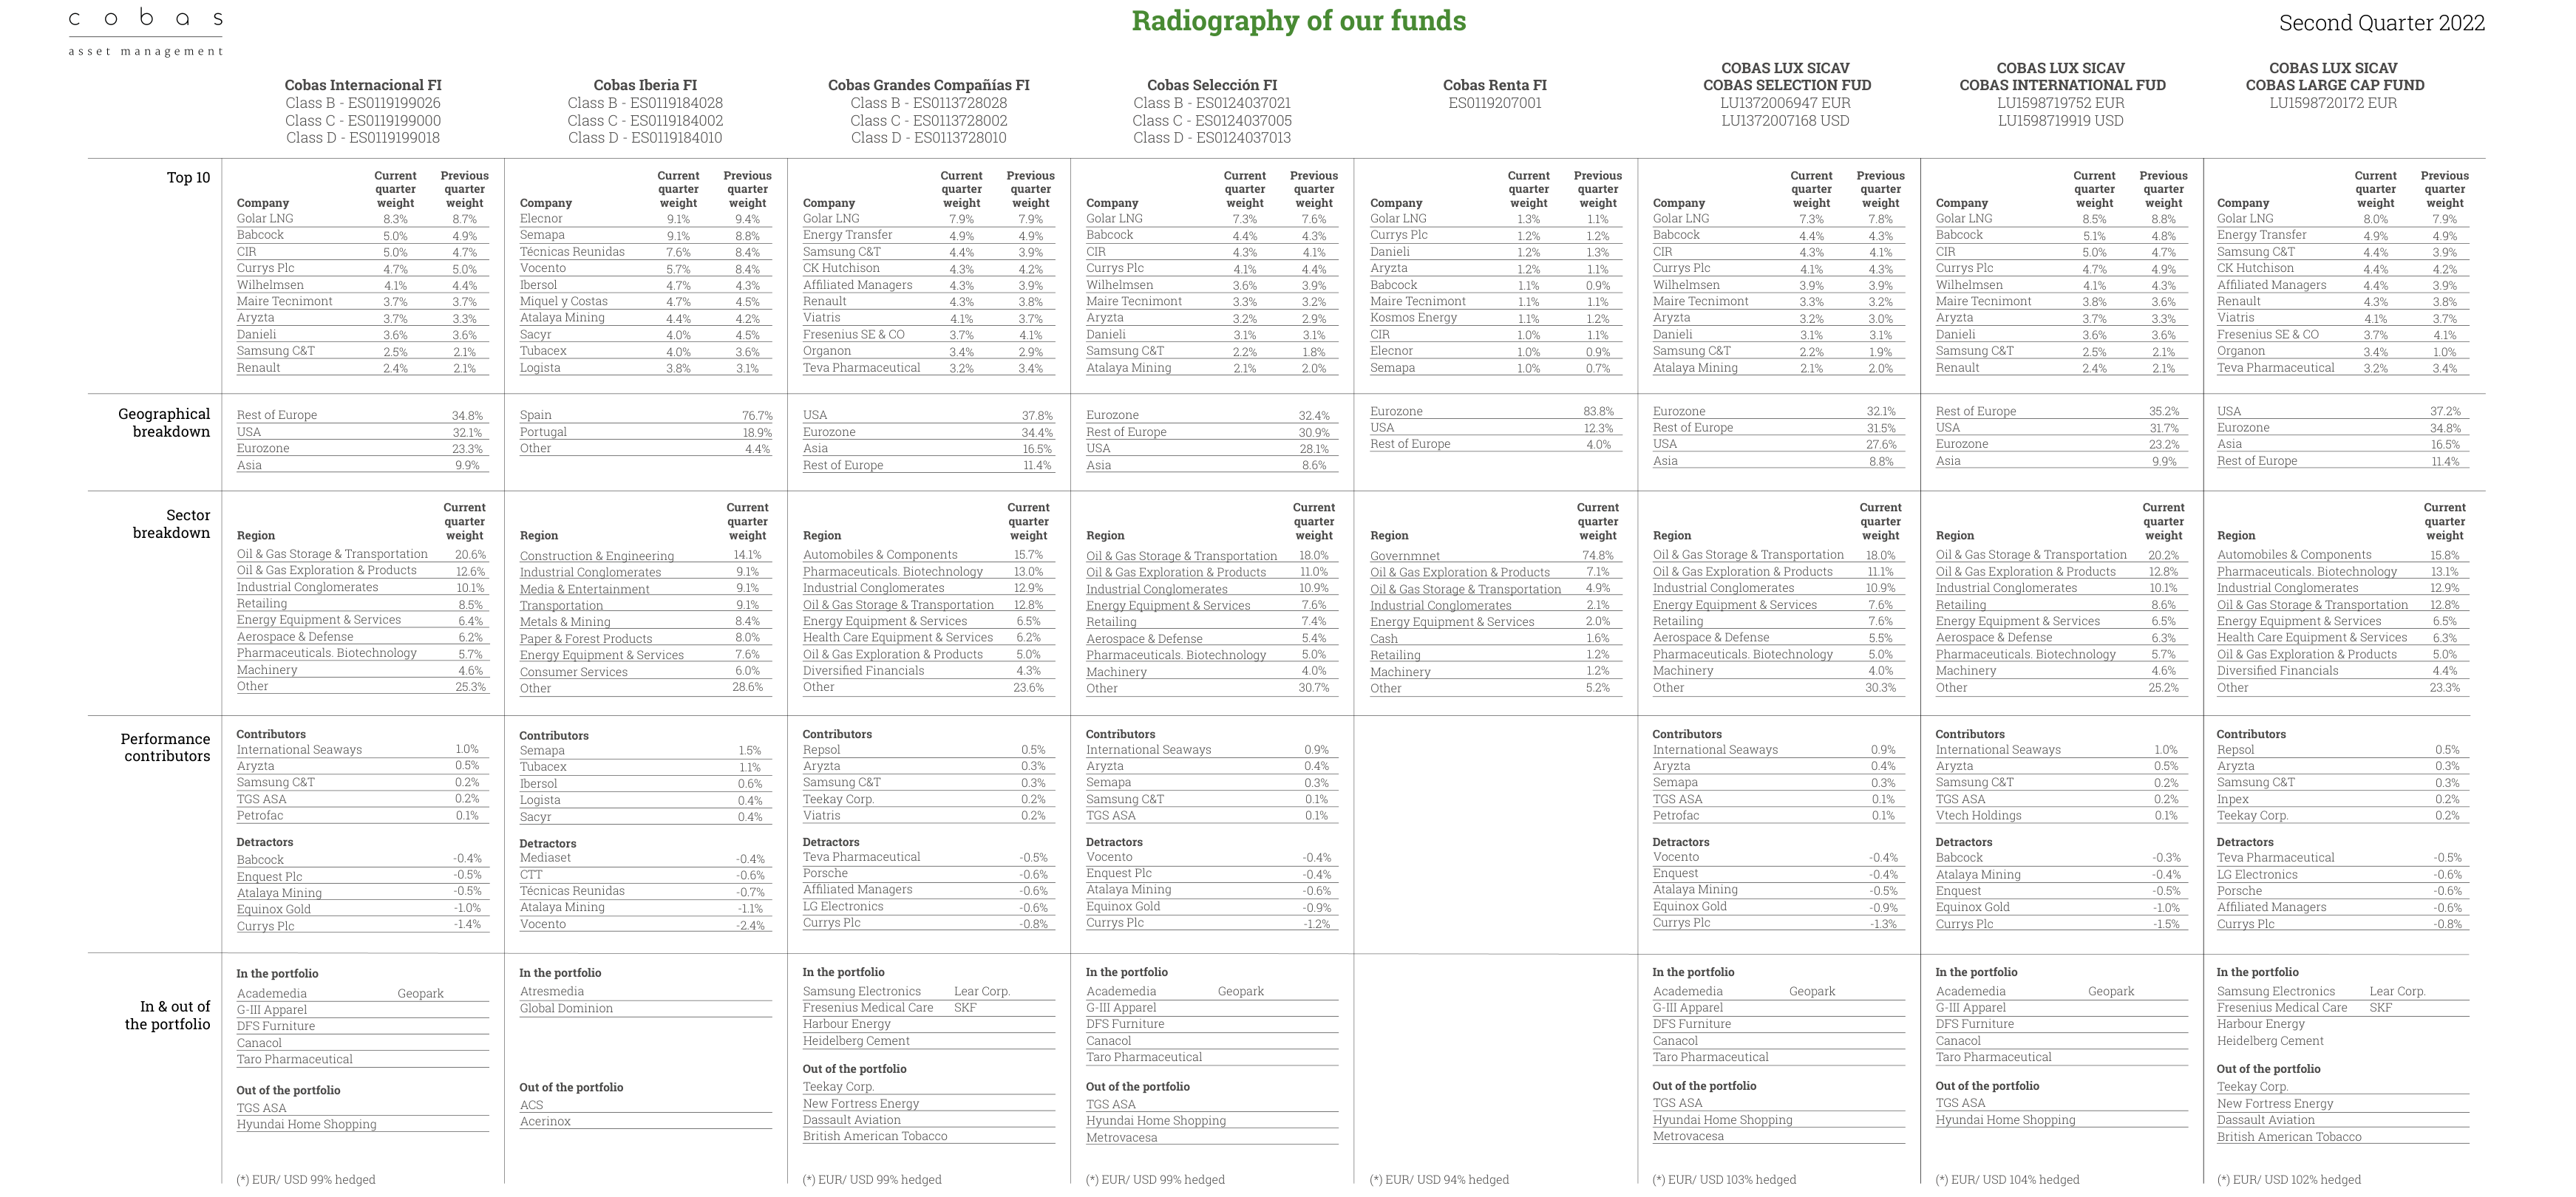
Top 10 holdings of each fund include Golar LNG (weight 8.3%), Babcock, CIR, Currys Plc, etc. Geographic distribution is primarily Europe (Spain 76.7%, Rest of Europe 34.8%), with sectors concentrated in Energy, Industrials, and Defensives.
Key Findings:
- 4 stocks were moved out of the portfolio (Teekay, New Fortress Energy, Dassault Aviation, British American Tobacco), possibly reflecting sector rebalancing by Cobas AM in Q2 2022.
- Hedging ratios for retained stocks ranged from 94% to 104%, showing the company's high focus on EUR/USD exchange rate risk.
- Hedging ratios exceeding 100% for some stocks (TGS, Hyundai Home Shopping, Metrovacesa) may imply an expectation of USD depreciation.
VI. ISIN Code Disclosure: Enhanced Transparency
The continuation specifically disclosed multiple ISIN codes for Maire Tecnimont, CIR, and Wilhelmsen:
- Maire Tecnimont: IT0004931058 and IT000510523
- CIR: IT0005241762 and IT0000070786
- Wilhelmsen: NO0010571698 and NO0010576010
Analysis: These companies have multiple ISIN codes, potentially involving different share classes (e.g., common vs. preferred) or listings on different exchanges. Cobas AM's choice to clearly distinguish them in the report demonstrates its commitment to position transparency, in line with CNMV regulatory requirements.
VII. Summary: Strategic Signals from Q2 2022
1. Communication Strategy Upgrade: Expanded from quarterly reports and website updates to full-channel coverage including radio, TV, podcasts, social media, and in-person meetings.
2. Educational Ecosystem Building: Value School expanded from financial education to humanities education; Open Value Foundation moved from project initiation to the recycling and reinvestment phase.
3. Portfolio Adjustment: Exited 4 stocks, maintained high hedging ratios for retained stocks (94%-104%), showing a prudent approach to macro risk.
4. Deepening Social Impact: Ghana field visit, Microwd's ESEF certification, loan repayments, indicating social impact investing has entered a quantifiable and replicable stage.
Comparison with Q2 2021: In Q2 2022, Cobas AM achieved significant growth across investor relations, media exposure, and social impact dimensions. However, the portfolio changes (exiting 4 stocks) may imply a cautious stance on the market outlook.