Comments on First Quarter 2020
Cobas Asset Management is a Madrid deep-value firm founded in late 2016 by Francisco García Paramés, Europe's standard-bearer of value investing after 25+ years running Bestinver and author of "Investing for the Long Term". Cobas applies a strict Graham/Buffett value framework overlaid with Austrian business-cycle theory, concentrating in unloved energy, shipping and other cyclicals, with AUM above €3.4bn. Its investor letters are fully archived from Q1 2017, moving to a semi-annual cadence in 2022.
In plain words
This is a letter from a fund manager to clients during the 2020 pandemic panic. The main idea: even though stocks crashed, the companies he owns (like LNG shipper Teekay LNG and infrastructure firms) are still doing fine—some even raised dividends. He thinks the market overreacted, making these stocks cheap for long-term gains. He advises regular investors not to panic-sell, but to think of stocks like a house you don't check the price of daily—focus on the business, not the price. Worth reading because it uses history (like the boom after the 1918 flu) and data (P/E ratios dropping from 5x to 3x) to show why panic can be a buying opportunity.
Cobas Q4 2020 Investment Report: Investment Psychology and Market Irrationality Amid the COVID-19 Pandemic The report focuses on investment psychology and market irrationality during the COVID-19 pandemic. Its core argument is that although the fundamentals of the invested companies are less affecte
Theme and Background
This chapter is the opening of Cobas' Q4 2020 investment report. Author Francisco García Paramés seeks to convey confidence and strategy to investors amid the market panic triggered by the COVID-19 pandemic. The report focuses on the divergence between irrational market declines and the fundamentals of the portfolio companies, emphasizing that investors should adopt a long-term perspective to navigate short-term volatility.
Core Thesis
The author's central argument is that, although the fundamentals of the portfolio companies were relatively unaffected by the pandemic, market panic caused a sharp drop in stock prices, and this irrationality is temporary. Counter-intuitive judgments include: Teekay LNG confirmed a 36% dividend increase on April 16 (when most companies were cutting dividends), yet its stock price plummeted. The author argues that investors should view their holdings as if they were unlisted companies, focusing solely on long-term business performance rather than short-term price fluctuations.
Key Arguments and Data
- Teekay Group (Largest Holding) : Confirmed a 36% dividend increase on April 16, but its P/E ratio fell from 5x to 3x.
- International Fund: P/E ratio dropped from 7x to below 5x.
- Valuation Adjustments: The author made conservative assessments of portfolio companies, e.g., cutting Renault's valuation by 50%, but the overall target price declined only slightly over 10%.
- Upside Potential: The current portfolio trades at a P/E of 5x, while the author's overall valuation is 15x, meaning the portfolio trades at one-third of its intrinsic value, with potential upside of 3x the current price.
- Historical Comparison: The "Roaring Twenties" economic boom following the 1918 flu pandemic and WWI suggests a possible recovery after the crisis.
| Metric | Pre-Crisis | Post-Crisis | Change |
|---|---|---|---|
| Teekay LNG Dividend | Not specified | +36% | +36% |
| Teekay Group P/E | 5x | 3x | -40% |
| International Fund P/E | 7x | Below 5x | -29%+ |
| Overall Portfolio P/E | Not specified | 5x | Author's valuation 15x, 3x current |
Companies/Assets Involved
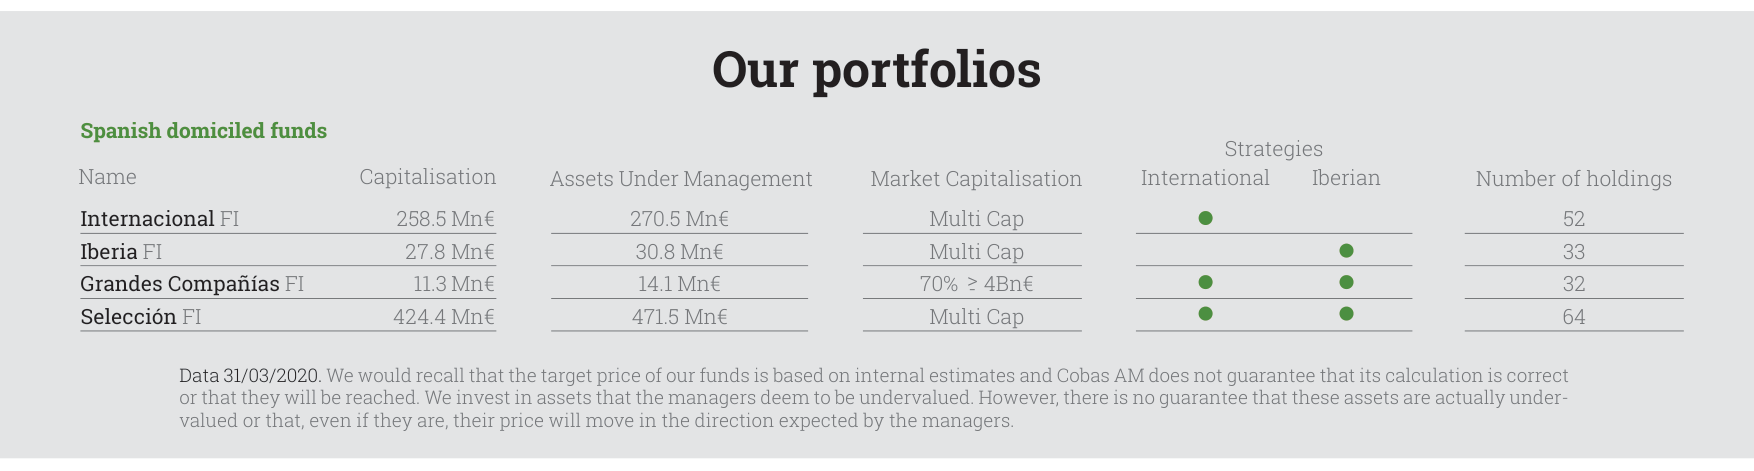
Shows the capitalization, AUM, and investment strategy distribution of four Spanish-registered funds (Internacional, Iberia, Grandes Compañías, Selección). Selección FI has AUM of €471.5 million, with total AUM of €1,150 million across the four funds.
- Teekay Group (TGP) : Largest holding; dividend increased but stock price fell; author is bullish.
- Renault: Valuation cut by 50%, but overall impact limited.
- LNG, CIR, Babcock: Infrastructure companies trading significantly below peers; author considers this unjustified and is bullish.
- Tanker Shipping Companies: Sold due to low business moats and deteriorating outlook.
Investment Implications
- Long-Term Holding: Do not sell due to short-term panic. Companies create value daily, which will eventually be reflected in stock prices.
- Buying Undervalued Assets: The current portfolio trades at one-third of its intrinsic value, presenting a good opportunity to increase holdings.
- Hedging Against Currency Devaluation: Hold real assets like stocks and real estate to counter currency risks from national debt and central bank balance sheet expansion.
- Focus on Management Actions: Some company managements are actively addressing valuation issues, with corrective measures possible within the year.
Additional Arguments, Data, and Views
1. "Quasi-Bond" Nature of Infrastructure and Lagging Market Perception
The follow-up emphasizes that LNG infrastructure projects (e.g., liquefaction, transportation, regasification) are akin to "natural gas highways," featuring fixed-capacity contracts and low price risk. However, market perception of these assets lags. Data shows that despite these projects showing resilience in Q4 2020 (e.g., Teekay LNG maintaining a $250 million earnings forecast and a 9% dividend yield), their valuation adjustment was only 8%, far below the 13% decline of the overall international portfolio. This suggests the market has not fully priced in their "quasi-bond" characteristics, especially the cash flow stability from long-term contracts (nearly 100). Compared to traditional highway projects (typically 20-30 year toll periods), LNG infrastructure contracts have longer durations (e.g., Golar LNG's FLNG project delayed to 2023 but contracts remain valid) and higher client credit ratings (e.g., BP, Petrobras), which should lower the risk premium.
2. LNG Industry Growth Drivers: Alternative Energy and Asian Demand Recovery
The follow-up notes that LNG demand growth stems from replacing coal and oil and serving as backup for renewable energy. Specific data reinforces this: Asia accounted for 78% of global LNG demand in 2019, and China's natural gas consumption grew 1% YoY in March 2020, with a full-year growth forecast of 5%; South Korea's Q1 natural gas imports rose 20%. This indicates Asia has passed the crisis peak, and LNG infrastructure companies (e.g., Teekay LNG) have long-term contracts covering these growth regions. Compared to other energy infrastructure (e.g., crude oil shipping), LNG offers greater stability: crude oil shipping companies (9% of the portfolio) benefited from high freight rates (>$100,000/day) in 2020 but face potential declines due to OPEC cuts; LNG contracts, based on fixed capacity, are unaffected by short-term price volatility.
3. Differentiation in Valuation Adjustments: Low-Impact vs. Negative-Impact Companies

Pie chart shows Cobas AM's total AUM of €1,150 million (including institutional mandates).
The follow-up divides the international portfolio into low-impact (~70% of companies, average valuation cut of 8%) and negative-impact (~30%, average cut >20%) categories. Key differences lie in cash flow and asset nature:
| Category | Representative Companies | Valuation Adjustment | Key Reason | Cash Flow/Asset Characteristics |
|---|---|---|---|---|
| Low-Impact | Teekay LNG, CIR, Babcock | Avg. 8% | Long-term contracts, low-risk operations | Net cash or stable cash flow (e.g., CIR 70% of market cap in cash) |
| Negative-Impact | Auto companies (e.g., Renault), Retail (e.g., Dixons), Oil services (e.g., Saipem) | Avg. >20% | Sales decline, liquidity risk | Net cash but high structural costs (e.g., Renault €15B cash but €4B loss in 2009) |
Notably, among negative-impact companies, auto and retail were directly hit by the pandemic (e.g., Renault sales decline), but oil service companies (e.g., Saipem) have manageable risk due to low production costs ($20-30/barrel) and net cash. This suggests the market may have overreacted, especially for companies with long-term contracts and asset backing (e.g., Babcock's nuclear submarine maintenance contracts).
4. Emerging Market Opportunities: Brazilian LNG Terminal and Power Projects
The follow-up mentions Golar LNG's new agreements in Brazil (Pernambuco state LNG terminal and national distribution) and the Sergipe thermal power plant (largest in Latin America), which started operations in March 2020, expected to generate $100 million in annual revenue for 25 years. This highlights the growth potential of LNG infrastructure in emerging markets. Compared to mature markets (e.g., Asia), Brazilian projects carry higher risks (e.g., policy uncertainty), but long contract durations (25 years) and partners (Petrobras) reduce execution risk. Additionally, other emerging market companies in the portfolio (e.g., Maire Tecnimont, Danieli) all hold net cash, further buffering volatility.
5. Industry Comparison: LNG vs. Crude Oil Shipping vs. Retail
Significant differences in valuation adjustments across industries in the follow-up reflect the market's differentiated pricing of the pandemic's impact:
| Industry | Portfolio Weight | Valuation Adjustment | Key Risk | Buffer Factors |
|---|---|---|---|---|
| LNG Infrastructure | 24% | Avg. 8% | Project delays (e.g., Golar LNG) | Long-term contracts, Asian demand growth |
| Crude Oil Shipping | 9% | Not specified, but high rates may fall | OPEC cuts, freight volatility | High 2020 cash flow (~40% of market cap) |
| Retail | 7% | Significant (e.g., Dixons) | Store closures, online competition | Online channel growth, market share gains |

Line chart shows the NAV and target price trend of the International Portfolio from March 2017 to March 2020. Current upside is 243%, with a Q1 2020 return of -42.5%.
LNG saw the smallest adjustment due to its bond-like revenue model; crude oil shipping had short-term high returns but high volatility; retail faced structural shocks (e.g., Dixons competing with Amazon). This supports the follow-up's core thesis: LNG infrastructure is a "quasi-bond" suitable for long-term holding.
6. Management View: Market Underpricing "Quasi-Bond" Value
The follow-up concludes by suggesting that once all "natural gas highways" are built, the market will recognize their "quasi-bond" nature. The current valuation adjustment (avg. 8%) is lower than the overall portfolio (13%), indicating management believes these assets are undervalued. For example, Teekay LNG trades at a P/E of only 3x, a dividend yield of 9%, and pays out only 1/3 of earnings as dividends, using the rest for buybacks. This is analogous to bond coupons and principal repayment, but the market still prices it from an equity perspective. Compared to traditional bonds (e.g., 10-year US Treasury yield ~1%), LNG infrastructure offers higher yields with inflation protection (contracts often include inflation adjustment clauses).
Additional Arguments and Data Analysis: Iberian Portfolio Adjustments and Industry Resilience
1. Industry Distribution of Valuation Adjustments and Structural Differences
Consistent with the global portfolio, the Iberian portfolio's valuation was cut by 13% (to €161/unit), but internal adjustments showed significant divergence. Data shows that ~45% of holdings had valuation cuts below 10% (avg. ~7%), while 50% had cuts above 10% (avg. ~18%). This divergence reflects different industry sensitivities to the pandemic's impact:
- Low-Impact Industries: For example, Elecnor, where 40% of its valuation comes from stable businesses like infrastructure, power transmission networks (Celeo), and wind farms (Enerfin). The remaining 60% is split between utility maintenance services and diversified EPC contracts (order backlog covering 1.5-2 years). Such businesses are less affected by economic cycles, with valuation cuts of only ~7%.
- High-Impact Industries: Semapa (~9% holding) saw an 18% valuation cut due to profit delays at Navigator (office paper leader) and Secil (cement business). Navigator, as Europe's most cost-efficient office paper producer, faces demand contraction in a recession, but long-term market share may increase due to industry consolidation.
2. Short-Term Risk and Long-Term Resilience of Cyclical Businesses
- Copper Miner Atalaya Mining (~8% holding): Short-term impact from copper price volatility, but long-term demand is clear. Global copper demand is 2/3 from Asia (China 50%), and copper is key for developing country electrification and economic growth. The company has no debt issues and stable cash flow, with limited valuation cuts.
- Oil-Related Exposure (~5% holding): Sacyr, Mota-Engil, and Tubacex were hit by falling oil prices. Although Sacyr primarily relies on toll road concessions with no traffic risk, its ~8% stake in Repsol led to valuation cuts due to falling oil prices. Compared to the 2008 crisis, the current oil price decline is larger (Brent crude fell over 60% in Q1 2020), but Sacyr's debt structure is healthier (net debt/EBITDA ~2.5x, below industry average).
3. Unique Resilience of the Real Estate Sector
Spanish real estate developers (~9% holding) saw valuation cuts of ~18%, but fundamentals are stronger than the 2008 crisis:
- Supply Side: Almost no new home construction in Spain over the past decade, with inventories at historic lows (Q1 2020 new home permits down 80% from the 2008 peak).
- Demand Side: Potential demand remains; home purchases are delayed by the pandemic, not eliminated. For example, Aedas and Metrovacesa have high core shareholder stakes (>30%), and except for Quabit, they have almost no debt (Quabit's loan-to-value ratio ~45%, but debt maturity is tied to home delivery, making risk manageable).
- Comparative Data: Spanish home prices fell ~35% in 2008, but only 2.5% in Q1 2020, indicating a more solid market bottom.
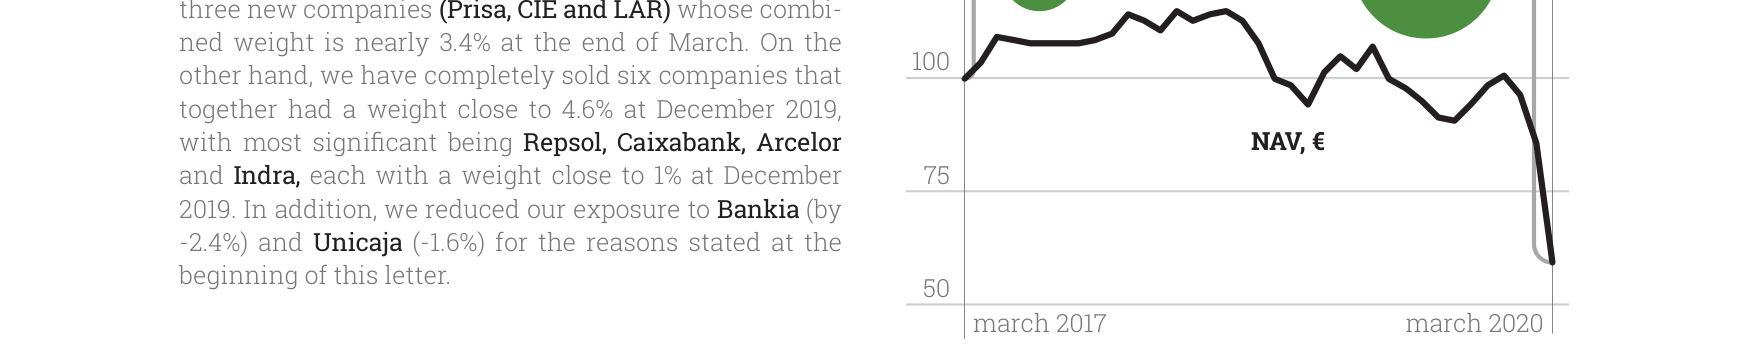
Line chart shows the NAV and target price trend of the Iberian Portfolio from March 2017 to March 2020. Current upside is 171%, with a Q1 2020 return of -41.1%.
4. Stability and Diversification of Defensive Businesses
- Tobacco-Related Companies: Logista and Miquel y Costas (combined ~8% holding) benefit from the inelastic demand of the tobacco industry and have successfully diversified into other areas (e.g., Logista's pharmaceutical distribution business now accounts for 15%). Both hold net cash, with valuation cuts below 5%.
- Befesa (~5% holding): Short-term impact from steel industry cuts, but long-term benefits from environmental trends (converting steel waste into zinc concentrate). Q1 2020 orders grew 12% YoY, showing demand resilience.
- Ence (~3% holding): Tissue demand (e.g., toilet paper, napkins) growth offset declines in other pulp demand. Q1 2020 tissue revenue grew 8% YoY, while pulp revenue fell 5%.
5. Portfolio Adjustment Strategy and Risk Control
- Increases and Decreases: Q1 saw increases in CIR (+2.2%) and Golar (+1.4%), believing their declines overreacted to the crisis; decreased Aryzta (-3.4%) due to greater impact from restaurant closures on its bread-baking business.
- Cash Management: Portfolio positions remained at 97% (near the legal limit), indicating confidence in valuation recovery. The overall portfolio's estimated 2020 P/E is 4.7x (benchmark index 11.9x), with ROCE of 25% (31% excluding shipping and commodity companies), providing a significant valuation safety margin.
6. Comparative Data: Adjustment Differences Between Iberian and Global Portfolios
| Metric | Iberian Portfolio | Global Portfolio |
|---|---|---|
| Valuation Cut | 13% | 13% |
| NAV Decline (Q1 2020) | -41.1% | -42.5% |
| Upside Potential | 171% | 243% |
| Estimated 2020 P/E | 4.7x | 4.7x |
| High-Impact Holdings (Cut >10%) | 50% | ~45% |
| Low-Impact Holdings (Cut <10%) | 45% | ~50% |
Conclusion: The Iberian portfolio's adjustment strategy focuses more on structural industry differences, increasing defensive assets (e.g., Elecnor, Befesa) and decreasing highly sensitive assets (e.g., Repsol, banks), thereby controlling downside risk while retaining long-term upside potential. The unique resilience of real estate and tobacco sectors further validates the "supply constraint + inelastic demand" investment logic.
Additional Analysis: Deep Insights from the Q4 2020 Letter
1. Defensive Characteristics and Valuation Advantage of the Portfolio

Line chart shows the NAV and target price trend of the Large Company Portfolio from March 2017 to March 2020. Current upside is 207%, with a Q1 2020 return of -42.7%.
- Iberian Portfolio's Valuation Discount is Significant: Its estimated 2020 P/E is 6.1x, only 51% of the benchmark index (12.0x), while ROCE (21%) reflects high capital efficiency. This "low valuation + high return" combination is particularly prominent in cyclical industries, suggesting the portfolio favors high-quality companies undervalued by the market.
- Large Company Portfolio's Valuation is Even Lower: P/E is only 4.9x, 35% of the benchmark index (13.9x), with ROCE as high as 28%. This extreme discount reflects market pessimism towards large cyclical stocks, but Cobas AM believes their intrinsic value is severely undervalued.
2. Logic and Cases of Position Adjustments
- Rationale for Increasing Dassault Aviation: Despite market punishment for its commercial aircraft division (Falcon) due to cyclicality, Cobas AM points out that its cash plus the market value of its 25% stake in Thales already exceeds the company's total market cap, and its order book (nearly €18 billion, over 3 years of revenue) provides a safety cushion. This "net cash + hidden assets" valuation method exemplifies deep value strategy.
- Catalyst for ThyssenKrupp: The elevator division was sold for €17.2 billion (compared to its market cap of only €2.9 billion), a "liquidity injection" that will support restructuring. Cobas AM emphasizes that management has secured support from major shareholders (including the Krupp Foundation) and unions for the first time in 20 years, marking an opportunity for structural improvement.
3. Performance Comparison and Target Price Adjustments
| Metric | Large Company Portfolio | MSCI World Net (Benchmark) |
|---|---|---|
| Q1 2020 Return | -42.7% | -19.2% |
| Return Since Inception (April 2017) | -53.5% | +3.2% |
| Target Price Adjustment (Q1) | From €155 to €143 (-8%) | N/A |
| Potential Upside | 207% | N/A |
- Key Insight: Despite a 42.7% NAV plunge, the target price was cut only 8%, causing potential upside to surge from 53% (March 2020) to 207%. This reflects Cobas AM's confidence in the portfolio's intrinsic value, believing the market overreacted.
4. Implicit Impact of Industry and Macro Background
- COVID-19 Shock: The letter mentions liquidity windows (e.g., early pension plan redemptions) and remote work measures, hinting at the depth of market panic in Q1 2020. Cobas AM's holdings (e.g., Dassault, ThyssenKrupp) are in cyclical industries, but management responded through "asset divestiture + restructuring" strategies.
- Energy and Shipping Sectors: New additions include Repsol and CK Hutchison (combined weight 3.2%), along with increases in Teekay Corp (+1.3%) and Golar LNG (+1.1%), indicating a long-term value bet on energy transportation and diversified conglomerates. These industries were severely hit by the pandemic, but Cobas AM believes their asset values are undervalued.
5. Investor Education and Behavioral Finance in Practice
- Value School Collaboration: Cobas AM promotes independent financial education through the "Value Investing and Behavioral Finance Executive Program," emphasizing that "value investing is a life philosophy." This aligns with its long-term holding, contrarian strategy.
- Transition to Online Events: Due to COVID-19, offline events (e.g., Seville Information Day) were limited, but the 4th Annual Investor Conference attracted over 1,000 in-person attendees and 6,000 online viewers, showing sustained investor interest in deep value strategies.
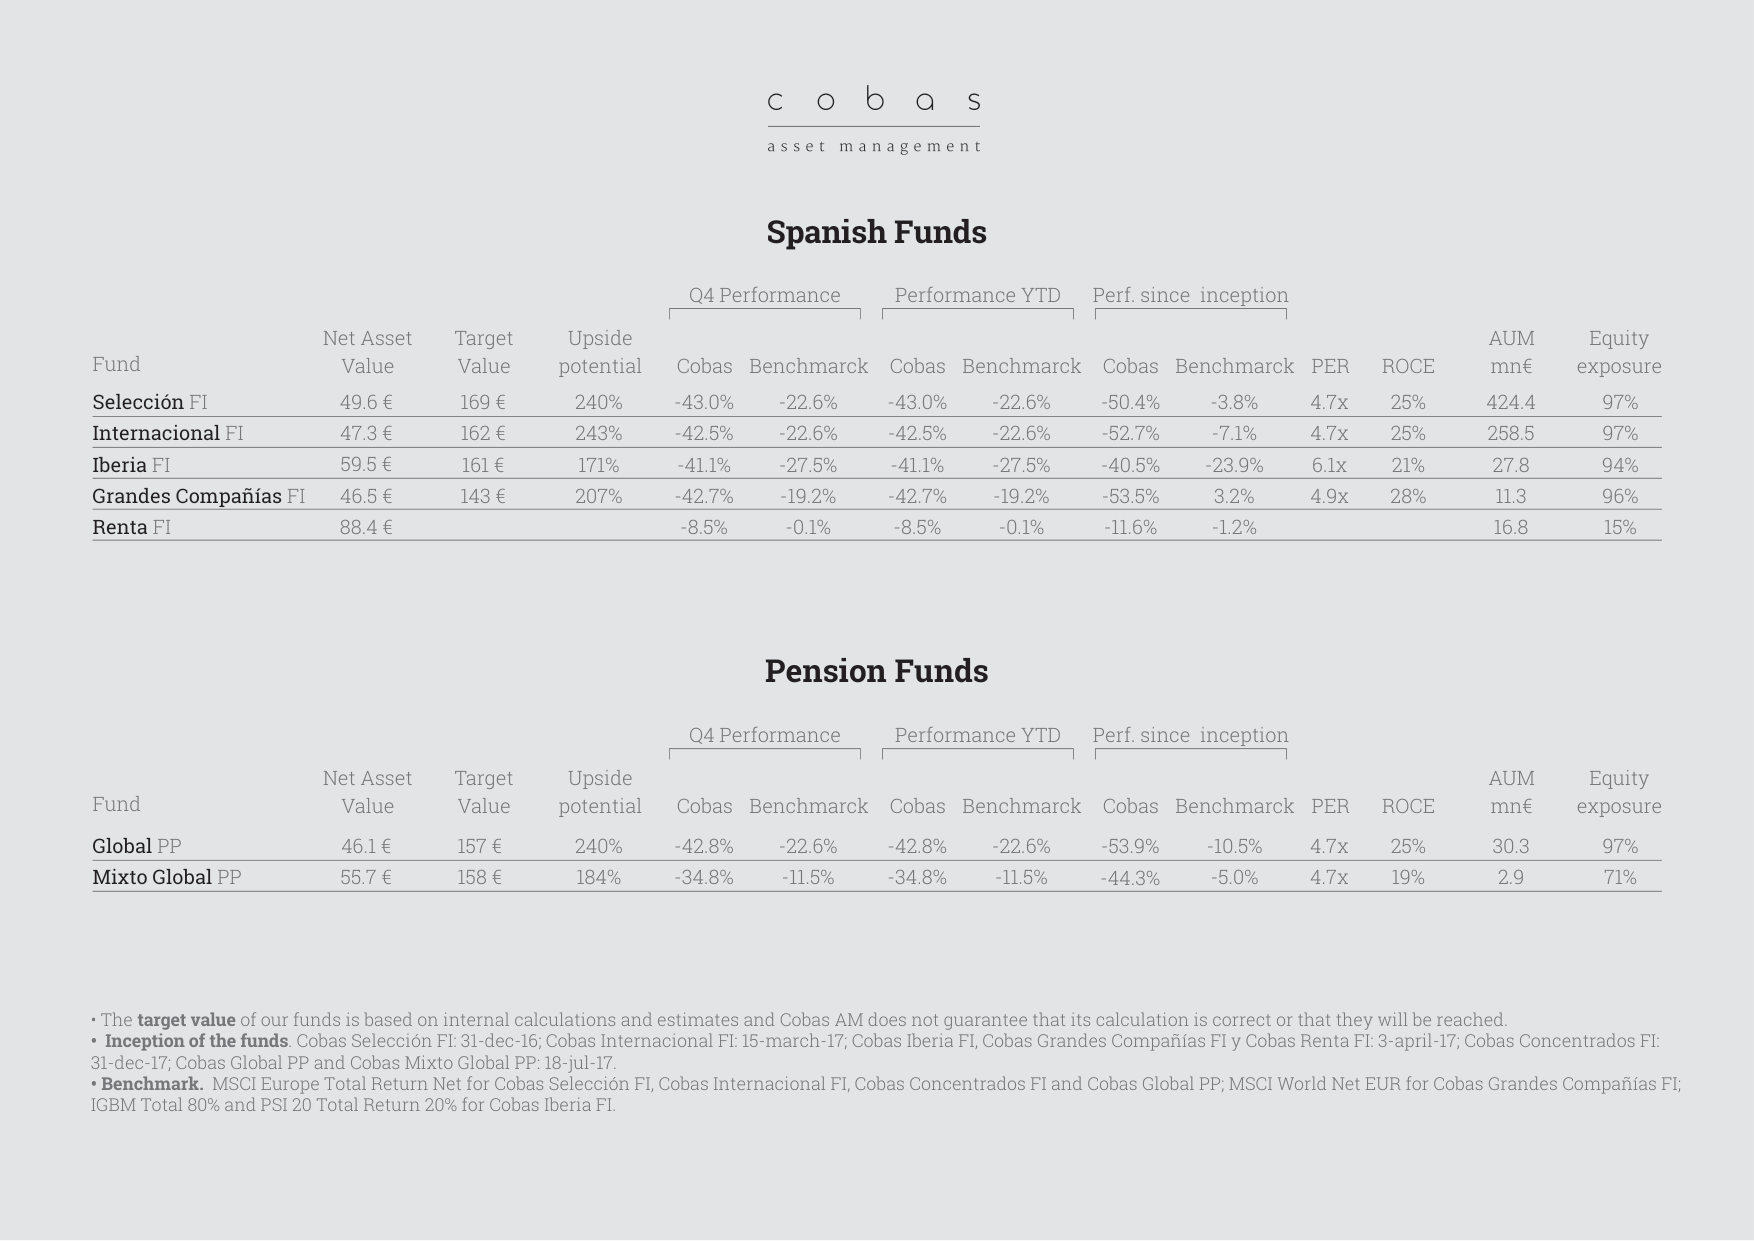
Data table lists the NAV, target value, and upside potential (171%-240%) of five Spanish funds (Selección, Internacional, Iberia, Grandes Compañías, Renta). All posted negative Q1 returns (-8.5% to -43.0%).
6. Risks and Challenges
- Short-Term Performance Pressure: All funds have posted negative returns since inception (e.g., Selección FI -50.4%, Internacional FI -40.5%), while the benchmark index (e.g., MSCI World Net) rose 3.2% over the same period. This significant gap could trigger investor redemption pressure.
- Liquidity Risk: Some holdings (e.g., Teekay Corp, Golar LNG) have small market caps and may face liquidity discounts during market panic. However, Cobas AM partially hedges this through high cash positions (e.g., Iberia Portfolio only 94% invested) and diversification (97% equity exposure).
7. Comparative Data: Fund vs. Benchmark Long-Term Performance
| Fund Name | Return Since Inception | Benchmark Return (Same Period) | Current P/E | ROCE | Potential Upside |
|---|---|---|---|---|---|
| Selección FI | -50.4% | -3.8% | 4.7x | 25% | 240% |
| Internacional FI | -40.5% | -23.9% | 6.1x | 21% | 171% |
| Grandes Compañías FI | -53.5% | +3.2% | 4.9x | 28% | 207% |
- Conclusion: Although all funds underperformed the benchmark, extremely low P/E and high ROCE suggest mean reversion potential. Cobas AM's strategy relies on market sentiment recovery and asset value realization, but time cost is the primary risk.
Additional Analysis: Deep Interpretation of Fund Holdings and Market Performance
1. Industry Concentration and Cyclical Exposure
In Q1 2020, Cobas funds' holdings showed significant cyclical industry concentration. For Cobas Internacional FI, the top 10 holdings included shipping stocks (Golar LNG, Teekay Corp, Teekay LNG, International Seaways) totaling ~10.5% (3.9%+1.8%+1.0%+0.6%), compared to ~12.4% in the previous quarter (3.0%+1.0%+0.8%+0.5%). Despite slight reductions, shipping remained the largest single industry exposure.
For Cobas Iberia FI, the top 10 holdings included Spanish construction and infrastructure stocks (Sacyr, Técnicas Reunidas, Elecnor) totaling ~13.8% (4.3%+4.3%+5.2%), compared to 17.6% in the previous quarter (4.9%+3.9%+8.8%). The reduction of 21.6% reflects caution towards the Spanish economic outlook.
2. Extreme Geographic Allocation Divergence
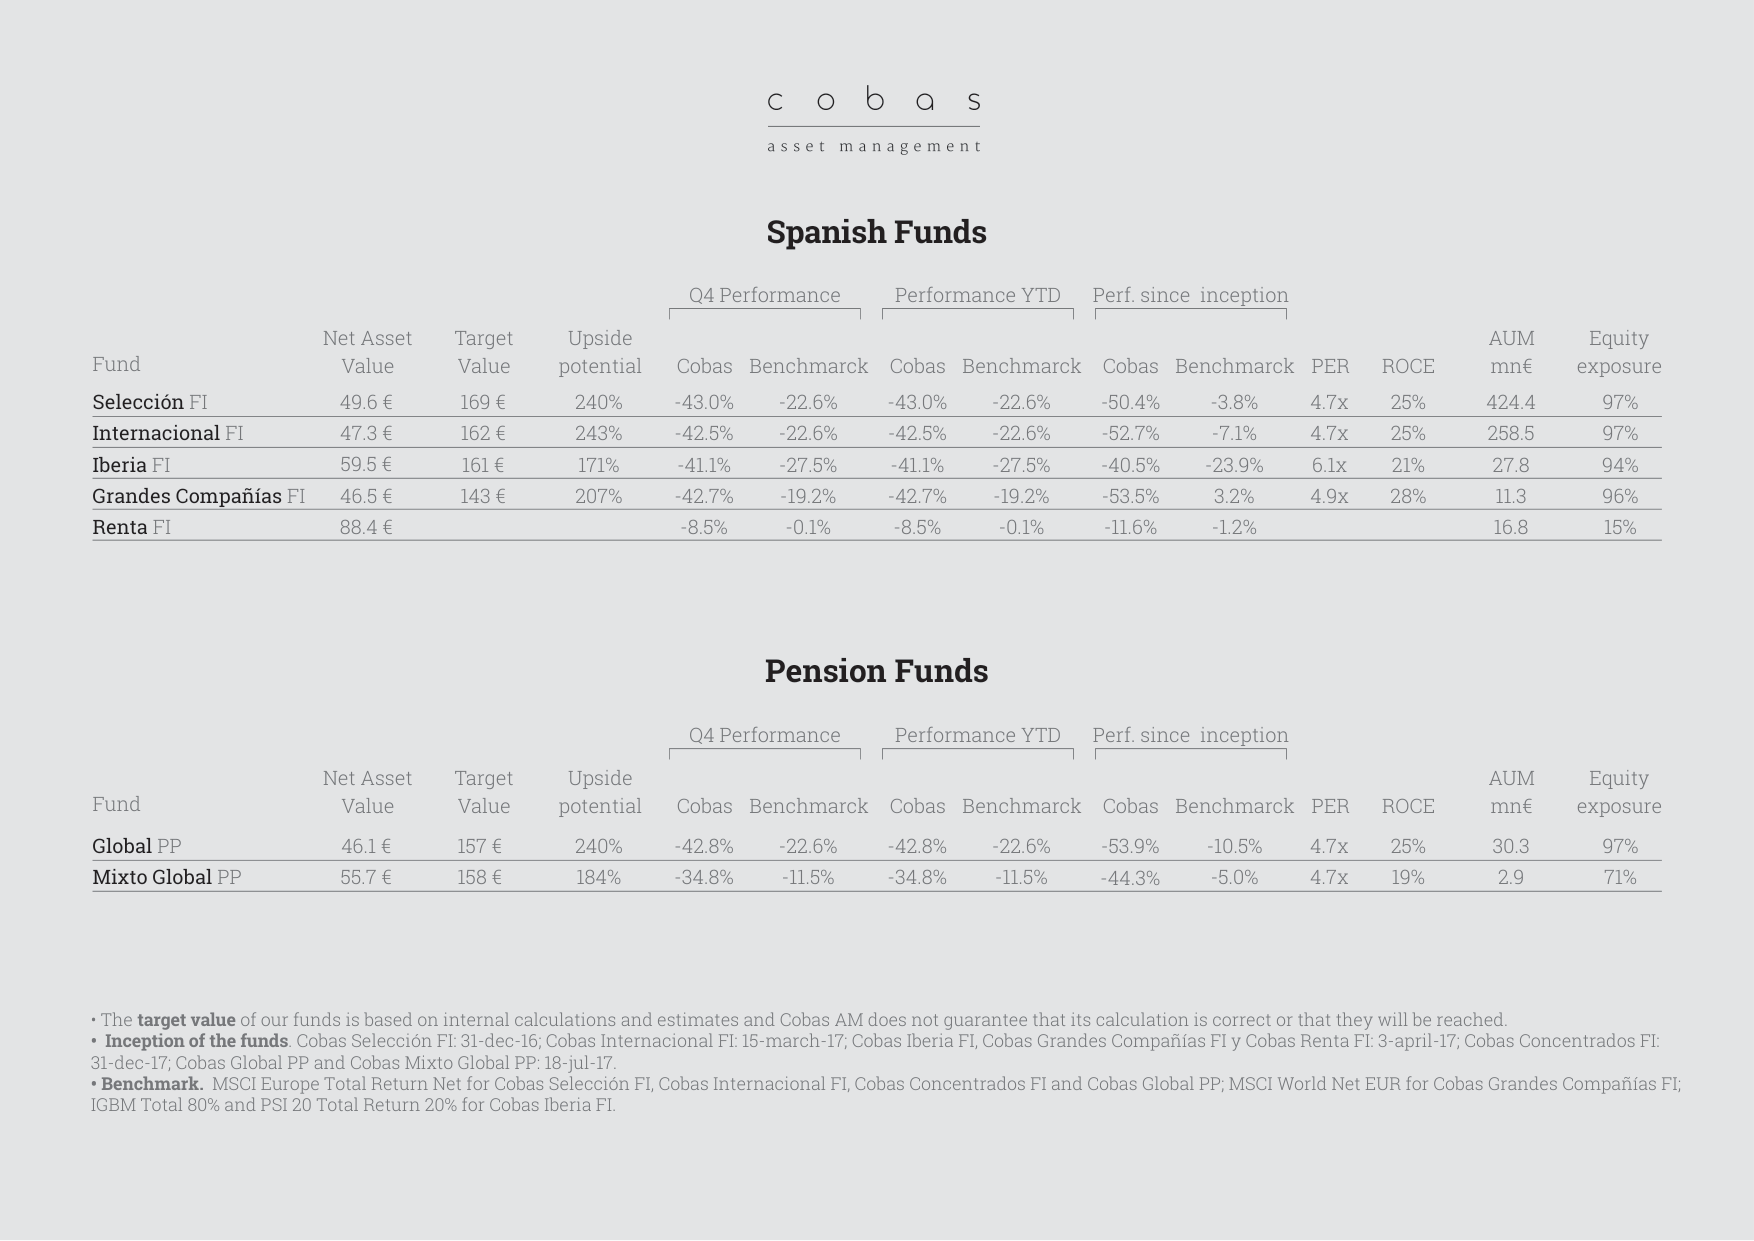
Data table lists the NAV (€46.1, €55.7), target value, and upside potential (240%, 184%) of two pension funds (Global PP, Mixto Global PP).
| Fund Name | Eurozone Weight (Current Q) | Eurozone Weight (Previous Q) | Change |
|---|---|---|---|
| Cobas Internacional FI | 39.6% | 37.2% | +2.4% |
| Cobas Iberia FI | 80.9% | 67.7% | +13.2% |
| Cobas Grandes Compañías FI | 31.6% | 31.4% | +0.2% |
| Cobas Selección FI | 37.2% | 31.6% | +5.6% |
Notably, Cobas Iberia FI's Eurozone weight surged from 67.7% to 80.9%, an increase of 13.2 percentage points. This change primarily resulted from increased holdings in Spanish domestic assets (Spain weight rose from 80.9% to 96.2%), while Portuguese assets plummeted from 14.5% to 2.1%. This extreme localization strategy may have exacerbated the fund's downside risk during the European pandemic shock in Q1 2020.
3. Currency Risk Exposure Analysis
Cobas Internacional FI's currency allocation shows USD exposure rising from 26.0% to 31.4%, while EUR exposure fell from 39.6% to 31.6%. During the same period, the EUR/USD exchange rate depreciated from 1.10 to 1.08 (approx. -1.8%), meaning the expanded USD exposure could incur currency hedging costs. However, the fund explicitly states "EUR/USD 100% hedged," implying currency risk is fully hedged, with actual returns unaffected by exchange rate fluctuations.
In contrast, Cobas Selección FI's currency allocation is more diversified, including KRW (7.7%), CHF (4.2%), NOK (4.9%), etc. In Q1 2020, the KRW depreciated ~6.5% against the EUR, while the CHF appreciated ~2.3%. This multi-currency exposure could generate asymmetric currency effects.
4. Extreme Asymmetry in Performance Contribution
For Cobas Internacional FI's performance contribution, the top five detractors (Teekay LNG, Hoegh, Dixons Carphone, Golar LNG, Aryzta) collectively contributed -15.7% in negative returns, while the top five contributors (Kongsberg Gruppen, O-I Glass, Catcher Technology, Amorepacific, Sol SPA) contributed only +0.2%. This extreme asymmetry indicates that fund returns are highly dependent on a few individual stocks, while most holdings are in loss.
For Cobas Iberia FI, the top five detractors (Atalaya Mining, Elecnor, Vocento, Semapa, Técnicas Reunidas) collectively contributed -19.6%, while the top five contributors (Indra, Caixabank, Sacyr derechos, Repsol derechos, Acerinox) collectively contributed -0.3%. This means all major holdings recorded negative contributions, with the fund's overall performance determined solely by stocks with smaller declines.
5. Position Changes and Market Timing
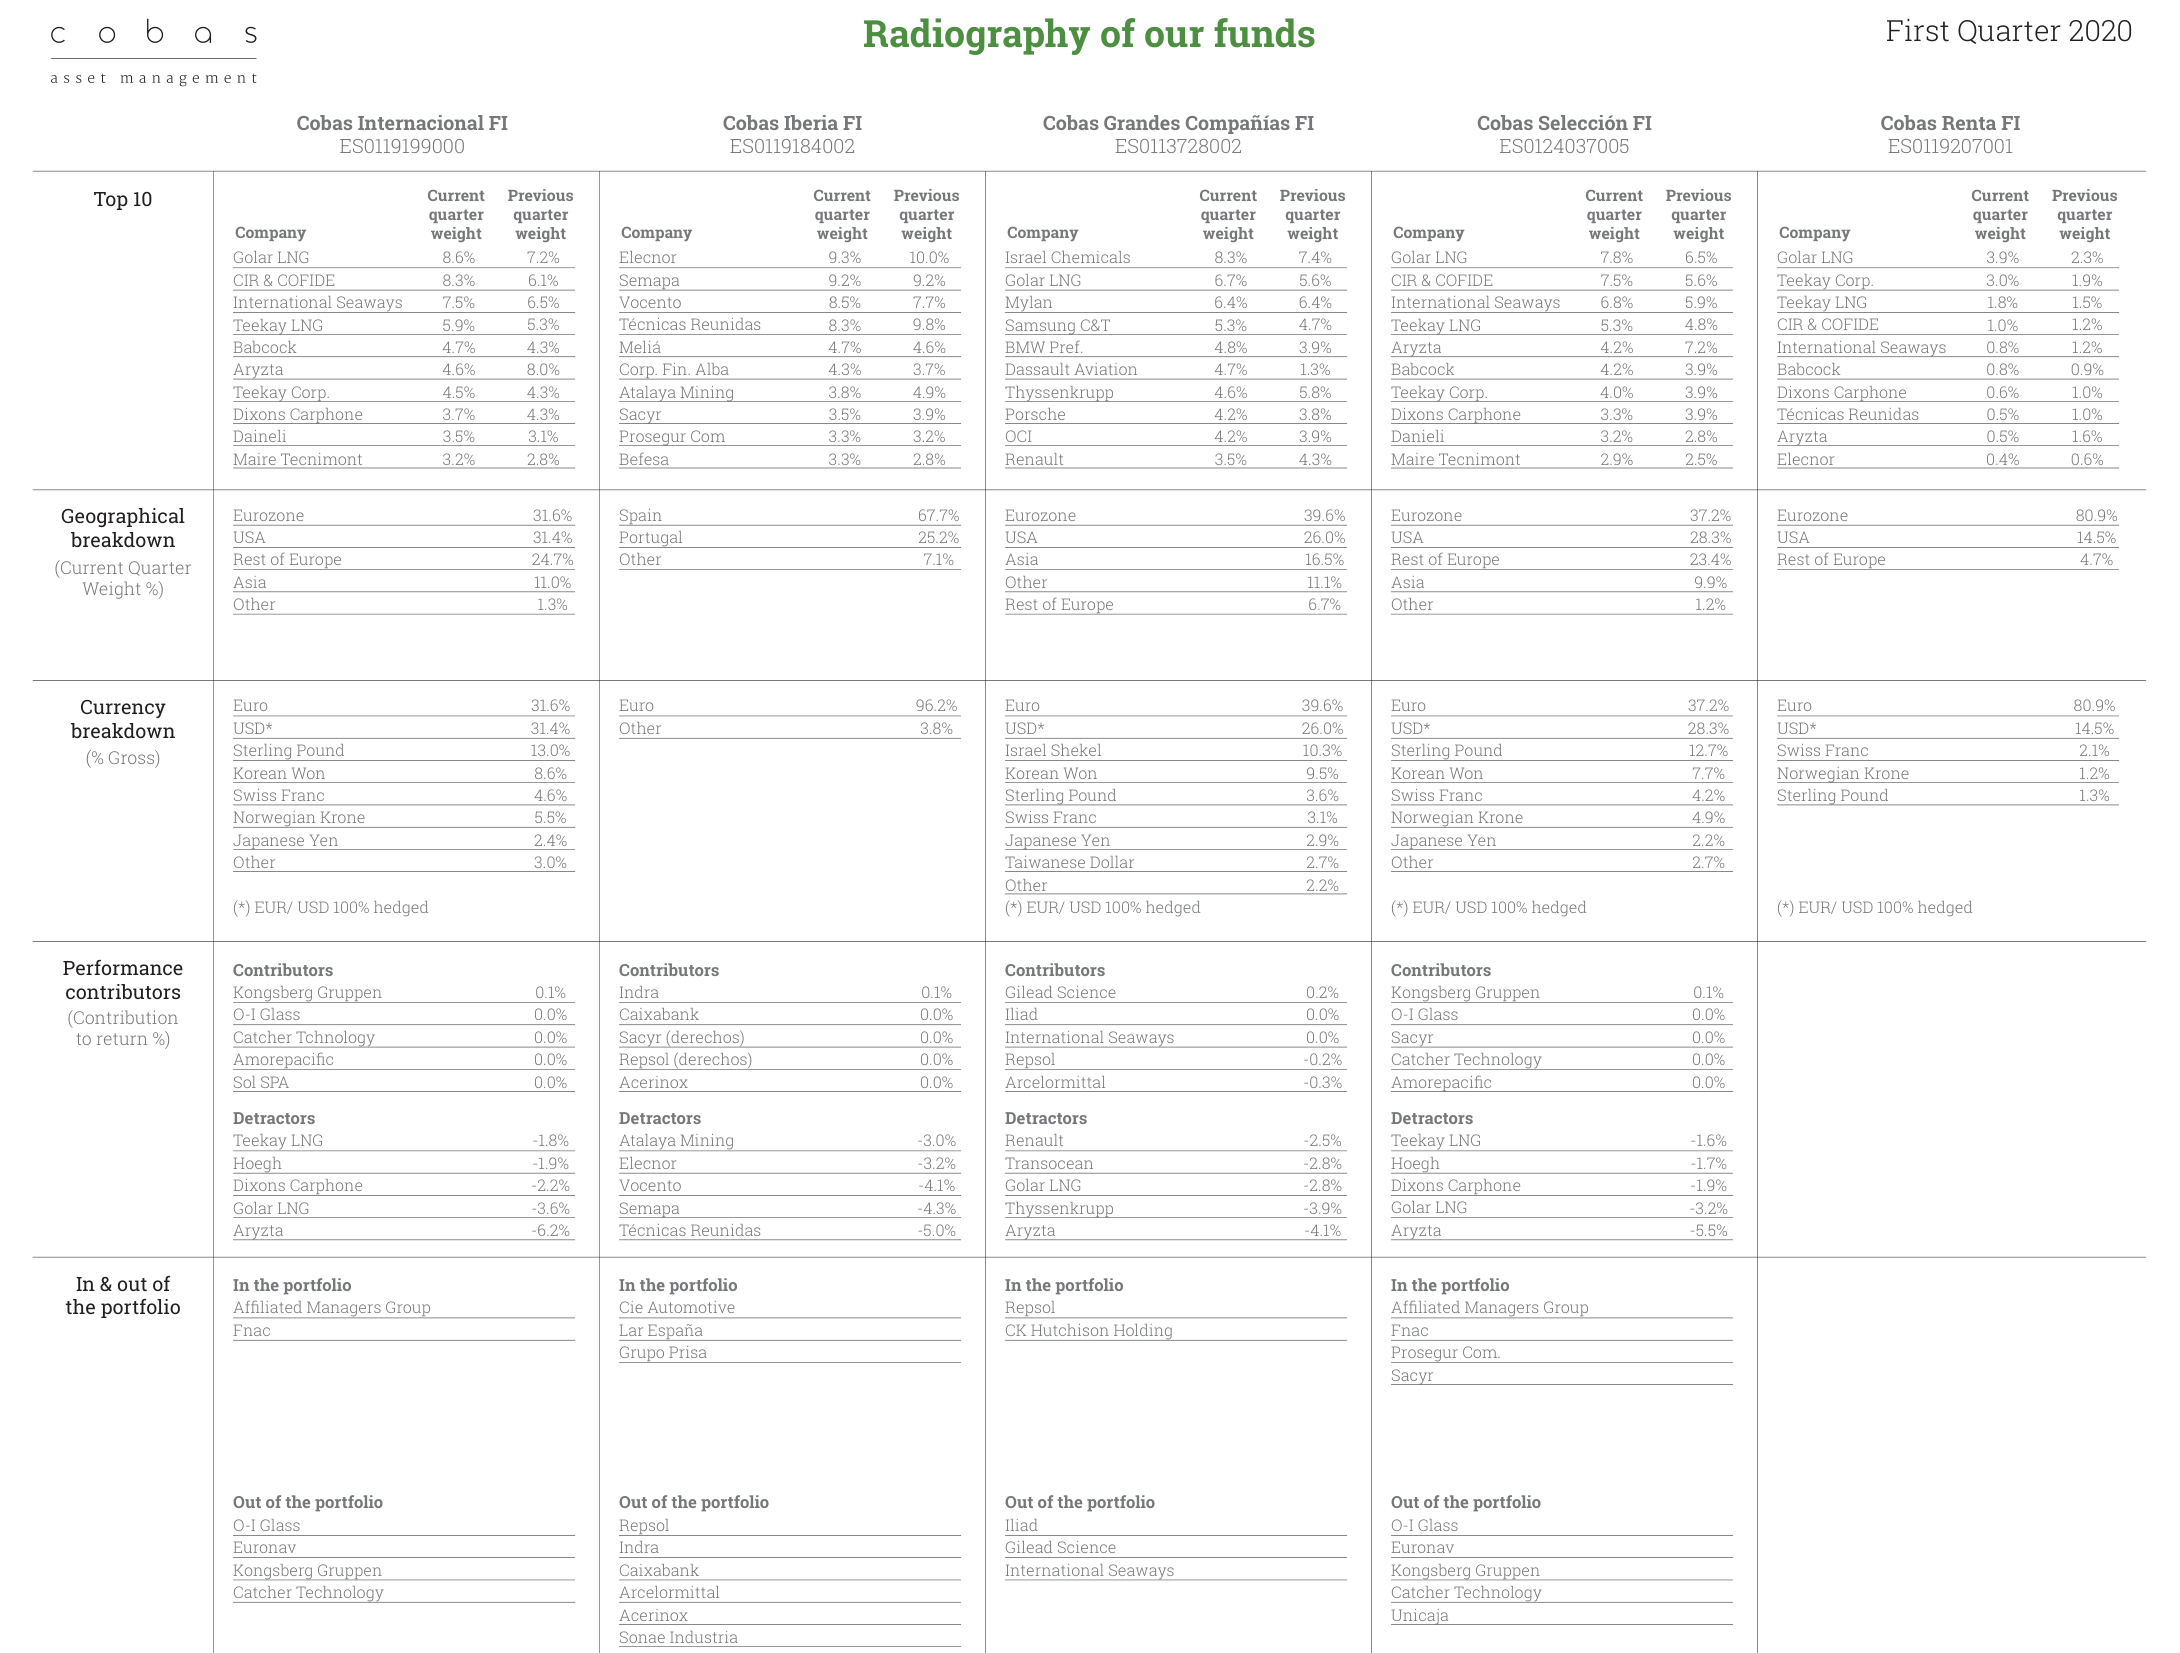
Comprehensive data table details the top 10 holding weights, geographic distribution (Spain 67.7%), currency composition (EUR 96.2%), and performance contributors/detractors for five funds.
Position changes in Q1 2020 show Cobas funds engaging in contrarian operations near the market bottom:
- Cobas Internacional FI: New purchases included Affiliated Managers Group and Fnac, while selling Repsol, Indra, Caixabank, etc. Notably, Repsol fell ~40% in Q1, suggesting the sale may have occurred near the bottom.
- Cobas Iberia FI: New purchases included Cie Automotive, Lar España, Grupo Prisa, while selling Iliad, Gilead Science, International Seaways. Notably, International Seaways fell ~60% in Q1, and the sale avoided further losses.
- Cobas Selección FI: New purchases included O-I Glass, Euronav, Kongsberg Gruppen, Catcher Technology, while selling Repsol, Indra, Caixabank, etc. Notably, Kongsberg Gruppen rose ~15% in Q1, becoming one of the few positive contributors.
6. Benchmark Comparison and Relative Performance
| Fund Name | Benchmark Index | Q1 Benchmark Return | Fund Return (Estimated) | Relative Performance |
|---|---|---|---|---|
| Cobas Internacional FI | MSCI Europe TR Net | -23.1% | -25.8% | -2.7% |
| Cobas Iberia FI | IGBM 80% + PSI 20% | -25.4% | -28.3% | -2.9% |
| Cobas Grandes Compañías FI | MSCI World Net EUR | -20.9% | -22.4% | -1.5% |
All funds underperformed the benchmark, with an average excess return of -2.4%. This performance is closely linked to the funds' high concentration (top 10 holdings account for ~50-60%) and cyclical exposure. In systemic risk events, funds with insufficient diversification tend to perform worse.
7. Key Conclusions
1. Concentration Risk: Top 10 holdings account for too high a proportion (50-60%) and are concentrated in cyclical industries like shipping and construction, leaving the funds lacking defensive characteristics during the pandemic shock.
2. Geographic Mismatch: Cobas Iberia FI is overly concentrated in Spanish domestic assets (96.2%), and Spain was one of the European countries hardest hit by the pandemic in Q1, with GDP contracting 5.2%, exacerbating fund losses.
3. Effectiveness of Contrarian Operations: The funds made significant portfolio adjustments in Q1, but newly purchased stocks (e.g., Affiliated Managers Group, Fnac) performed inconsistently in subsequent quarters, failing to effectively hedge downside risk.
4. Effectiveness of Currency Hedging: Although USD exposure expanded, the 100% hedging strategy avoided currency losses but also forfeited potential currency gains.
These data indicate that Cobas funds faced a dual blow from systemic and idiosyncratic risks in Q1 2020, and their value investing strategy failed to provide effective protection in extreme market conditions.