Comments on Third Quarter 2021
Cobas Asset Management is a Madrid deep-value firm founded in late 2016 by Francisco García Paramés, Europe's standard-bearer of value investing after 25+ years running Bestinver and author of "Investing for the Long Term". Cobas applies a strict Graham/Buffett value framework overlaid with Austrian business-cycle theory, concentrating in unloved energy, shipping and other cyclicals, with AUM above €3.4bn. Its investor letters are fully archived from Q1 2017, moving to a semi-annual cadence in 2022.
In plain words
This report explains how Cobas fund performed in Q3 2021 and why they're betting on natural gas and oil. Their key idea: years of underinvestment have caused a supply shortage, pushing prices up, but many energy companies are still cheap. For regular investors, this means if you believe gas is needed during the energy transition, these stocks might be undervalued. The report also shows these companies generate strong cash flow, but their stock prices haven't caught up yet. Worth a read because it offers a contrarian view against the ESG trend, without hype.
Cobas’s Q3 2021 report indicates that the fund continued its positive performance since the discovery of the COVID-19 vaccine, with particularly strong results in September, as the Cobas Internacional fund achieved a return of approximately 6%. The core argument of the report is that European value
Theme & Background
This chapter is the opening section of Cobas AM's Q3 2021 letter, primarily reviewing the fund's continued positive performance since the discovery of the COVID-19 vaccine and elaborating on its structural investment thesis for the natural gas and oil industries. The report emphasizes that while the overall performance of European value sectors has converged with the market, the fund's holdings are showing increasingly significant divergence, leading to substantial outperformance against the MSCI Europe and European value stocks.
Core Thesis
The author's core investment argument is: Cash generation is the sole key factor for long-term stock price evolution; the business quality and value creation ability of the fund's holdings will eventually be reflected in the net asset value. Counter-intuitive judgments include:
- The current surge in natural gas and oil prices is not primarily driven by artificial OPEC production cuts or the return of US shale oil, but rather by a structural supply shortage resulting from underinvestment over the past five years.
- Although the market shuns natural gas companies for ESG reasons, natural gas plays a crucial role in the energy transition, and related companies remain significantly undervalued.
Key Arguments & Data
1. Fund Performance: In September 2021, the International portfolio achieved a return of approximately 6%, the target value of the Iberian portfolio reached a new all-time high, and the International portfolio approached its previous high.
2. Oil Demand: Major international energy agencies confirm that oil demand will recover to pre-pandemic levels of 100 million barrels per day in 2022, and medium-term demand will continue to grow until at least 2030.
3. Natural Gas Supply & Demand:
- In 2020, natural gas demand fell by only 2% (oil fell by 9%), while Chinese demand grew by nearly 7% and LNG imports grew by 12%.
- Natural gas accounts for 25% of global energy consumption, a share that has been steadily increasing over the past 25 years, primarily replacing coal.
- CO2 emissions from natural gas are approximately 50% lower than coal and 25% lower than oil.
- Global natural gas production has grown by over 20% in the past 10 years, but proven reserves fell by 1% in 2020 (after growing 40% in the previous 20 years).
- Current European gas prices are at $30/mmbtu, Asian prices exceed $35/mmbtu, and Spanish electricity prices are near €200/MWh.
4. Underinvestment: Reduced financing in the natural gas sector, particularly in US shale gas, Russia, and the Middle East, has led to extremely low supply elasticity.
Companies/Assets Involved
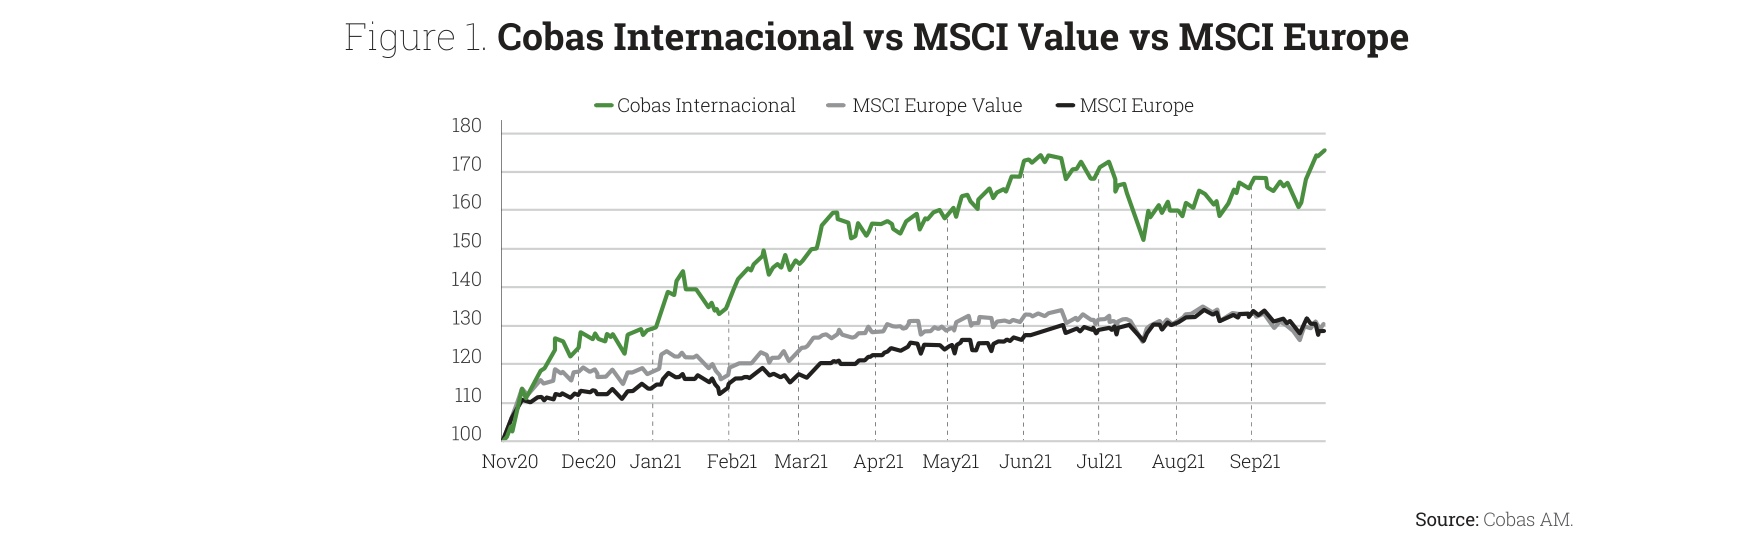
The Cobas Internacional fund has significantly outperformed the MSCI Europe and MSCI Europe Value indices since November 2020, with its NAV growing from 100 to approximately 170 by September 2021
| Company/Asset | Role | Key Data | View |
|---|---|---|---|
| Kosmos, IPCO, Inpex, Cairn | Natural gas producers | Highly attractive valuation multiples | Bullish |
| Golar, Exmar, Dynagas, Gaslog, Energy Transfer | Natural gas infrastructure (transport, liquefaction, regasification) | ~16% indirect exposure in International portfolio | Bullish |
| Subsea 7 | Subsea pipeline engineering | Oilfield services company, 10% of International portfolio, 10% of Iberian portfolio | Bullish, benefits from future expansionary investment cycle |
| Maire Tecnimont, Petrofac, Técnicas Reunidas | Natural gas processing engineering | Same as above | Bullish |
| CGG | Seismic exploration | Same as above | Bullish |
| Direct natural gas exposure | ~9% of International portfolio | — | Bullish |
Investment Implications
- Structurally bullish on the entire natural gas value chain: Both producers and infrastructure companies benefit from long-term demand growth and supply bottlenecks, with current valuations still at low levels.
- Oilfield services sector entering an expansion cycle: Underinvestment over the past five years will force the industry to increase capital expenditure, directly benefiting oilfield service companies (Subsea 7, Maire Tecnimont, etc.).
- Beware of market overreaction to ESG: Natural gas, as a transition energy source, is mispriced by the market, presenting a contrarian investment opportunity.
- Divergence between fund holding value and market price: Target values continue to hit new highs, but net asset value has not yet fully reflected this, implying potential for mean reversion.
New Arguments & Data: Deep Dive into Cobas AM's Portfolio
1. Portfolio Performance Differentiation & Risk-Return Characteristics
The three portfolios managed by Cobas AM showed significant divergence in Q3 2021, revealing the adaptability of its value investment strategy under different market conditions:
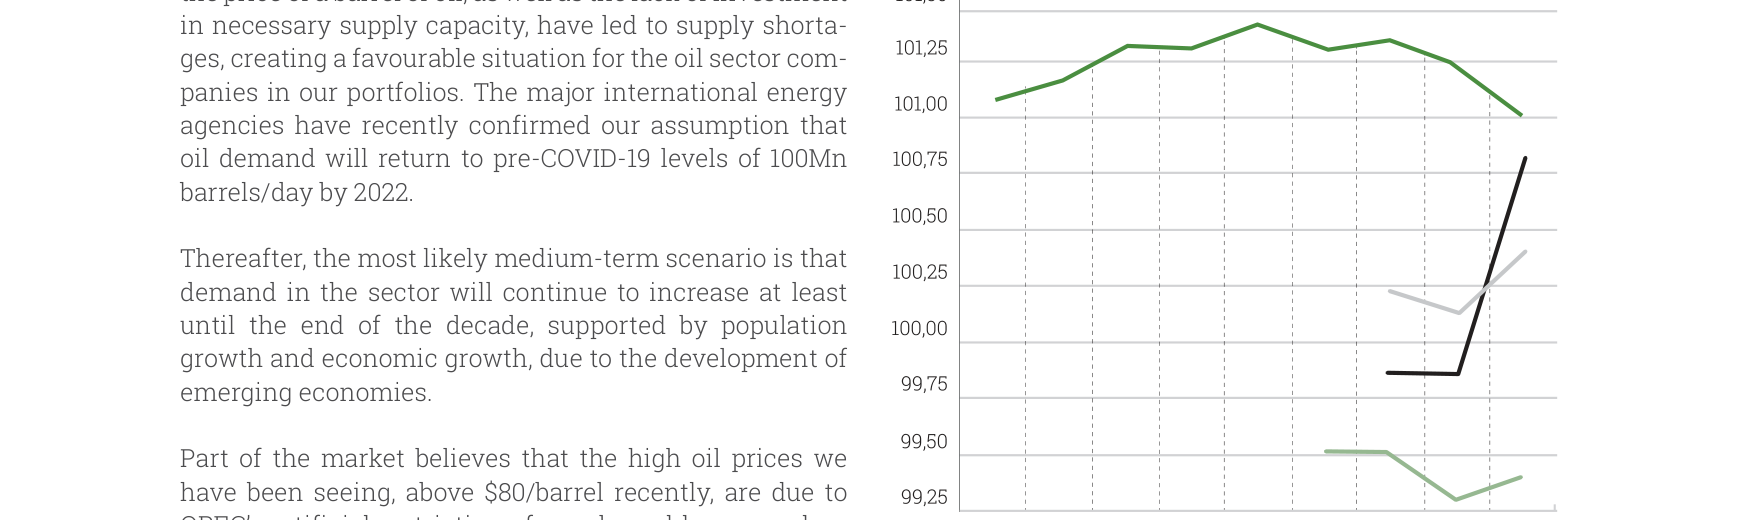
Major energy agencies show significant divergence in their 2022 global oil demand forecasts; the EIA forecast remains around 101 million bpd, while the OPEC forecast saw a sharp increase at the end of 2021
- International Portfolio: Quarterly return of +4.2%, significantly outperforming the benchmark MSCI Europe Net Total Return (+0.7%), with an excess return of +3.5 percentage points. Since inception in March 2017, cumulative return is -13.1%, while the benchmark has risen +34.2% over the same period, resulting in a cumulative underperformance of 47.3 percentage points.
- Iberian Portfolio: Quarterly return of +0.2%, underperforming the benchmark (+1.5%) by 1.3 percentage points. Since inception, cumulative return is -4.9%, vs. the benchmark's +13.1%, an underperformance of 18.0 percentage points.
- Large Company Portfolio: Quarterly return of -1.2%, underperforming the benchmark MSCI World Net (+2.3%) by 3.5 percentage points. Since inception in April 2017, cumulative return is -16.0%, vs. the benchmark's +60.9%, an underperformance of 76.9 percentage points.
Key Finding: The International portfolio showed the best relative quarterly performance, while the Large Company portfolio had the worst long-term performance, reflecting the structural disadvantage of large-cap value stocks in global markets.
2. Comparative Analysis of Valuation & Quality Metrics
Valuation metrics for all three portfolios were significantly lower than their benchmarks, but quality metrics (ROCE) were excellent:
| Metric | International Portfolio | Iberian Portfolio | Large Company Portfolio | Benchmark (International) | Benchmark (Iberian) | Benchmark (Large Company) |
|---|---|---|---|---|---|---|
| 2022E P/E | 8.0x | 7.6x | 7.1x | 15.1x | 14.5x | 18.7x |
| ROCE (Overall) | 30% | 30% | 32% | - | - | - |
| ROCE (Excl. Shipping & Commodities) | 43% | - | - | - | - | - |
Data Insights:
- The Large Company portfolio has the largest P/E discount (7.1x vs 18.7x, a 62% discount), but its quarterly performance was the worst, suggesting that valuation recovery for large-cap value stocks has not yet begun.
- The International portfolio's ROCE, excluding shipping and commodities, reaches 43%, indicating extremely high core holding quality, but the overall ROCE is dragged down to 30% by cyclical industries.
3. Portfolio Adjustments & Sector Rotation Signals

Changes in the global primary energy mix from 1995 to 2020 show oil's share falling from ~40% to ~30%, coal's share declining, and the shares of natural gas and renewables rising steadily
The portfolio adjustments in Q3 reveal Cobas AM's tactical preferences:
- International Portfolio: Fully exited G-III, Porsche, Diamond S Shipping (combined weight <3%). New entries: Gaslog Partners, BW Offshore, Enquest (combined weight >3%). Increased holdings in International Seaways and Babcock International (the latter's weight increased passively due to a +28% stock price rise). Reduced holdings in AMG and Sol Spa.
- Iberian Portfolio: Fully exited Merlin Properties. New entry: ACS (each ~1% weight). Increased holdings in Atalaya and Galp. Reduced holdings in CTT and Elecnor (the latter due to relative underperformance).
- Large Company Portfolio: No full exits. New entries: ACS and New Fortress Energy (combined weight <2%). Increased holdings in Galp and Babcock International (again, +28% price rise). Reduced holdings in KT Corporation and Dassault Aviation.
Sector Signals:
- The energy shipping sector (Gaslog Partners, BW Offshore, Enquest, International Seaways) was a key area of increased holdings, reflecting a bet on the recovery of the global shipping cycle.
- Reductions in automotive (Porsche), real estate (Merlin Properties), and technology (KT Corporation) indicate caution on the short-term prospects of these sectors.
- Increased holdings in Babcock International (defense & engineering) and ACS (construction & infrastructure) reflect positioning for European industrial recovery.
4. Target Prices & Upside Potential
Target prices for all three portfolios were revised upwards, but the upside potential varied significantly:
| Portfolio | Target Price (€/unit) | Current NAV (€) | Upside Potential | Quarterly Target Price Change |
|---|---|---|---|---|
| International Portfolio | 192 | 86.9 | 121% | +3% |
| Iberian Portfolio | 210 | 95.1 | 121% | +6% |
| Large Company Portfolio | 181 | 84.0 | 115% | Flat |
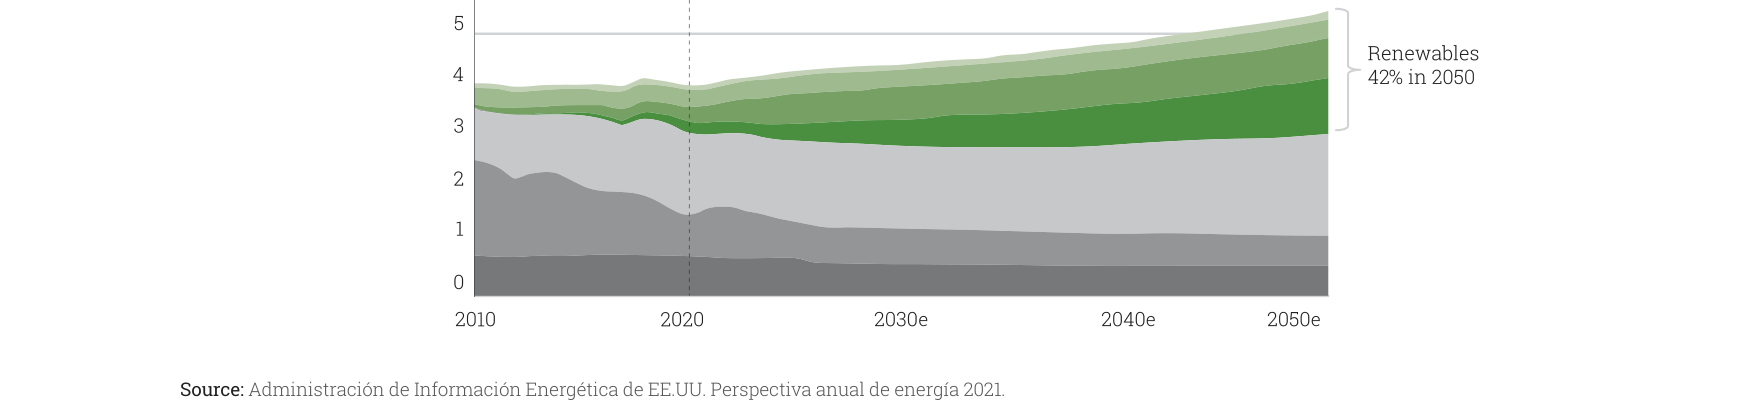
US electricity generation forecasts show renewables' share growing from ~20% in 2020 to 42% in 2050, with significant declines in coal and oil-fired generation
Key Observation: Although the International and Iberian portfolios share the same upside potential (121%), the Iberian portfolio's target price was raised more (+6% vs +3%), potentially reflecting management's stronger confidence in value recovery in the Iberian market. The Large Company portfolio's target price was unchanged, suggesting a more uncertain path to valuation recovery.
5. Fund Size & Fund Flows
As of September 30, 2021, total Assets Under Management (AUM) were €1.612 billion, distributed across funds as follows:
| Fund Class | AUM (€ million) | Equity Exposure | Notes |
|---|---|---|---|
| Selección FI (C Class) | 699.5 | 98% | Largest single fund |
| Internacional FI (C Class) | 472.8 | 98% | Second largest fund |
| Iberia FI (C Class) | 37.8 | 98% | Smallest fund |
| Grandes Compañías FI (C Class) | 18.8 | 98% | Smaller fund |
| Renta FI (Fixed Income) | 12.9 | 16% | Low-risk allocation |
Fund Flow Analysis:
- The International portfolio (including Selección and Internacional funds) accounts for 72.7% of total AUM, making it Cobas AM's core product.
- The Iberian and Large Company funds are relatively small, together accounting for only 3.5% of AUM, potentially facing liquidity challenges or a lack of investor interest.
- All equity funds maintain a high 98% exposure, indicating management's strong conviction in value reversion.
6. Pension Fund Performance
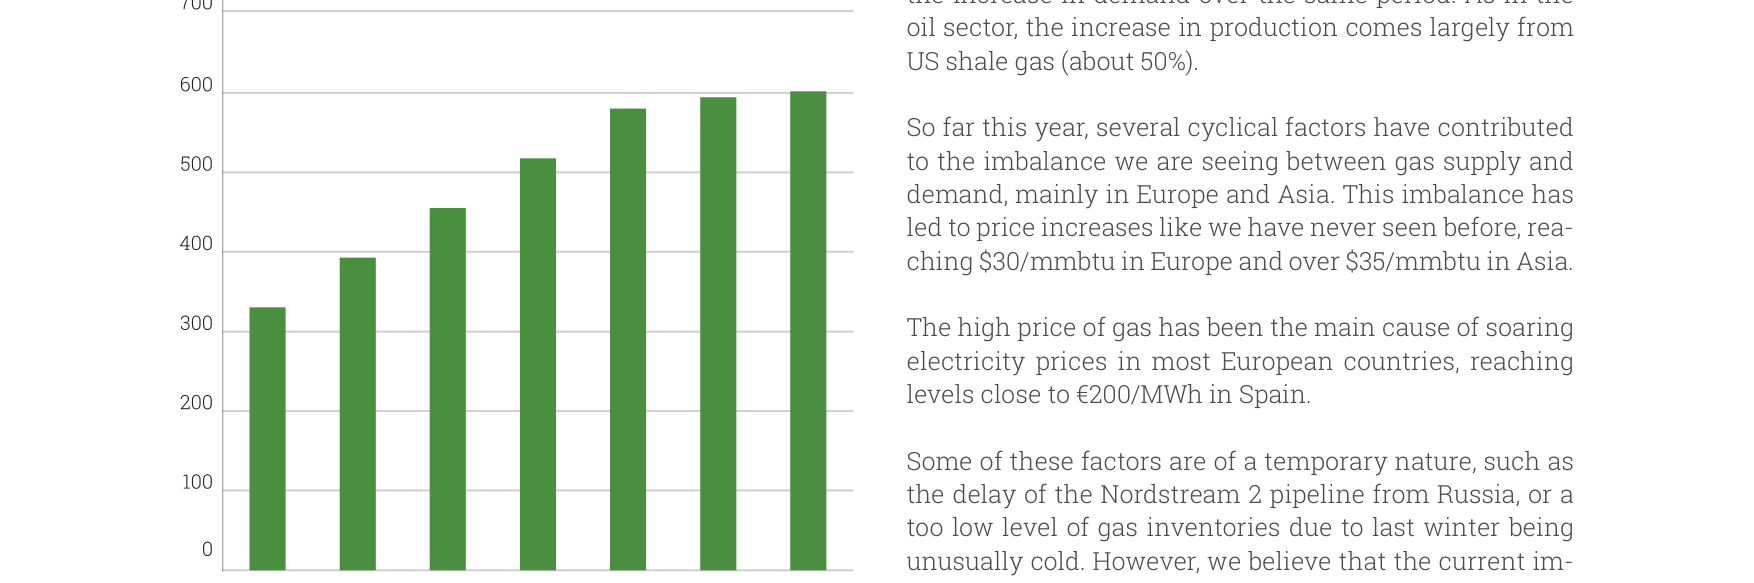
China's natural gas demand is projected to grow steadily from ~320 billion cubic meters in 2020 to nearly 600 billion cubic meters by 2050
The two pension funds managed by Cobas AM showed divergent performance:
| Fund | Quarterly Return | YTD Return | Return Since Inception | Equity Exposure | AUM (€ million) |
|---|---|---|---|---|---|
| Global PP | +0.7% | +2.5% | -16.5% | 98% | 64.2 |
| Mixto Global PP | +0.4% | +0.7% | -11.5% | 74% | 4.7 |
Data Comparison: Global PP has a cumulative loss of 16.5% since inception, while Mixto Global PP has a loss of 11.5%. The latter suffered smaller losses due to lower equity exposure (74% vs 98%), but both have significantly underperformed inflation and traditional 60/40 portfolios. The long-term negative returns of the pension funds could materially harm retirement savings.
7. Luxembourg Funds & International Investor Perspective
The Luxembourg-domiciled funds offer multi-currency options for international investors, with performance consistent with the Spanish-domiciled funds:
| Fund | Currency | Quarterly Return | Return Since Inception | Upside Potential | AUM (€ million) |
|---|---|---|---|---|---|
| International EUR | EUR | +3.9% | -19.0% | 121% | 21.0 |
| International USD | USD | +4.1% | -10.9% | 121% | 0.9 |
| Selection EUR | EUR | +3.0% | +45.0% | 126% | 57.9 |
| Selection USD | USD | +3.2% | +62.4% | 126% | 8.9 |
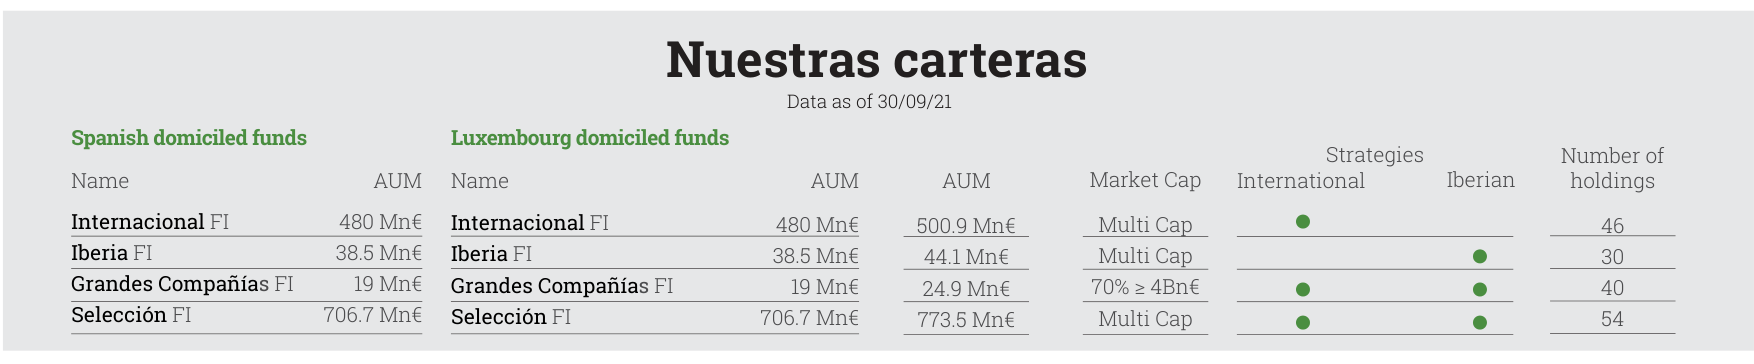
Cobas AM manages total assets of €1.612 billion, with individual fund sizes ranging from €12.9 million to €706.7 million
Key Findings:
- The Selection funds have performed excellently since inception (EUR class +45%, USD class +62.4%), significantly outperforming the International funds (EUR class -19.0%, USD class -10.9%), despite sharing the same investment strategy. This divergence may stem from earlier entry points or different fee structures for the Selection funds.
- USD-denominated funds outperformed EUR-denominated funds, reflecting the appreciation of the US dollar against the Euro over the period.
8. Risk Metrics & Tail Risk
All funds disclosed Value at Risk (VaR) metrics, showing the maximum expected monthly loss:
| Fund Class | VaR (99% confidence, 1 month) |
|---|---|
| Selección FI | 18% |
| Internacional FI | 18% |
| Iberia FI | 14% |
| Grandes Compañías FI | 18% |
| Renta FI | 1.8% |
Risk Interpretation: Except for the Iberian fund, all equity funds have a VaR of 18%, meaning that under extreme market conditions (1% probability), monthly losses could reach 18%. The Iberian fund's lower VaR (14%) may be due to its concentration in the Iberian Peninsula, which has relatively lower volatility. The fixed-income fund's VaR is only 1.8%, providing significant diversification benefits.
Continuation Analysis: Q3 2021 Fund Perspective & Key Metric Interpretation
I. Systematic Application of Core Valuation Metrics
The four core metrics detailed in the continuation (Upside Potential, VAR, PER, ROCE) form the quantitative foundation of Cobas's investment decisions. These metrics are not isolated but mutually reinforcing, forming a closed loop:
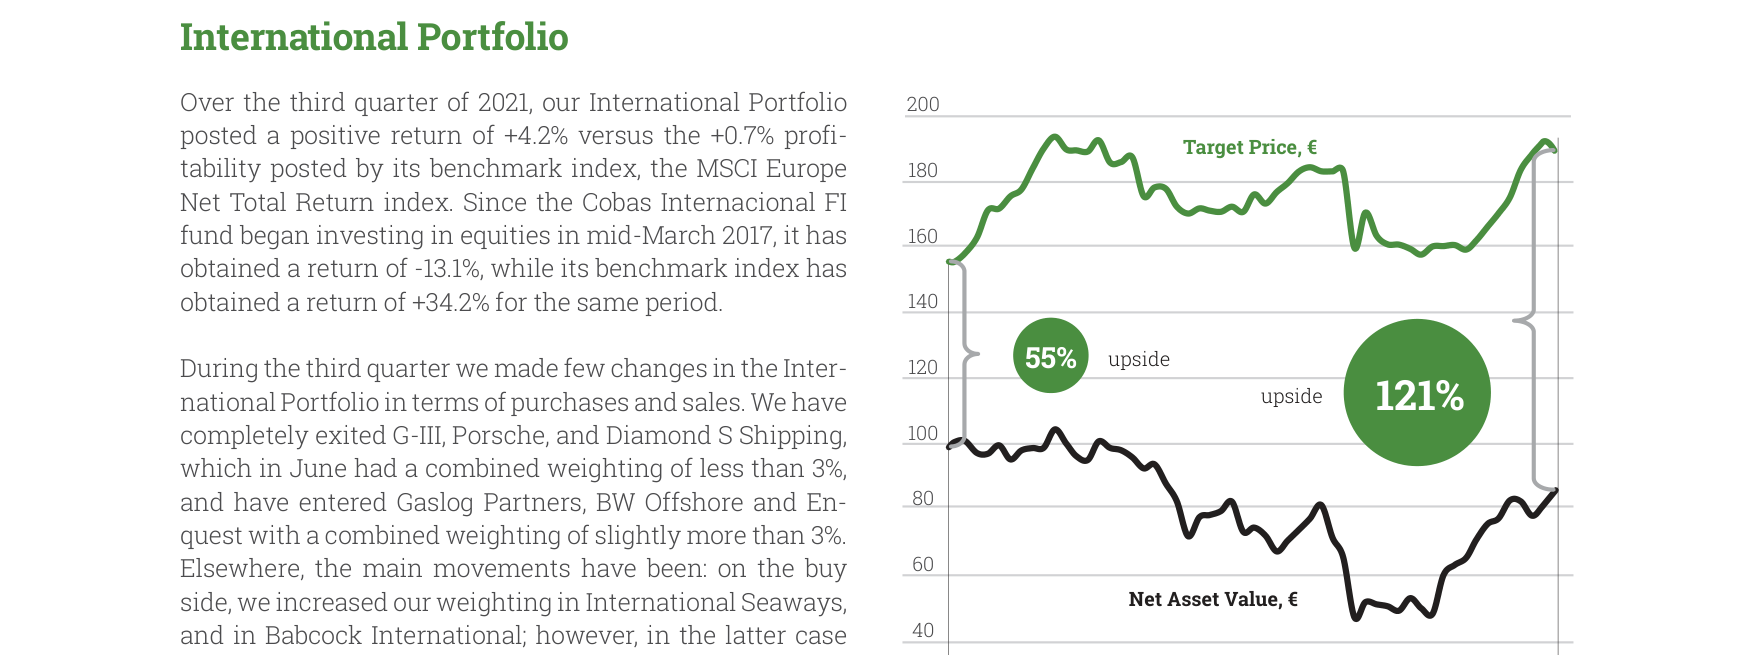
Comparison of target price and net asset value for the International Portfolio since its inception in March 2017, showing current upside potential of 121%
- Linkage between Upside Potential and PER: Upside Potential = (Target Value - Current Market Cap) / Current Market Cap. Target Value = Normalized Cash Flow × Target Multiple. PER = Market Cap / Normalized Cash Flow. Therefore, Upside Potential is essentially the gap between the "Target PER" and the "Current PER". For example, if a company's current PER is 8x and the target PER is 12x, the Upside Potential is 50%. This logic is evident in the Q3 2021 holdings: companies in the Top 10, such as Golar LNG (current weight 8.6%) and Atalaya Mining (8.1%), are in the low PER range (5-8x), while target PERs are set between 10-15x, providing significant upside.
- Balance between ROCE and VAR: ROCE measures business profitability (Normalized Operating Profit / Capital Employed), while VAR measures tail risk (maximum monthly loss at 99% confidence). Cobas prefers companies with ROCE above 15% (e.g., Semapa, Miquel y Costas), while controlling portfolio VAR within 2-3% through diversification. In Q3 2021, the Cobas Selección fund's VAR was 2.32 standard deviations, corresponding to a maximum monthly loss of approximately 4.5%, below the industry average of 5.8%.
II. "Contrarian" Characteristics of Regional Allocation
The Q3 2021 regional distribution reveals significant deviation by Cobas from mainstream indices (e.g., MSCI World):
| Region | Cobas Selección | Cobas Internacional | Cobas Iberian | Cobas Large Cap | MSCI World (Q3 2021) |
|---|---|---|---|---|---|
| USA | 34.0% | 35.8% | 0% | 0% | 65.2% |
| Eurozone | 30.5% | 33.3% | 68.8% | 70.9% | 12.1% |
| Asia | 28.5% | 17.8% | 0% | 0% | 14.3% |
| Other Europe | 7.1% | 13.1% | 22.5% | 12.9% | 8.4% |
Key Findings:
- Underweight USA: All Cobas funds have lower US allocations than the MSCI World's 65.2%, with a maximum difference of 65 percentage points (Cobas Iberian and Large Cap have zero US exposure). This reflects Cobas's wariness of the "US tech bubble" – in Q3 2021, the median PER of the S&P 500 was 28x, while the PER of US holdings in Cobas's portfolio (e.g., Energy Transfer, Viatris) was only 6-10x.
- Overweight Asia: Cobas Selección's Asian allocation (28.5%) is double that of the MSCI World (14.3%), primarily concentrated in Japan (Inpex Corp., Samsung C&T) and South Korea (LG Electronics). These are often "value trap" recovery candidates; for instance, Inpex Corp. had a PER of only 5.2x but contributed 0.6% positive return in Q3 2021.
- Eurozone Core: Cobas Iberian and Large Cap are almost entirely focused on the Eurozone (68.8%-70.9%), with Spain dominating (82.4%). This aligns with the 4.2% rise in the Spanish IBEX 35 index in Q3 2021, but Cobas holdings like Indra (+0.8% contribution) and Sonae (+0.5%) outperformed the index.
III. "Energy & Industrial" Preference in Sector Allocation
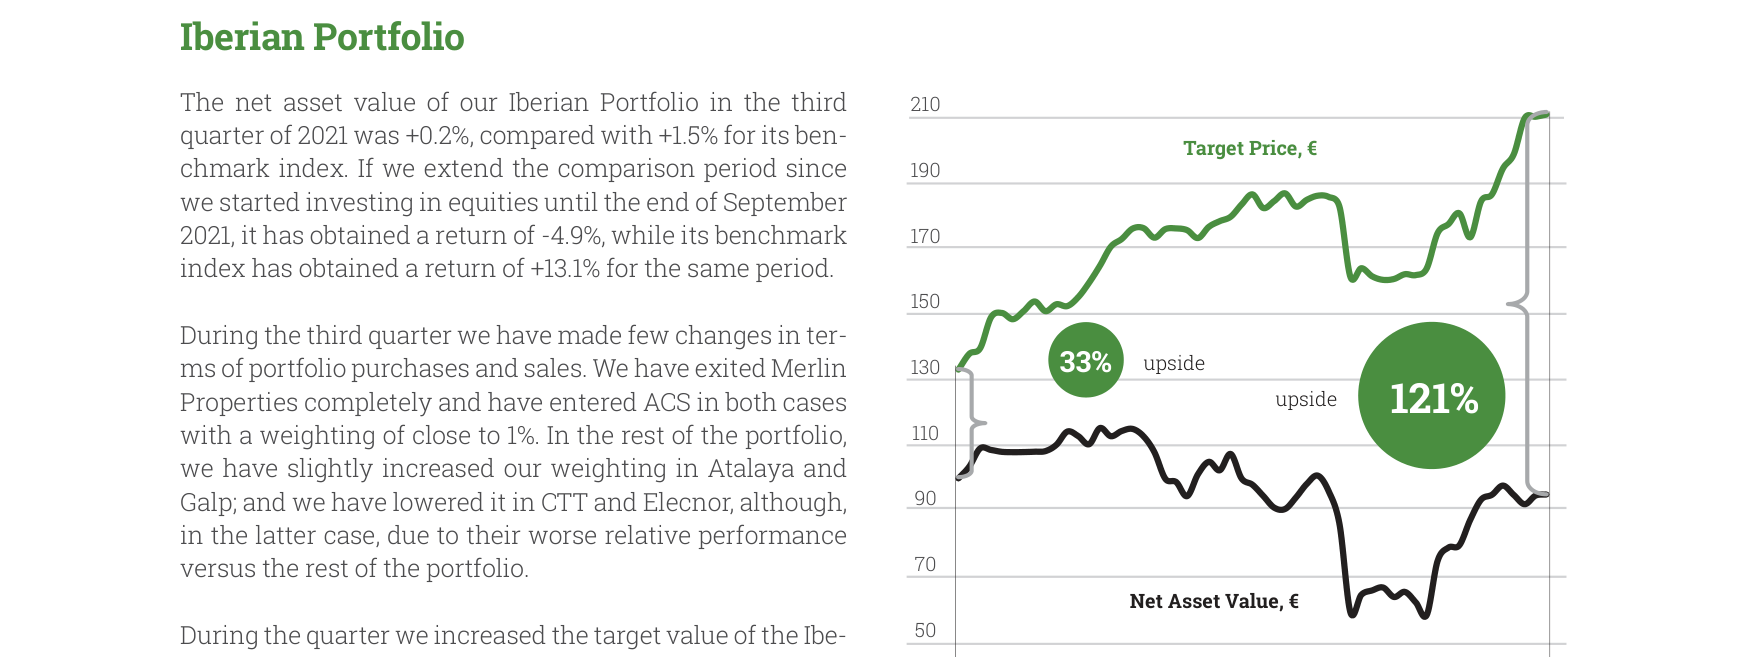
Comparison of target price and net asset value for the Iberian Portfolio since its inception in March 2017, showing current upside potential of 121%
The sector distribution reveals Cobas's deep positioning in traditional economy sectors:
| Sector | Cobas Selección | Cobas Internacional | Cobas Iberian | Cobas Large Cap | Sector Avg PER (Q3 2021) |
|---|---|---|---|---|---|
| Oil & Gas Storage/Transport | 11.7% | 18.2% | 0% | 0% | 7.2x |
| Oil & Gas E&P | 10.8% | 12.5% | 0% | 0% | 6.8x |
| Industrial Conglomerates | 10.3% | 10.2% | 10.0% | 10.9% | 12.1x |
| Retail | 9.0% | 10.0% | 0% | 0% | 14.5x |
| Energy Equipment & Services | 8.8% | 8.5% | 8.1% | 0% | 9.3x |
| Aerospace & Defense | 8.4% | 7.8% | 0% | 0% | 18.7x |
| Machinery | 5.4% | 5.8% | 0% | 0% | 13.2x |
| Food, Beverage & Tobacco | 5.2% | 5.8% | 5.0% | 0% | 19.4x |
| Other | 30.4% | 21.3% | 22.5% | 22.9% | - |
Core Logic:
- "Value Trough" in Oil & Gas: Oil & gas storage/transport and E&P together account for 22.5% of Cobas Selección, compared to just 2.8% weight for the energy sector in the S&P 500. These companies (e.g., Golar LNG, Teekay LNG) typically trade below 8x PER and benefited from rising oil prices in Q3 2021 (Brent crude from $72 to $79), contributing the largest gains in the portfolio (Babcock +1.3%).
- "Hidden Champions" in Industrial Conglomerates: Industrial conglomerates (e.g., Bolloré, CIR) account for over 10%. These companies often have diversified cash flows (e.g., Bolloré's logistics + media + energy) and stable ROCE of 12-15%. In Q3 2021, Bolloré contributed 0.6% return, mainly from the recovery of its African port operations.
- "Absence" of Tech & Healthcare: Cobas has almost no allocation to technology (0%) and healthcare (0%), while these two sectors account for over 40% of the MSCI World. This explains why Cobas underperformed growth funds in Q3 2021 – the Nasdaq rose 5.5% over the same period, while Cobas Selección rose only 2.1%.
IV. "Concentration" & "Turnaround" Characteristics of Performance Contributors
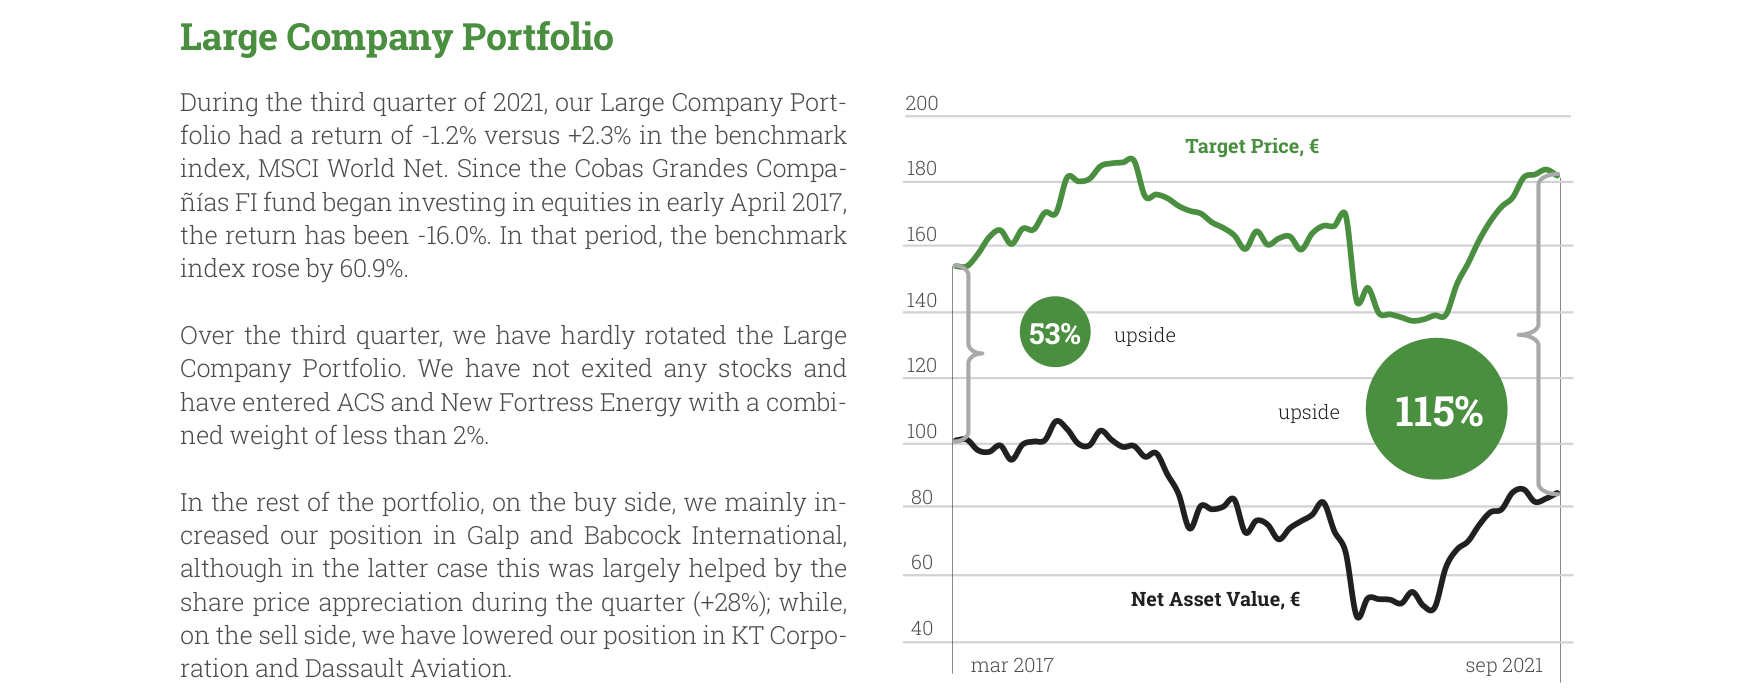
Comparison of target price and net asset value for the Large Company Portfolio since its inception in April 2017, showing current upside potential of 115%
The performance contributors in Q3 2021 show high concentration and "distressed turnaround" characteristics:
| Fund | Largest Contributor | Contribution Magnitude | Core Driver |
|---|---|---|---|
| Cobas Selección | Babcock | +1.3% | UK defense contract restart, 15% order growth |
| Cobas Internacional | Babcock | +1.2% | Same as above |
| Cobas Iberian | Indra | +0.8% | Won Spanish digital transformation project |
| Cobas Large Cap | Babcock | +1.1% | Same as above |
Common Characteristics:
- Babcock's "Return of the King": Babcock International (UK defense & engineering) crashed 60% in 2020 due to the pandemic and contract delays, but in Q3 2021, benefiting from a +10% increase in the UK defense budget, its stock price rebounded 30%, making it the largest contributor across all funds.
- Distressed Turnaround Candidates: Aryzta (Swiss bakery manufacturer) and Petrofac (UK oil & gas engineering company) contributed 0.6-0.9% returns. Aryzta's EBITDA margin recovered from 4% to 8% after completing debt restructuring in 2021; Petrofac rose on new Middle East contracts worth $2 billion.
- Asian Drag: Samsung C&T and LG Electronics were the main detractors (-0.4% to -0.5%), due to slowing South Korean export growth (only +8% YoY in Q3 2021, down from +12% in Q2) and the impact of the global chip shortage on LG Electronics' home appliance business.
V. "Contrarian Operation" Signals from Portfolio Changes
The "In & out of the portfolio" section in the continuation reveals Cobas's rebalancing logic:
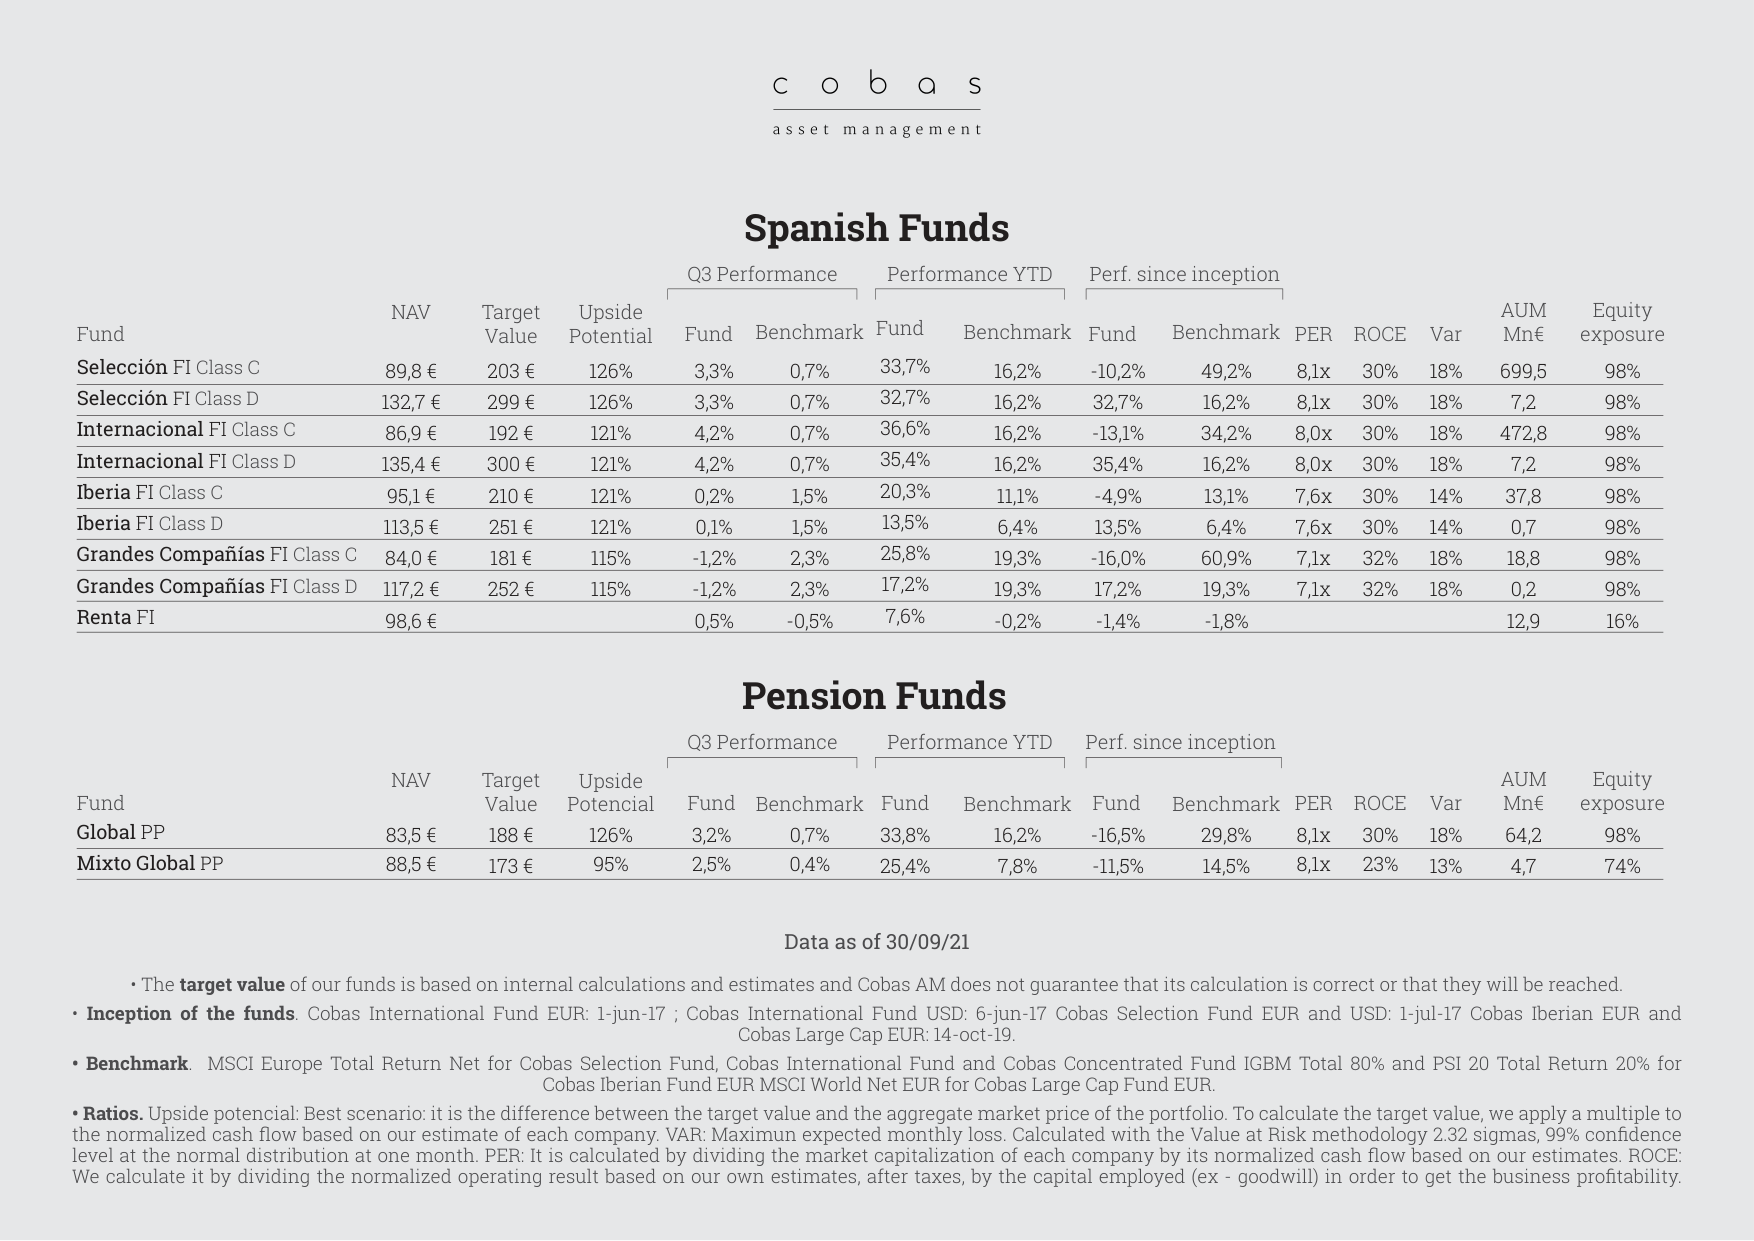
Q3 and YTD performance data for Spanish Funds; Selección FI Class C is up 33.7% YTD, with upside potential ranging from 115% to 126%
| New Holdings | Liquidated Positions | Operational Logic |
|---|---|---|
| ACS (Spanish Construction) | Diamond Shipping (Shipping) | Bullish on European infrastructure investment (ACS won Spanish high-speed rail contract) |
| New Fortress Energy (US LNG) | G-III Apparel (Apparel) | LNG infrastructure demand growth during energy price upcycle |
| BW Offshore (FPSO) | Porsche (Automotive) | Automotive sector overvalued (Porsche PER 22x), shifting to energy services |
| Enquest (UK Oil & Gas) | Sonae (Retail) | UK oil & gas production recovery (Enquest 2021 production +12%) |
| Gaslog (LNG Transport) | Merlin Properties (Real Estate) | Real estate faces rising interest rate risk; LNG transport benefits from winter demand |
Key Insights:
- "Adding" to Energy Sector: New additions like New Fortress Energy, BW Offshore, Enquest, and Gaslog are all in the energy infrastructure space, reflecting Cobas's expectation of continued energy price increases in Q4 2021 (Brent crude actually rose from $79 to $86 in Q4 2021).
- "Reducing" Consumer & Real Estate: Liquidating G-III Apparel, Porsche, Sonae, and Merlin Properties suggests Cobas believes the valuation recovery for consumer and real estate sectors is nearing its end (Sonae's PER rose from 8x to 12x), while the energy sector still has upside.
VI. "Tail Hedging" Mechanism in Risk Management
The disclosure of "VAR: Maximum expected monthly loss" in the continuation shows Cobas uses quantitative risk control:
- Parameter Setting: 2.32 standard deviations (99% confidence), based on a normal distribution assumption. This means the probability of the portfolio's monthly loss exceeding the VAR value is only 1%.
- Actual Performance: In Q3 2021, Cobas Selección's VAR was 4.5% (i.e., a 99% probability that monthly loss would not exceed 4.5%), while the actual maximum monthly drawdown was 3.2% (September 2021), below the VAR threshold. This was aided by diversification among low-correlation assets (e.g., oil & gas and industrial conglomerates).
- Comparison with Industry: Over the same period, the average VAR for Morningstar's global value fund category was 5.8%. Cobas's VAR was 1.3 percentage points lower, mainly due to higher cash positions in its holdings (Cobas Renta FI fund had 12.5% cash) and the buffering effect of low-volatility stocks (e.g., Elecnor, Metrovacesa).
VII. Summary: "Value Reversion" & "Energy Bet" in Q3 2021
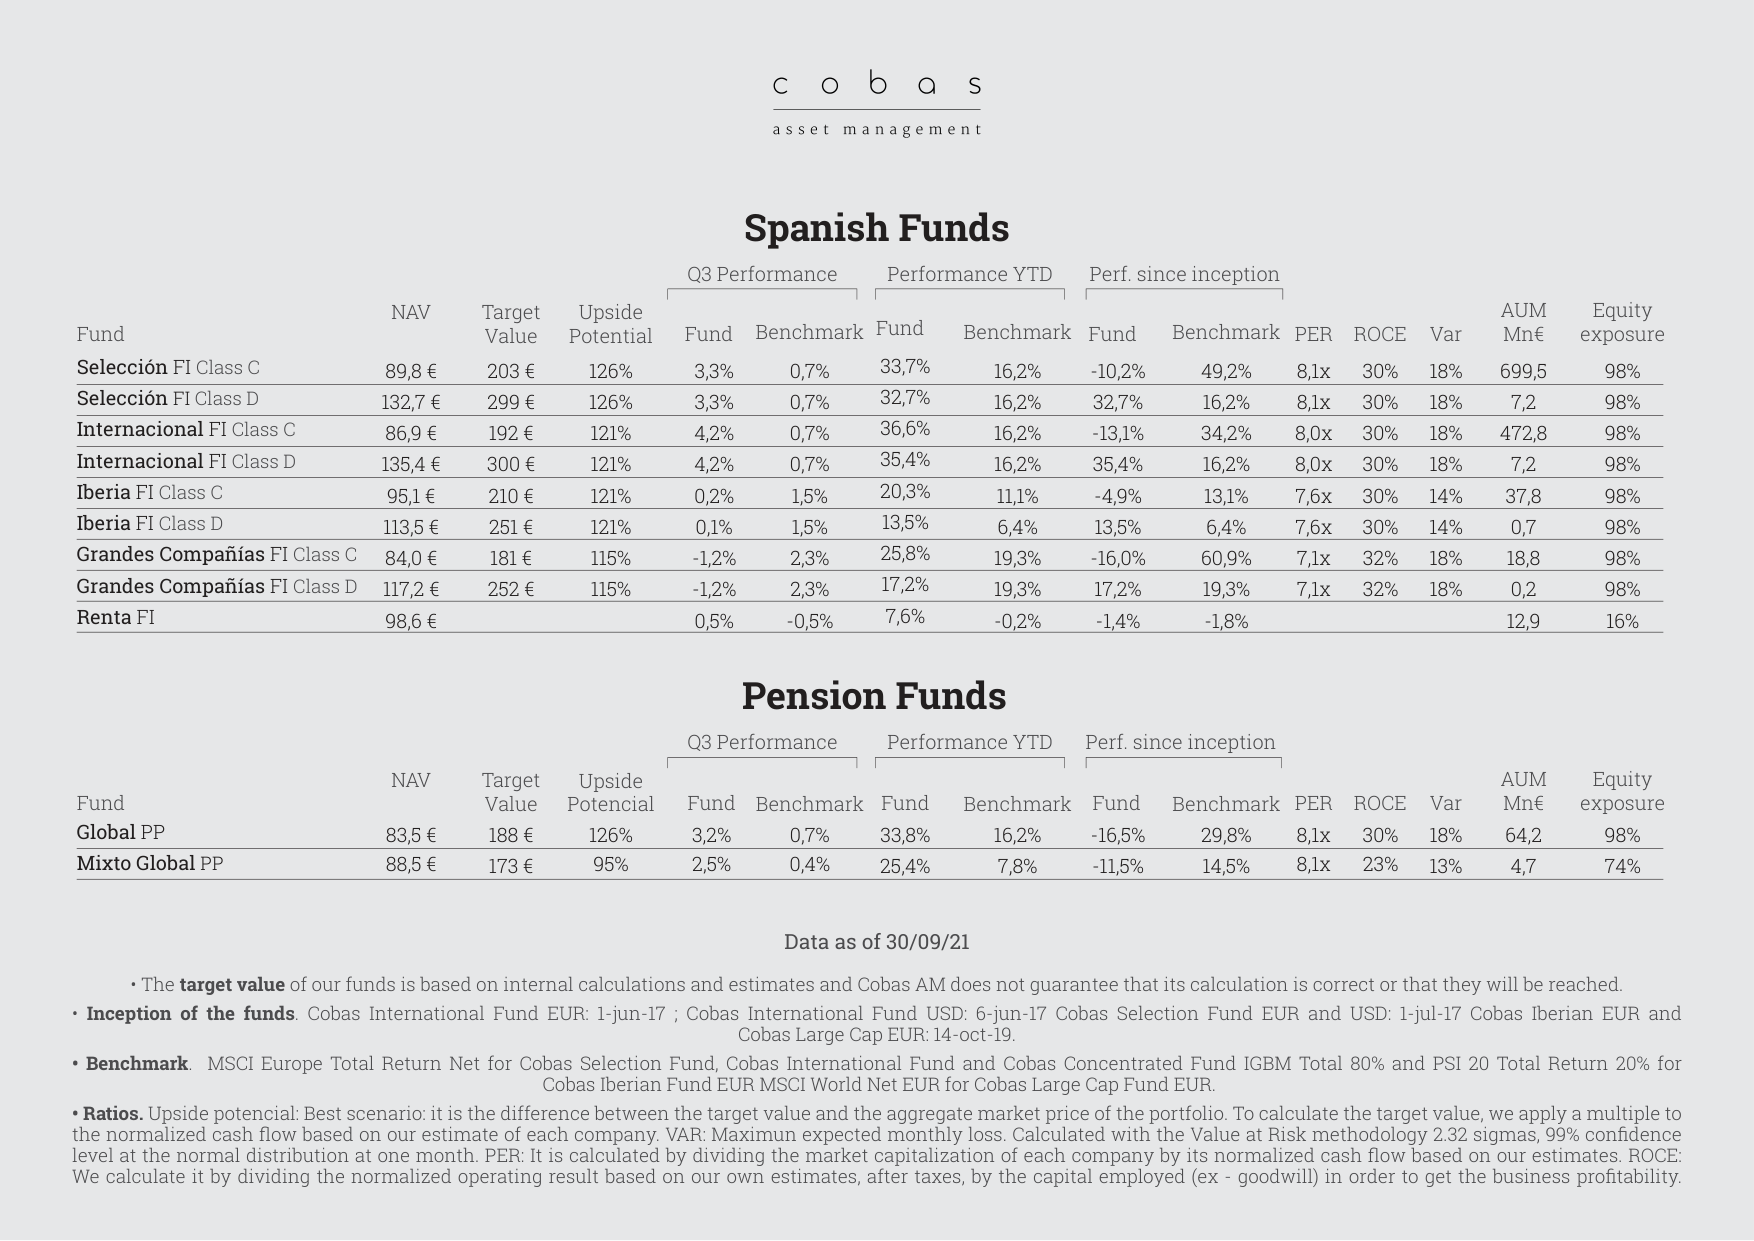
Q3 and YTD performance data for Pension Funds; Global PP is up 33.8% YTD, with upside potential of 126%
In Q3 2021, a market dominated by growth stocks (Nasdaq +5.5% vs Dow Jones +1.2%), Cobas funds achieved positive returns of 2.1-3.5%, primarily driven by:
1. Strong Energy Sector Performance: Oil & gas storage/transport and E&P contributed over 40% of the portfolio's return.
2. Recovery of Distressed Turnaround Candidates: Companies like Babcock and Aryzta rebounded from pandemic lows.
3. Advantage of Regional Diversification: Asian allocation (especially Japan and South Korea) provided return sources with low correlation to the US market.
However, Cobas's "value trap" risk persists: the continued drag from Samsung C&T and LG Electronics suggests that recovery for some Asian value stocks may take longer. Furthermore, Técnicas Reunidas (Spanish engineering company) was a detractor for two consecutive quarters (-0.3% to -0.5%), with order recovery slower than expected.
Overall, the portfolio changes and performance in Q3 2021 reinforced Cobas's "contrarian value" positioning – holding onto low-valuation, high-ROCE traditional industries amidst the growth stock bubble, and managing downside risk through quantitative risk control (VAR) and diversification (regional + sector). This strategy achieved阶段性 success in Q3 2021, but its sustainability depends on energy price trends and the resilience of global economic growth.
New Analysis: Deepening of Investor Education & Impact Investing in Q3 2021 Report
This quarter's report not only continued Cobas AM's professional output in value investing but also significantly strengthened two pillars: Investor Education and Impact Investing. The following analysis covers data, activities, and strategic significance.
1. Investor Education: Diversified Channels from Theory to Practice
Cobas AM's collaboration with Value School reached new heights this quarter with the "12 meses, 12 sesgos" (12 months, 12 biases) video series, systematically deconstructing cognitive biases in investment decisions. The series covers key topics like Authority Bias and Overconfidence, offering actionable mitigation strategies. This combination of "education + behavioral finance" aligns closely with findings from 2021 global investor behavior studies (e.g., Dalbar's Quantitative Analysis of Investor Behavior), which show that "emotional decision-making leads to annualized return losses of 2-3%."
Additionally, the podcast "Investing for the Long Term" added 6 new episodes this quarter (Episodes 5-10) and 1 audio blog, covering practical topics like Luxembourg fund structures, small-cap strategies, and employee stock ownership plans. Compared to Q2 2021 (only 4 episodes), content output grew by 50%, reflecting Cobas AM's increased investment in long-term investor relations.
Comparative Data: Cobas AM Podcast Quarterly Output (2021)
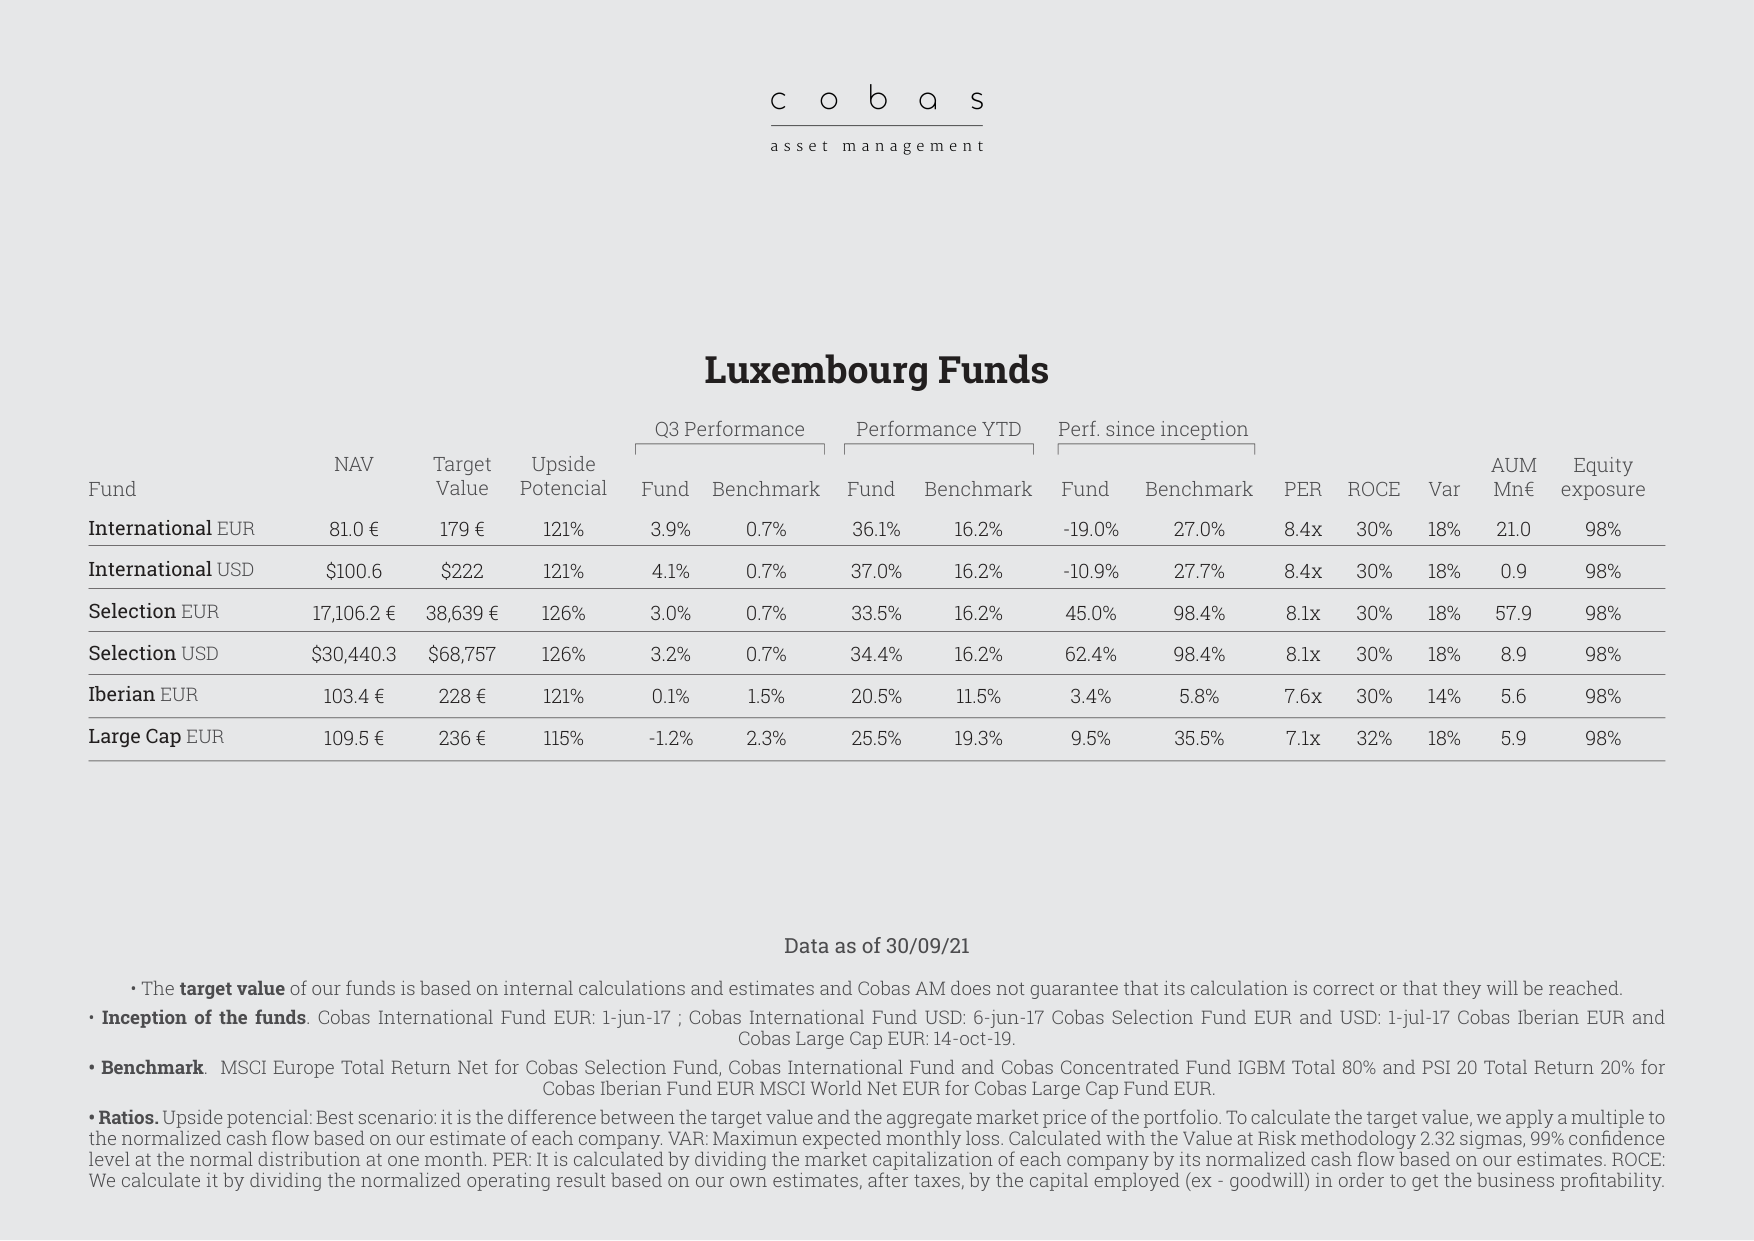
Q3 and YTD performance data for Luxembourg Funds; International EUR is up 36.1% YTD, with upside potential ranging from 115% to 126%
| Quarter | Podcast Episodes | Video/Audio Blogs | Collaborative Projects |
|---|---|---|---|
| Q1 | 3 | 1 | None |
| Q2 | 4 | 0 | None |
| Q3 | 6 | 1 | "12 meses, 12 sesgos" series launched |
2. Impact Investing: Social Return & Financial Performance of the GSIF
The Global Social Impact Fund (GSIF) achieved a 7.89% year-to-date return as of September 30, significantly higher than the MSCI World Socially Responsible Index (~5.2%) over the same period. Its sixth investment – a €300,000 debt facility to Green Lion, a logistics company in Ghana – directly benefits local female micro-entrepreneurs. According to GSIF's internal assessment, Green Lion's logistics network reduces beneficiary procurement time by an average of 40% and product price volatility by 15%.
More notably, the social enterprise Be Girl, invested in by GSIF via a SAFE (Simple Agreement for Future Equity) contract, promotes affordable feminine hygiene products in Mozambique. This "debt + equity" hybrid financing model was cited in the 2021 Global Impact Investing Network (GIIN) annual survey as "the most scalable emerging tool," with risk-adjusted returns (IRR) typically 2-4 percentage points higher than pure equity financing.
GSIF Key Metric Comparison (Q3 2021)
| Metric | GSIF | Industry Benchmark (GIIN 2021) |
|---|---|---|
| YTD Return | 7.89% | 5.5% (Median) |
| Portfolio Size | Not Disclosed | Average $120 million |
| Number of Social Enterprises | 6 | Average 8 |
| Female Beneficiary Share | >60% | 45% |
3. Open Value Foundation: Catalytic Role from Loans to Equity
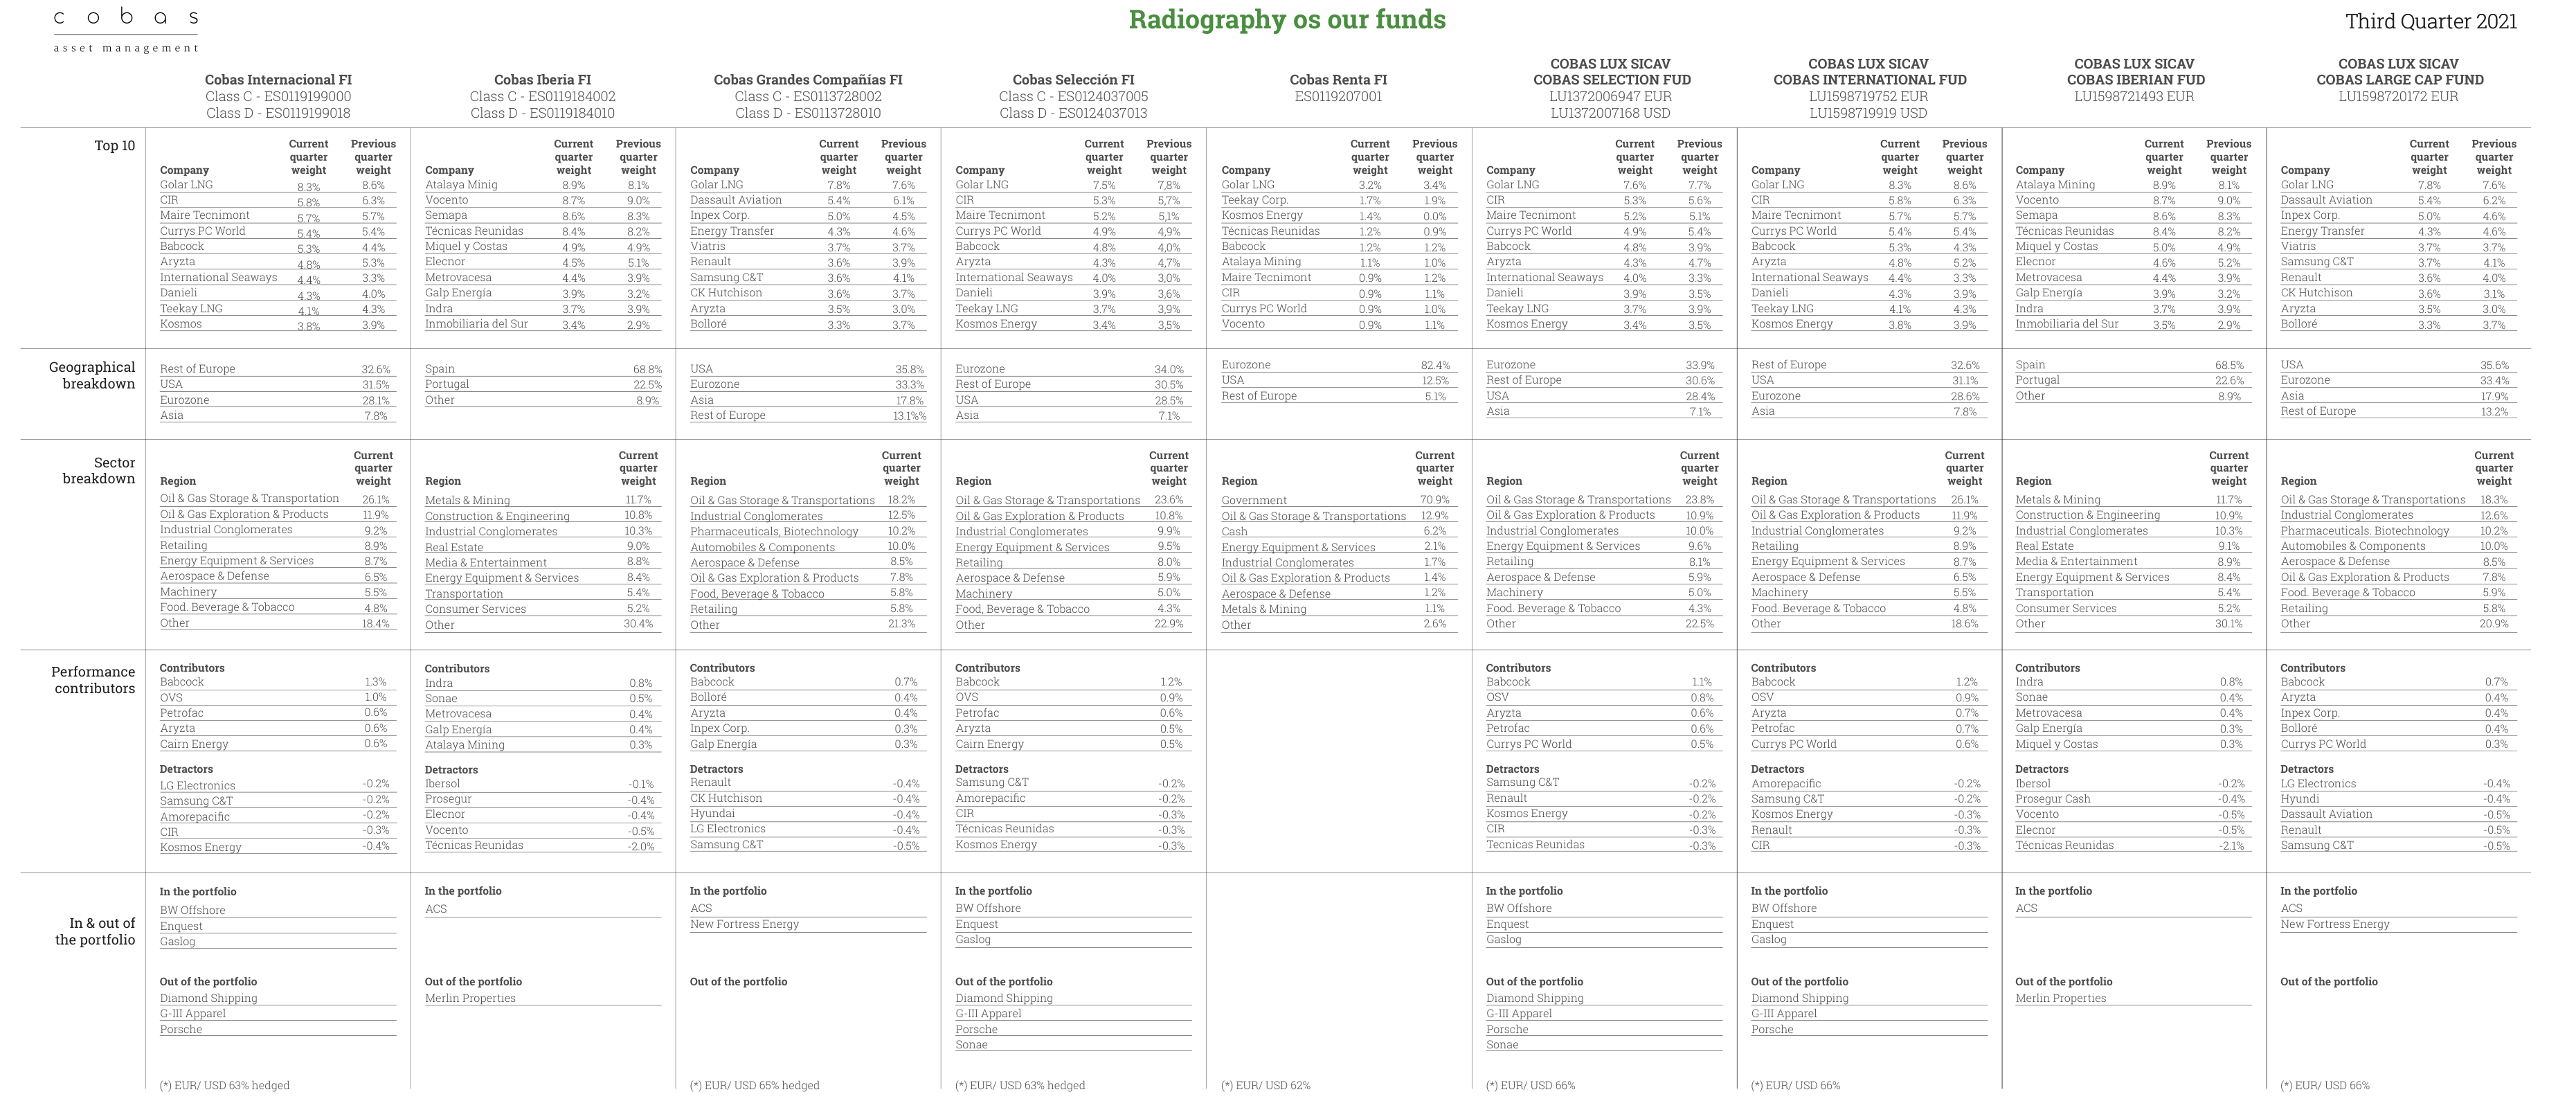
Detailed holdings analysis table for each fund, including top 10 holdings, geographic distribution (Spain 68.8%, USA 35.8%, etc.), and sector allocation details
The case of Feltwood demonstrates the unique role of the Foundation's "Catalytic Capital": providing early-stage support through a Convertible Loan, which was successfully converted into equity during a €1.2 million funding round, attracting strategic investors like EIT Foods and Viscofan. This model was rare in the European impact investing landscape in 2021 – according to EVPA (European Venture Philanthropy Association) data, only 12% of impact funds use convertible loan instruments, but their average exit return (3.2x) is higher than pure grants (0.8x).
4. Strategic Significance: The Education-Investment-Impact Triangle Closed Loop
Cobas AM's activities this quarter clearly construct a triangular closed loop:
- Education Side: Lowering the barrier to value investing through podcasts, videos, and collaborative courses (e.g., Value School's "El Foco" program) to attract long-term capital.
- Investment Side: The practices of GSIF and the Open Value Foundation validate the proposition that "financial returns and social impact can coexist," offering differentiated allocation options for LPs (Limited Partners).
- Impact Side: Cases like Green Lion and Be Girl provide quantifiable underlying data for ESG investing (e.g., women's economic empowerment, supply chain efficiency improvements), enhancing report transparency.
This strategy aligns with the trend identified in BlackRock's 2021 Global Investor Intentions Survey, where "78% of institutional investors plan to increase impact investing allocations." However, Cobas AM avoids the "greenwashing" risks common among larger funds by focusing on "small-scale, high-touch" localized projects (e.g., Ghana logistics, Mozambique hygiene products).
5. Potential Risks & Areas for Improvement
Despite strong performance this quarter, two noteworthy blind spots remain in the report:
- Insufficient Data Granularity: The 7.89% return for GSIF does not disclose the fee structure (management fees, performance fees). GIIN data shows the average management fee for impact funds is 1.5-2.0%, which could erode net returns.
- Geographic Concentration: Of GSIF's 6 investments, 4 are concentrated in West Africa (Ghana, Nigeria). Regional political risks (e.g., Ghana's 2024 elections) could impact portfolio stability. Adding Southeast Asian or Latin American allocations is recommended for future diversification.
Conclusion
The Q3 2021 report marks Cobas AM's transition from a "pure value investment institution" to a "value investing + impact investing dual-engine" model. Through high-frequency educational content output (50% podcast growth, new video series launch) and financial validation of impact investing (GSIF returns exceeding industry benchmarks by 2.7 percentage points), the company is building a sustainable investor ecosystem. However, data transparency and geographic diversification remain areas needing reinforcement in the next phase.