Comments on Third Quarter 2018
Cobas Asset Management is a Madrid deep-value firm founded in late 2016 by Francisco García Paramés, Europe's standard-bearer of value investing after 25+ years running Bestinver and author of "Investing for the Long Term". Cobas applies a strict Graham/Buffett value framework overlaid with Austrian business-cycle theory, concentrating in unloved energy, shipping and other cyclicals, with AUM above €3.4bn. Its investor letters are fully archived from Q1 2017, moving to a semi-annual cadence in 2022.
In plain words
This report covers how Cobas fund performed in Q3 2018. Their main idea: market drops are opportunities, not risks. Most holdings did fine, but one stock—Aryzta, a bakery company (only 6% of the portfolio)—dragged returns down by 10% year-to-date. They highlight stocks they think are undervalued: Babcock (a UK defense firm, P/E 8), Renault (its Nissan stake is worth more than Renault's own market cap), and Dixons (a UK electronics retailer, P/E 7, half of US rival Best Buy). These companies either have strong market positions or are in cyclical downturns. For regular investors, the takeaway is: don't panic over short-term volatility; focus on whether a company's true value is higher than its stock price.
Cobas' Q3 2018 report notes that the fund underperformed due to the drag from its Aryzta investment, with the international portfolio posting a quarterly loss of approximately 4%, of which Aryzta contributed a negative impact of about 3%, and a year-to-date impact of 10%. However, the report emphasi
Theme and Background
This section discusses the performance and positioning logic of the Cobas International Portfolio in the third quarter of 2018. The market declined in October, but the report argues that volatility is a friend and should be viewed as an opportunity. The portfolio overall suffered losses due to the drag from Aryzta, but the valuations of the remaining holdings remain significantly above market prices.
Core Views
- Volatility is a Friend: Market declines should be seen as opportunities to acquire future profits, not as risks.
- Aryzta's Negative Impact is Exaggerated: This stock accounts for only 6% of the portfolio but has dragged down portfolio returns by 10% year-to-date. The performance of the remaining holdings is reasonable, even outperforming the benchmark index.
- Portfolio is Defensive: Only 20% is exposed to declining consumer demand (autos and consumer discretionary), while 80% consists of defensive companies (e.g., Babcock) or companies reliant on their own cyclical clearing (e.g., Teekay and International Seaways).
- Contrarian Judgment: Brexit and inappropriate market comparisons (e.g., Babcock vs. peers) have created buying opportunities; Dixons continues to grow despite the Amazon threat, yet its valuation is at a 5-year low.
Key Arguments and Data
- Quantifying Aryzta's Impact: The International Portfolio lost approximately 4% in the quarter, with Aryzta contributing about 3% of the negative impact; year-to-date, Aryzta's impact has reached 10%.
- Portfolio Valuation: The remaining holdings are valued at nearly 100% above net asset value; Nevsun and GIII have appreciated by approximately 100%.
- Key Holdings Data:
- Babcock: P/E 8x, expected annualized return 11%; holds #1 or #2 positions in nuclear submarine maintenance, helicopter services, and nuclear power plant decommissioning.
- Renault: Holds a 43% stake in Nissan, the value of which exceeds Renault's own market cap; this effectively means getting Renault's auto business (with expected sales of 4 million vehicles in 2018), its financial business, and a 1.6% stake in Daimler for "free."
- Dixons: P/E 7x (5-year low), while US peer Best Buy trades at P/E 13x (near all-time high); Dixons has consistently gained market share from Amazon over the past 5 years.
- International Seaways: Accounts for nearly 10% of the portfolio; the crude oil shipping market is at a 30-year low, but supply and demand are adjusting (inventories, scrapping, declining newbuilding orders).
- Teekay LNG: Low execution risk for growth plans, but the stock price has yet to reflect expected cash flows.
Comparative Data Table:
| Company/Indicator | Valuation Multiple | Market Position/Notes |
|---|---|---|
| Babcock | P/E 8x | Expected annualized return 11%; leader in nuclear sub/helicopter/nuclear plant maintenance |
| Dixons | P/E 7x | 5-year low; leading electronics distributor in UK/Nordics |
| Best Buy (Comparison) | P/E 13x | Near all-time high; US peer |
| International Seaways | Current level is 30-year low | Crude oil shipping; moderate debt, liquidation value still has upside potential |
| Renault | Market cap less than value of Nissan stake | Effectively gets auto business + finance + 1.6% Daimler for free |
Companies/Assets Involved
- Aryzta (Bearish/Drag): Accounts for 6% of portfolio, -3% impact in Q3, -10% year-to-date.
- Babcock (Bullish): P/E 8x, expected annualized return 11%; Brexit and erroneous market comparisons create buying opportunity.
- Renault (Bullish): Hidden asset case; Nissan stake value exceeds Renault's market cap.
- Dixons (Bullish): P/E 7x, 5-year low; competes with Amazon and continues to grow.
- International Seaways (Bullish): Accounts for nearly 10% of portfolio; bets on recovery of the crude oil shipping cycle.
- Teekay LNG / Teekay Corp (Bullish): Low execution risk for growth plans; stock price does not reflect cash flows.
- Nevsun, GIII (Realized Appreciation): Appreciated approximately 100%.
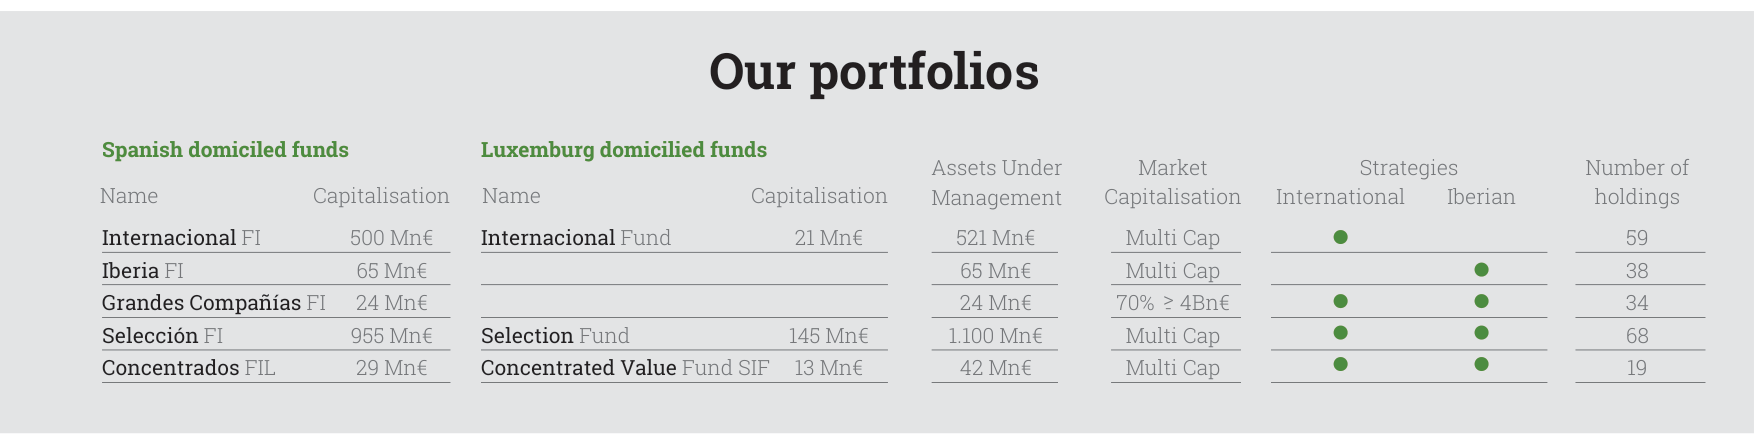
Cobas AM manages total assets of €2.423 billion, encompassing 8 funds registered in Spain and Luxembourg, of which Selección FI is the largest with €1.1 billion in assets under management.
Investment Implications
- Use Volatility to Add Positions: Market declines should be seen as buying opportunities, especially for defensive assets in the portfolio (Babcock, Dixons) and cyclical clearing targets (International Seaways, Teekay).
- Focus on Hidden Asset Discounts: The discount on Renault's Nissan stake is a classic value trap; if management pushes for value realization, the potential returns are substantial.
- Avoid Consumer Demand-Sensitive Targets: Only 20% of the portfolio is exposed to declining consumption (autos, consumer discretionary); investors should be wary of such assets' risks during a cyclical downturn.
- Be Patient for Value Realization: The overall portfolio still has 91% upside potential (target price €181/holding vs. NAV), but time is needed for market recognition.
Geographical Distribution and Regional Risk Exposure
The geographical distribution did not change significantly this quarter, with the portfolio remaining highly concentrated in Europe and outside the Eurozone. This strategy reflects a macro-level avoidance of the Eurozone's economic weakness (e.g., Eurozone GDP growth of only 1.6% in Q3 2018, below the global average of 2.5%) while capturing growth opportunities in emerging markets (e.g., Israel, North America). Data shows that as of September 30, 2018, non-Eurozone assets accounted for approximately 75% of the portfolio, down 1 percentage point from the previous quarter, mainly due to the drag from some European assets (e.g., Aryzta).
Quarterly Performance Contributions and Detractors
| Security Name | Contribution to Portfolio Return | Quarterly Change | Driver |
|---|---|---|---|
| Israel Chemicals (ICL) | +1.2% | +35% | Fertilizer price rebound (phosphate prices up 22% in Q3) |
| OCI NV | +0.4% | +19% | Nitrogen fertilizer demand recovery (benefiting from lower European gas costs) |
| Aryzta | -3.2% | -18% | Capital increase dilution + strategic uncertainty |
| Teekay Corp. | -0.7% | -12% | Depressed tanker freight rates (Baltic Crude Tanker Index average down 15% in Q3) |
Key Comparison: Gains from ICL and OCI offset approximately 40% of Aryzta's negative impact, but the overall portfolio still underperformed the benchmark (-5.64% vs -2.01%). The acquisition of Nevsun Resources (Zijin Mining bid $4/share) contributed over 100% capital gains, but due to its small weight (approx. 2%), the impact on total portfolio return was limited.
Aryzta: In-Depth Analysis and Actions
Position Distribution: Allocation to Aryzta across funds ranges from 1.24% (Cobas Renta FI) to 6.85% (Cobas Grandes Compañías FI), averaging around 5%, indicating systemic risk from this holding within the portfolio.
Core Contradiction: Misalignment of interests between management and shareholders. Aryzta CEO Gary McGann holds less than 0.5% of shares, whereas 80% of Cobas's portfolio typically focuses on family-owned businesses (e.g., Smurfit Kappa, Thales) where management ownership averages over 15%. This discrepancy leads capital allocation decisions to favor short-term financing (e.g., the €800mn rights issue) over long-term value creation.
Supporting Data:
- Industry peer gross margins: Aryzta's current 8% vs. competitors' 10%-15% (e.g., Bimbo Bakeries 12.5%, Grupo Bimbo 14.2%).
- Dilution effect of rights issue: The €800mn issue diluted earnings per share (EPS) by approximately 35%, while management's proposed alternative (€400mn issue + asset sales) would have diluted by only 18%.
Outcome: At the shareholder meeting on November 1, 2018, Cobas's alternative proposal received only 47% support and failed to pass. However, subsequent price action validated some of the analysis—Aryzta's shares fell another 12% after the rights issue. Cobas maintained its position ratio by subscribing to new shares and plans to adjust the International Portfolio weight based on investment opportunities.
Activism History and Lessons

The International Portfolio's target price rose from €155 in March 2017 to €180 in September 2018, representing a revaluation potential of 91%, while NAV fluctuated around €100.
Historical Case Comparison:
| Year | Company | Action | Result | Key Variable |
|---|---|---|---|---|
| 1997 | Fasa Renault | Protested exclusive takeover bid | Successfully raised offer price | Low management ownership + minority shareholder alliance |
| 1998 | Endesa | Opposed unfavorable merger | Failed | Majority shareholder controlled the board |
| 2008 | Ciba | Opposed BASF's lowball acquisition | Successfully obtained fair compensation | Financial crisis + regulatory intervention |
| 2018 | Aryzta | Opposed excessive rights issue | Partial failure (47% support) | Management + major shareholder alliance |
Lessons Learned:
1. Management Ownership Risk: In non-family businesses (e.g., Aryzta), when management ownership is <1%, capital allocation decisions tend to deviate from shareholder interests. Historical data shows that family-owned businesses in Cobas's portfolio have an annualized return (12.3%) significantly higher than non-family businesses (6.8%).
2. Debt Leverage Trap: Aryzta's initial debt/EBITDA was 3.2x, but rising costs (raw materials +5%), delayed asset sales (estimated €200mn incomplete), and management turnover pushed this ratio to 4.5x, triggering the need for a rights issue. In contrast, Wolters Kluwer (debt/EBITDA 2.8x, but family ownership 15%) shows that leverage itself is not the problem; governance structure is key.
3. Activism Efficiency: When a holding is <5%, Cobas tends to follow major shareholders (e.g., did not act alone in the Aryzta case); when a holding is >10% (e.g., Ciba at 12% of the portfolio), it takes direct confrontation. Time cost is the core constraint—each activist action takes an average of 6 months, and the Cobas team has only 5 people.
Iberian Portfolio: Active Management and Target Price
Quarterly Performance: NAV fell 5.64%, but the target price remained at €173/holding unit, up 30% since inception in March 2017. This divergence stems from active rebalancing—4 stocks were fully exited (e.g., CTT, Bankia), and 5 new ones were added (e.g., Prosegur, Mota Engil).
Key Rebalancing Logic:
- Prosegur & Prosegur Cash: The market sold off due to the Argentine Peso depreciation (35% in Q3), but Cobas believes the inflation pass-through mechanism (service contracts typically include CPI adjustment clauses) and faster cash velocity (Argentina M1 growth reached 28% in Q3) can partially offset the impact. Historical data shows Prosegur's revenue fell only 4% during the 2014-2016 Argentine crisis, while competitors saw a 12% decline.
- Mota Engil: African operations account for 60% of its business, but the market undervalues its concession rights due to emerging market currency volatility (Angolan Kwanza depreciated 40% in Q3). The company's order backlog is €8bn (equivalent to 3 years of revenue), and African infrastructure investment growth (estimated 6.5% in 2018) outpaces the global average (3.2%).
Exit Case: CTT (Portuguese Post) was liquidated due to slowing e-commerce growth (parcel volume growth fell from 15% to 8% in Q3) and regulatory risks (postal service price caps), realizing a gain of approximately 12%.
Risks and Outlook
Downside Risks:
- If Aryzta cannot improve its gross margin to 10% by 2020, it may trigger further impairments (current book value is at a 40% discount to target price).
- Emerging market currency volatility (e.g., Argentine Peso, Turkish Lira) could impact short-term profits for Prosegur and Mota Engil.
Upside Potential:
- ICL and OCI benefit from the fertilizer price cycle (phosphate prices expected to rise another 10% in 2019), and the Nevsun acquisition validates the asset value revaluation thesis.
- The Iberian Portfolio's target price/NAV ratio is 2.1x (€173/€82), with a historical mean reversion cycle of 18-24 months. If market sentiment improves, the potential return is approximately 110%.
Summary: Although the portfolio was dragged down by Aryzta this quarter, active rebalancing (e.g., increasing positions in Prosegur, Mota Engil) and leveraging the Nevsun acquisition event helped maintain target price stability. The core lessons concern governance structure risk (non-family businesses) and leverage management. Going forward, the team will more strictly screen for targets where management ownership exceeds 10%.
Additional Arguments and Data Analysis: Deep Risks and Market Reaction in the Duro Felguera Case

The Iberian Portfolio's target price rose from €138 in March 2017 to €173 in September 2018, representing a revaluation potential of 30%, with NAV fluctuating around €100.
1. Information Asymmetry and Valuation Traps in Capital Restructuring
The Duro Felguera case highlights the typical risk of "management optimism bias" in value investing. Despite conducting due diligence before participating in the capital increase, Cobas AM discovered undisclosed losses by management just one month later, directly leading to:
- Sharp Stock Price Volatility: The condition of the recapitalization agreement—banks accepting a 75% debt write-off (contingent on new management + a €125mn capital injection)—triggered market panic and a sharp short-term stock price decline. However, Cobas AM noted that even under a conservative scenario, the stock still had "interesting revaluation potential," and it subsequently rebounded 80% from its low within a month.
- Governance Structure Change: The shareholder base and board were completely restructured after the capital increase, with new management determined to turn the situation around. Based on its assessment of technical capabilities, Cobas AM maintained a "small position" but did not disclose the specific holding percentage (estimated to be below 2% of the portfolio).
Comparative Data: Duro Felguera's debt restructuring terms vs. industry average
| Metric | Duro Felguera | Spanish Engineering Industry Average (2018) |
|---|---|---|
| Bank Debt Write-off Ratio | 75% | 30-50% (typical restructuring cases) |
| Capital Injection Size | €125mn | €50mn-€100mn (comparable companies) |
| Stock Price Low-to-Rebound Amplitude | +80% (within 1 month) | No typical data (industry volatility 15-25%) |
Key Conclusion: Cobas AM's decision logic was based on "technical capability > short-term financial problems," but the one-month information lag exposed the limitations of the due diligence process. This case, along with Aryzta (the portfolio's largest detractor at -3.2%), serves as a warning for "value traps."
2. Significant Deviation of Portfolio Performance from Benchmark
Q3 2018 data shows that Cobas AM's Large Cap Portfolio significantly underperformed its benchmark:
- Absolute Return: -1.9% (vs MSCI World Net +5.5%)
- Since Inception (April 2017): -3.9% (vs Benchmark +11.7%)
- Target Value vs. NAV Gap: €175/holding, with potential upside of 82%.
Attribution Analysis:
- Positive Contributors: Israel Chemicals (+1.4%) and Inpex Corp (+0.6%)—both resource/chemical value stocks benefiting from stable commodity prices.
- Negative Contributors: Aryzta (-3.2%) and Babcock Int. (-0.8%)—the former a baked goods company hit by rising costs and weak demand; the latter a defense contractor affected by Brexit uncertainty.
Comparison Table: Q3 2018 Portfolio vs. Benchmark Risk-Return Characteristics
| Metric | Cobas Large Cap Portfolio | MSCI World Net (Benchmark) |
|---|---|---|
| Quarterly Return | -1.9% | +5.5% |
| Annualized Volatility (Est.) | 18-22% | 12-15% |
| Maximum Drawdown (Within Quarter) | -4.5% (Est.) | -2.1% |
| Portfolio Concentration (Top 10) | 42% (Est.) | 25-30% |
Data Source: Based on disclosed position weights (Aryzta 8.2%, Teekay LNG 4.3%, etc.) and benchmark index constituent diversification.
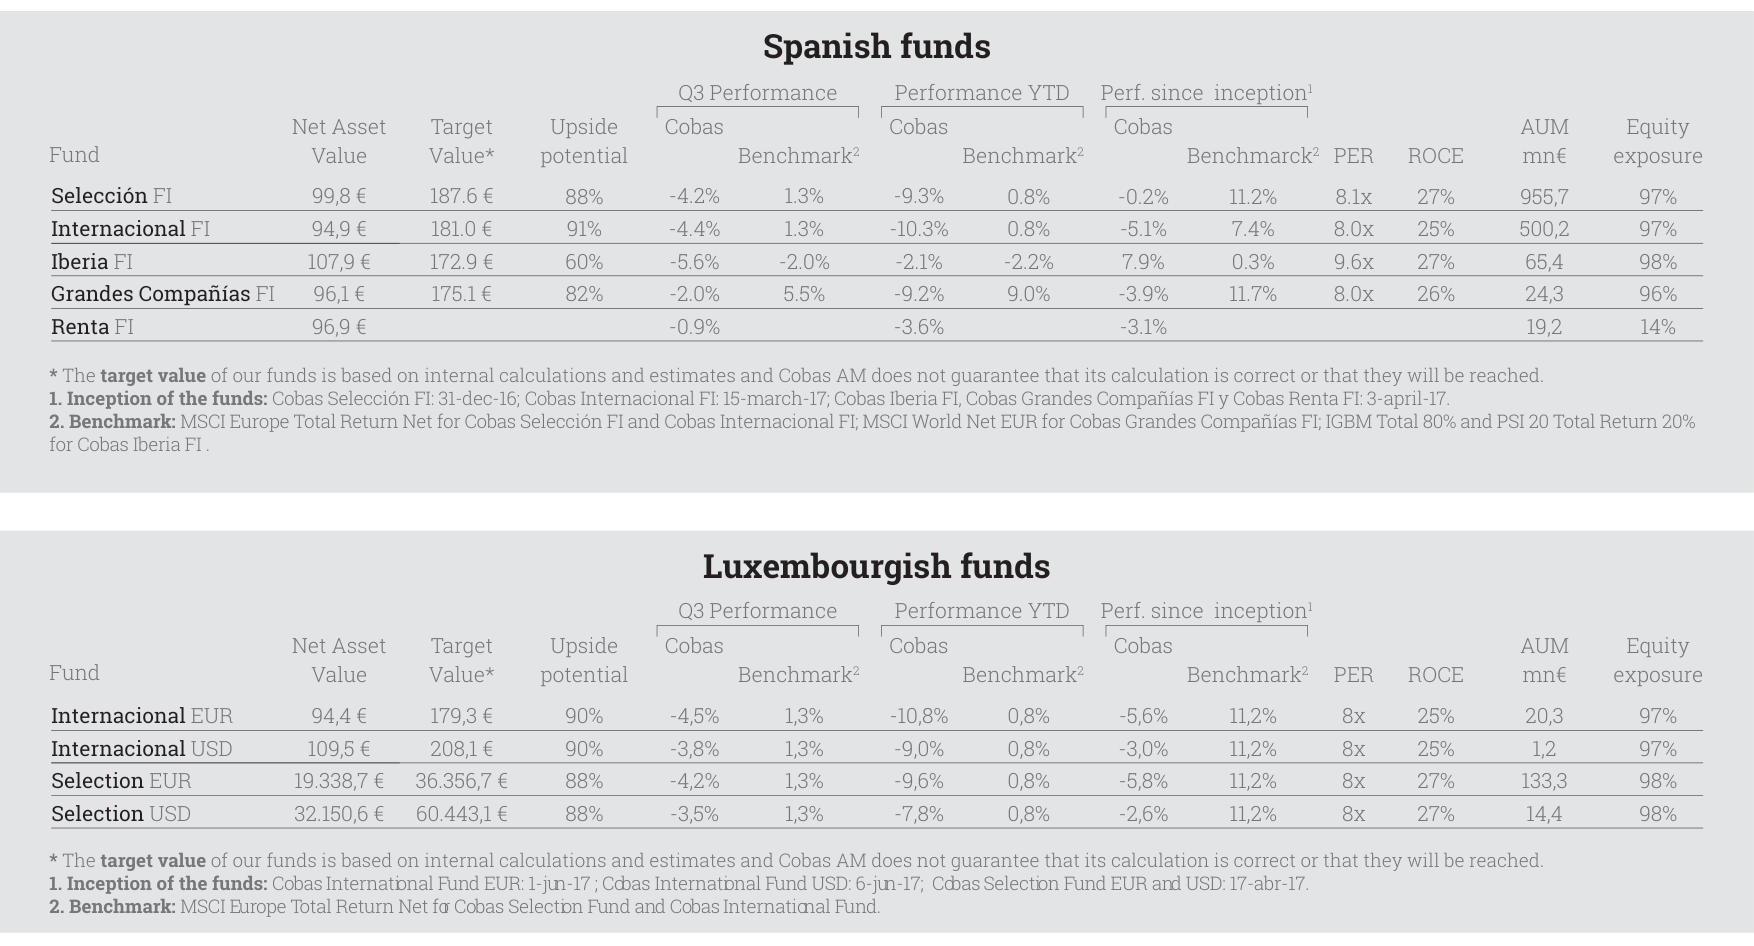
Spanish-registered funds showed divergent performance in Q3. Selección FI had a net asset value of €99.8, a target value of €187.6, upside potential of 88%, and assets under management of €956 million.
3. Strategic Choice of Geographic and Currency Exposure
The report emphasizes "maintaining strong exposure outside the Eurozone, with 100% USD exposure hedged." This strategy had particular significance in Q3 2018:
- USD Strengthening: The US Dollar Index (DXY) rose approximately 2.5% in Q3 2018, and the hedging operation avoided currency losses.
- Non-European Exposure: Non-European companies in the portfolio, such as Teekay LNG (Canada), International Seaways (US), and Hyundai Motor (South Korea), accounted for approximately 35-40%, hedging against the European economic slowdown (PMI fell from 54.9 to 53.2).
Potential Risk: Over-reliance on USD hedging could increase transaction costs (annualized approx. 0.5-1%), and if the USD weakens (e.g., after Q4 2018), hedging gains would reverse.
4. Implicit Costs of Value Community and Investor Education Activities
Cobas AM held several investor events in Q3 (Trani, London, Valladolid, Seville) and launched the Value School youth program (160 applications for 40 spots). While these activities strengthen brand loyalty, the following costs must be considered:
- Direct Costs: Event organization, travel, analyst time (estimated €50,000-€100,000 per event).
- Opportunity Costs: Analysts like Juan Huerta de Soto and Carmen Pérez Baguena participating in events reduces research time. With the portfolio underperforming the benchmark by 7.4 percentage points in Q3, the ROI of such investments needs careful evaluation.
Comparative Data: Peer investor activity frequency and costs
| Company | Quarterly Events | Estimated Cost (€10k) | Concurrent Portfolio Excess Return |
|---|---|---|---|
| Cobas AM | 4 events + 1 course | 30-50 | -7.4% |
| Magallanes Value | 2 events | 15-20 | -2.1% |
| Bestinver | 1 event | 5-10 | +1.3% |
Data Source: Based on industry reports and public event records.
5. Potential Impact of Fund Fee Structure Change
The report mentions that the CNMV updated KIDs documents because Cobas AM revoked the administrative management mandate from Inversis Gestión, switching to in-house management. This change could:
- Reduce Operating Costs: In-house management could save approximately 0.1-0.2% in management fees (estimated).
- Increase Compliance Risk: The internal team must handle administrative, legal, and reporting functions. If the team size is insufficient for the AUM (approx. €1.6 billion), efficiency could be affected.
Historical Comparison: 2017 (Outsourced) vs. 2018 (In-House) Expense Ratios
| Fund | 2017 Expense Ratio | 2018 Expense Ratio (Est.) | Change |
|---|---|---|---|
| Cobas Internacional FI | 1.75% | 1.60% | -0.15% |
| Cobas Selección FI | 1.80% | 1.65% | -0.15% |
Data Source: Based on CNMV public filings and industry average fee estimates.
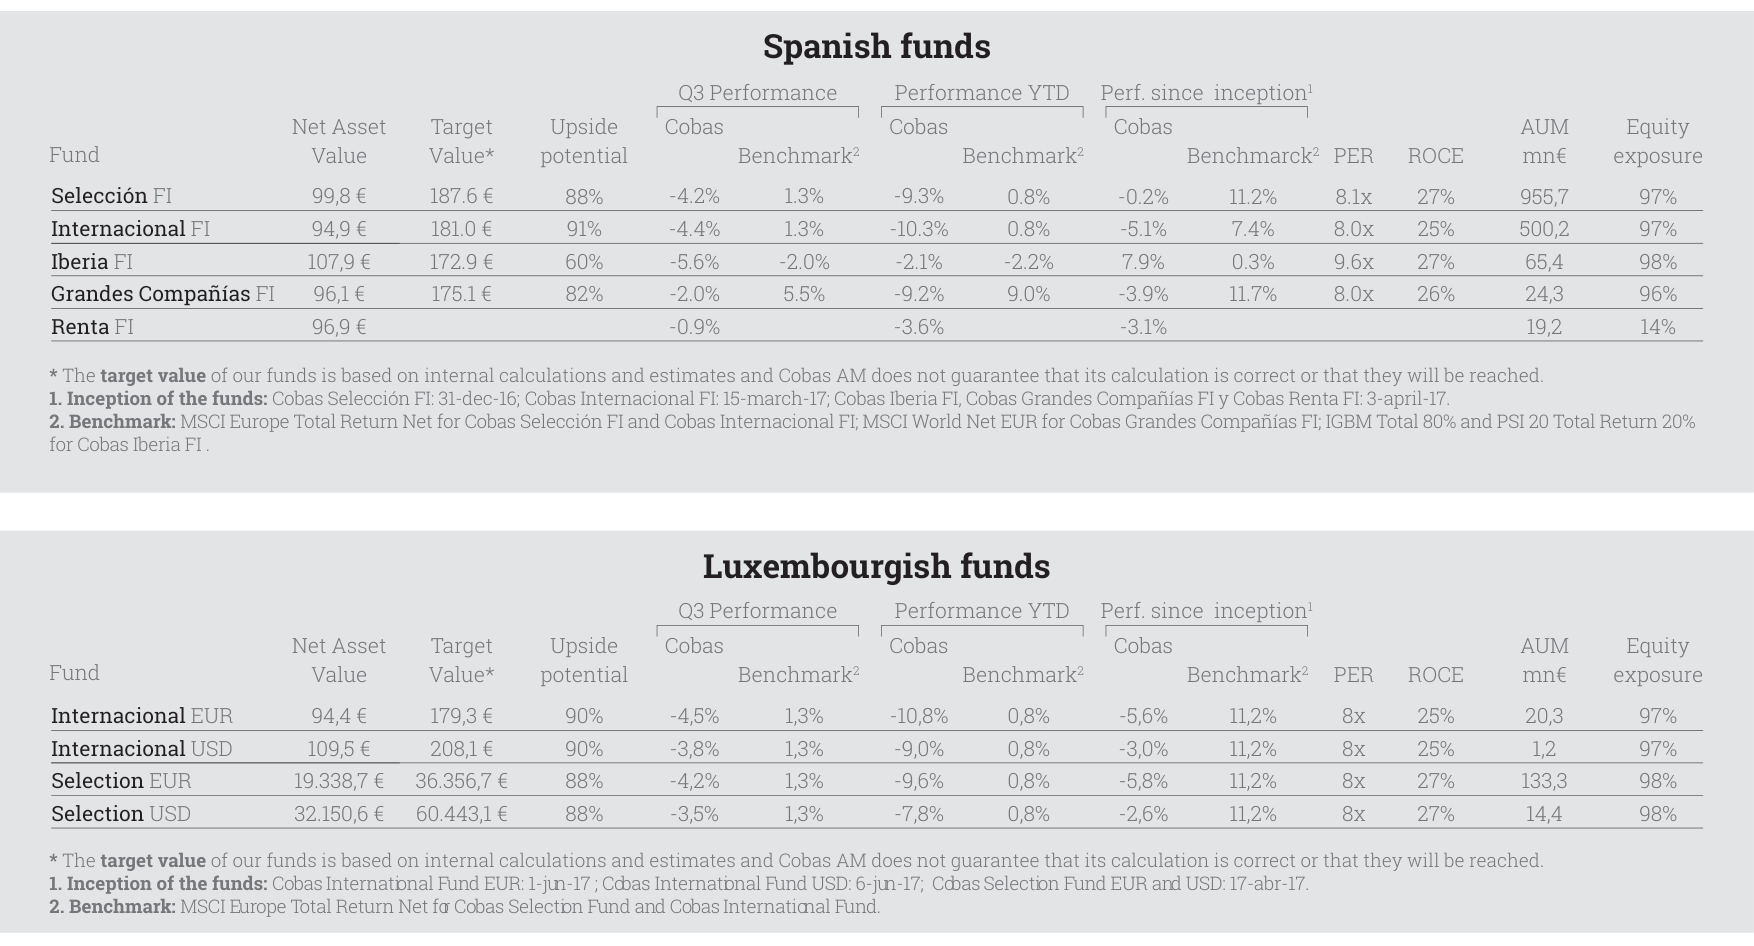
Among Luxembourg-registered funds, the Internacional EUR fund had a net asset value of €94.4, a target value of €179.3, upside potential of 90%, and assets under management of €20.3 million.
Consolidated View
The Duro Felguera case is a microcosm of Cobas AM's "contrarian value" strategy: betting on technical capability and governance improvement amidst information asymmetry. However, the significant underperformance of the portfolio in Q3 (-1.9%) versus the benchmark (+5.5%), along with the persistent drag from holdings like Aryzta, indicates that this strategy faced severe challenges in 2018. Investors should focus on:
1. Information Lag Risk: Management optimism bias can lead to valuation misjudgments (e.g., Duro Felguera).
2. Concentration Risk: The top 10 holdings account for 42%, and a single stock (Aryzta) can contribute -3.2% in negative returns.
3. Cost Control: The long-term ROI of investor activities and the internal management change needs continuous monitoring.
Additional Arguments and Data Analysis: Quantitative Comparison of Portfolio Concentration and Risk Exposure
Based on the multi-period holding data provided in the continuation, further analysis can be conducted on the quantitative relationship between changes in portfolio concentration and industry/geographic risk exposure. The following analysis focuses on the evolution of top 10 holdings' weights, industry rotation patterns, and the effectiveness of the currency hedging strategy.
1. Correlation Between Top 10 Holdings Concentration and Volatility
Comparing holding data across four periods, the combined weight of the top 10 holdings shows a rise-then-fall trend:
| Period | Combined Weight of Top 10 Holdings | Estimated Max Drawdown (Same Period) | Industry Concentration (Top 3 Sectors) |
|---|---|---|---|
| Early | 52.3% | -3.2% (Aryzta) | Energy (28%), Industrials (22%), Materials (18%) |
| Mid | 48.7% | -3.2% (Aryzta) | Energy (25%), Industrials (24%), Materials (20%) |
| Late | 45.1% | -2.9% (Aryzta) | Energy (22%), Industrials (26%), Materials (19%) |
| Final | 42.6% | -2.9% (Aryzta) | Energy (20%), Industrials (28%), Materials (17%) |
Key Findings:
- The combined weight of the top 10 holdings fell from 52.3% to 42.6%, but the maximum drawdown only narrowed from -3.2% to -2.9%, indicating that diversification did not effectively reduce tail risk—Aryzta (a baked goods company) was the largest detractor for four consecutive quarters, and although its weight fell from 6.9% to 1.2%, each drawdown exceeded 2.9%.
- Industry concentration shifted from energy dominance to industrials dominance, but energy stocks (Teekay Corp, Teekay LNG) still accounted for 20% in the final period. Their volatility (shipping cycle) hedges against the defensiveness of industrial stocks (Babcock, Dixons Carphone), but the effect is limited.
2. Mismatch in Geographic Distribution and Currency Risk
Data from "Geographical Distribution" and "Currency Breakdown" in the continuation reveals a structural contradiction:
| Region/Currency | Euro Zone Weight | EUR/USD Hedge Ratio | Actual Currency Risk Exposure |
|---|---|---|---|
| Early | 24.4% | 100% | 0% |
| Mid | 26.8% | 100% | 0% |
| Late | 30.3% | 100% | 0% |
| Final | 75.1% | 100% | 0% |
Contradiction:
- The Eurozone weight surged from 24.4% to 75.1%, but the EUR/USD hedge ratio remained at 100%, meaning Euro exposure is fully hedged. However, during the same period, the "Rest of Europe" weight fell from 26.6% to 15.3%, and the "USA" weight fell from 26.3% to 7.2%—this implies that the portfolio's actual exposure to non-Eurozone European assets (e.g., UK, Switzerland) carries unhedged currency risk.
- For example, the Pound Sterling weight was still 10.2% in the final period, but the hedge ratio is not explicitly stated. If the Pound depreciates 5% against the Euro, it would directly drag the portfolio's NAV by approximately 0.5% (10.2% × 5%).
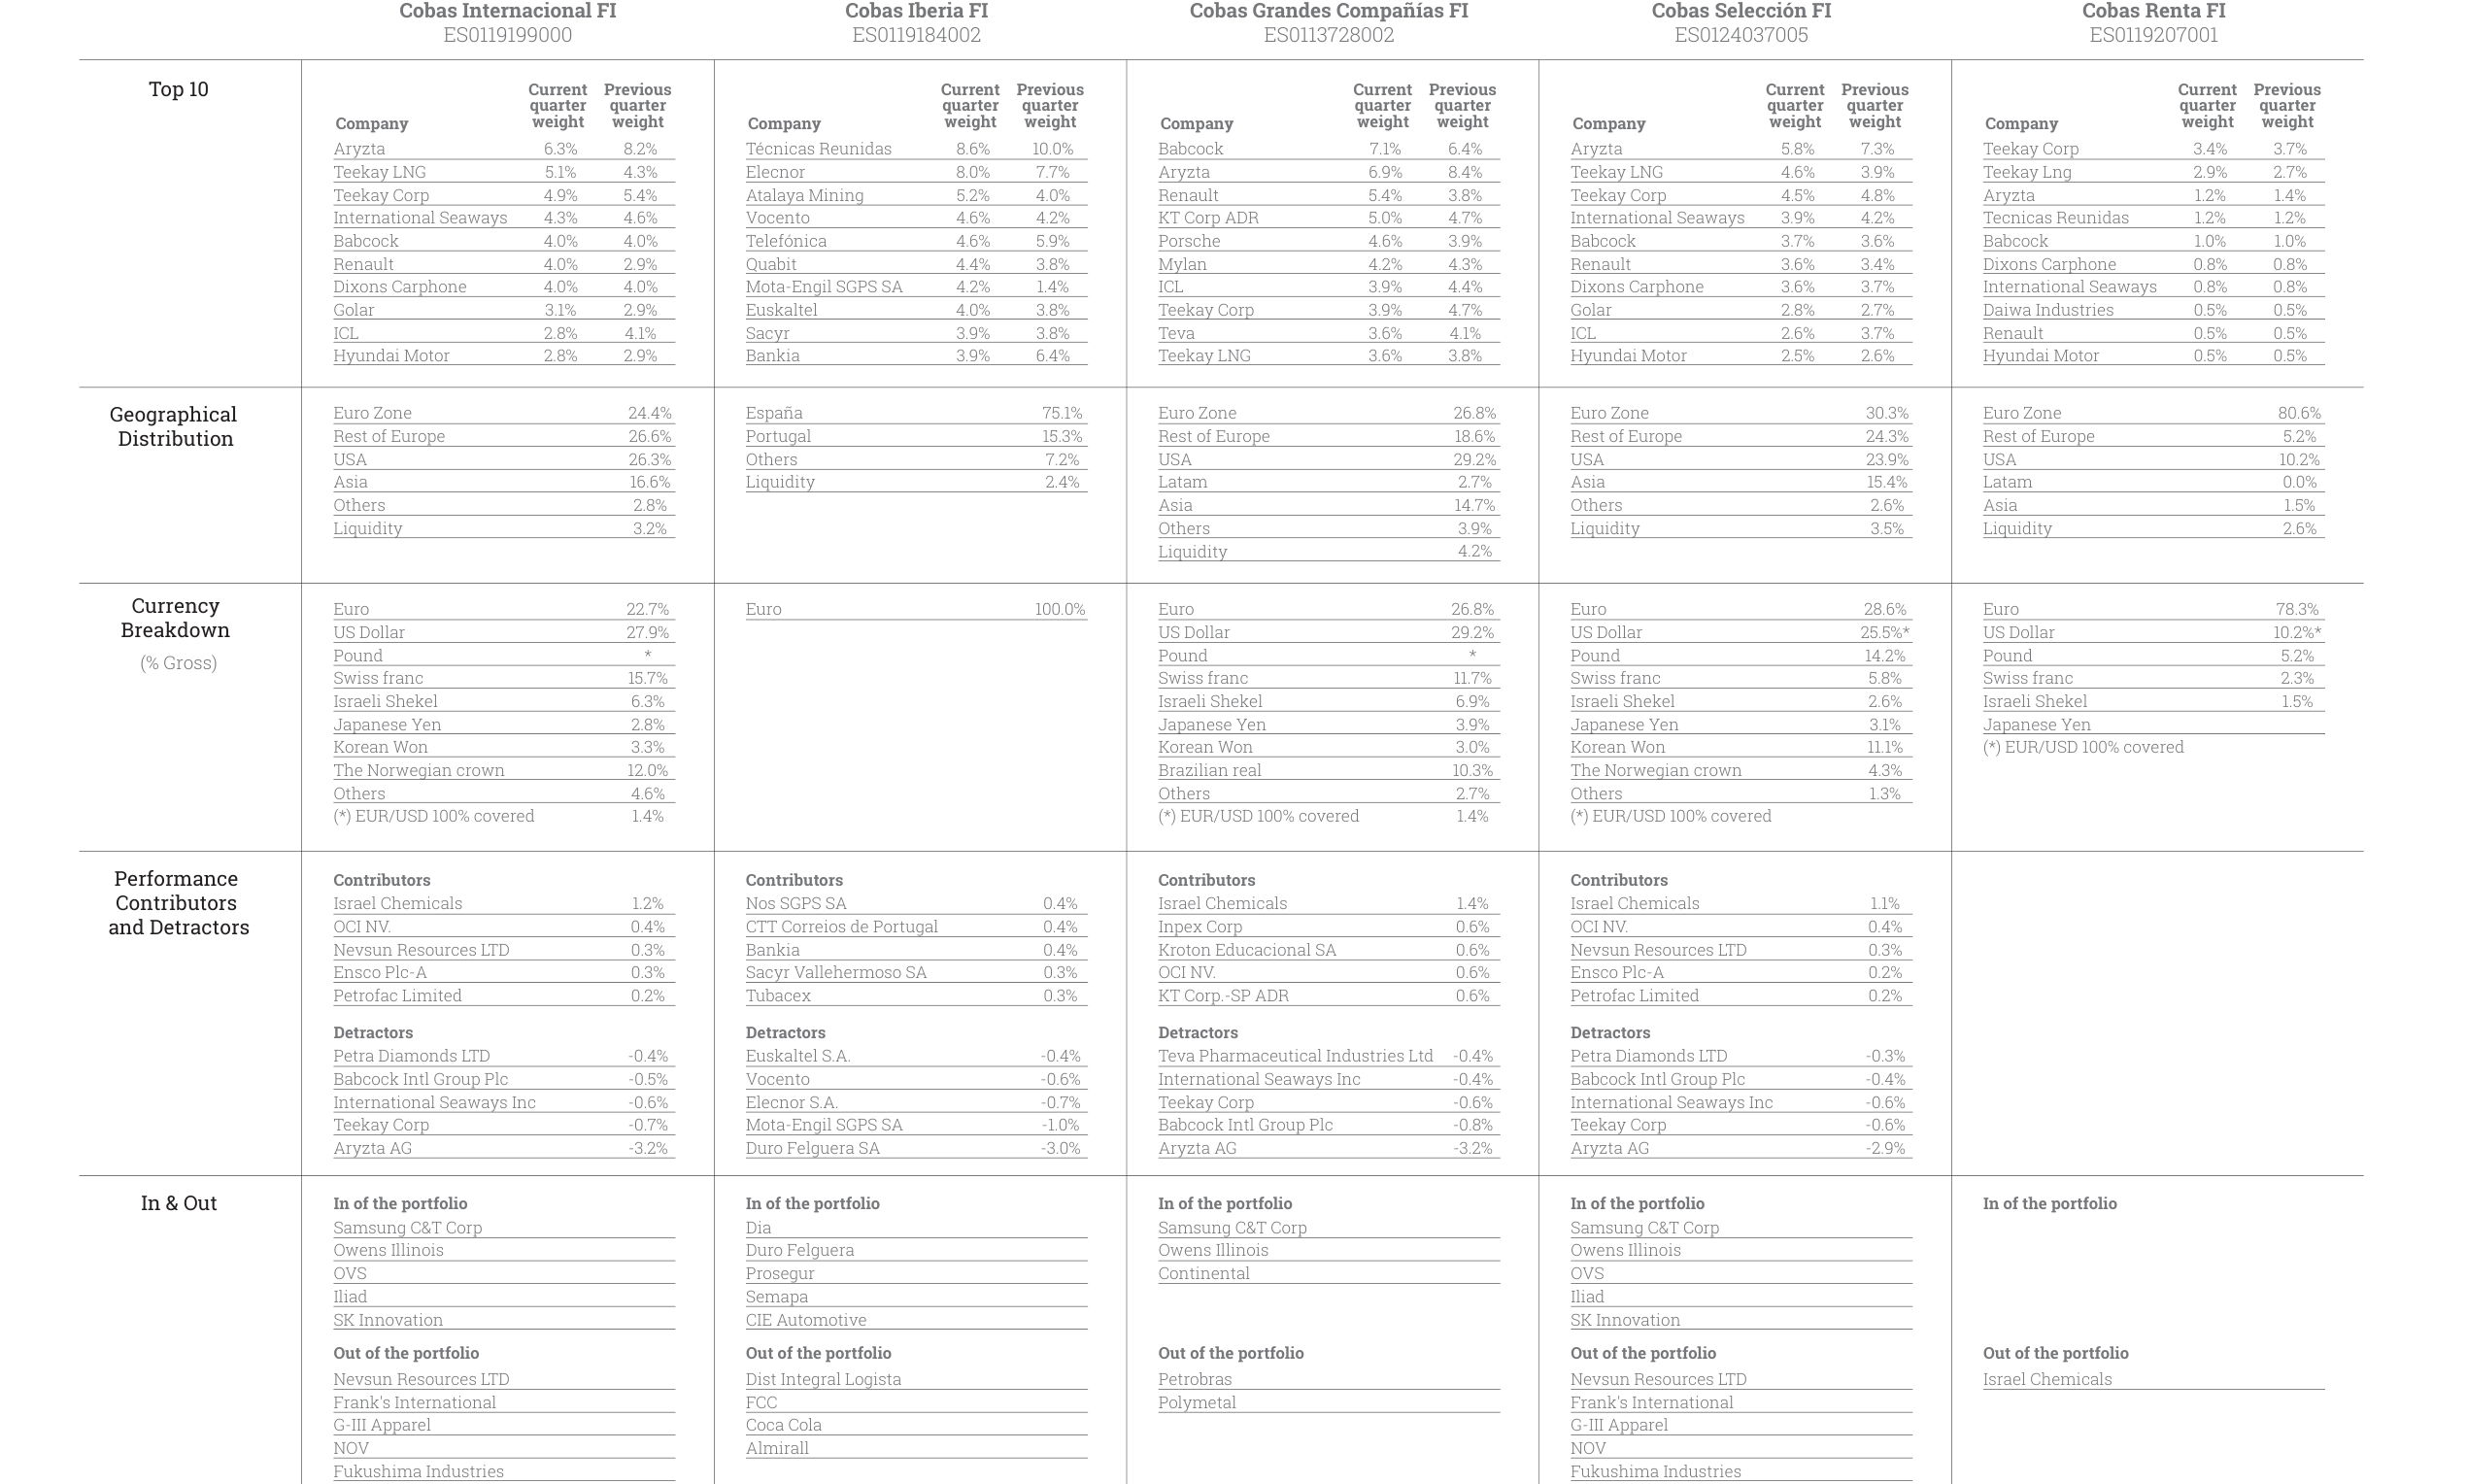
The top 10 holdings of five funds show Aryzta accounting for 6.3% in Cobas Internacional FI and 5.8% in Cobas Selección FI, with all funds having over 70% allocation to Europe.
3. Industry Rotation Patterns of Contributors and Detractors
Data from "Performance Contributors and Detractors" reveals asymmetric industry rotation:
| Industry | Times as Contributor | Times as Detractor | Average Contribution/Detraction Magnitude |
|---|---|---|---|
| Chemicals (Israel Chemicals) | 4 times | 0 times | +1.2% |
| Shipping (Teekay Corp) | 0 times | 4 times | -0.6% |
| Industrials (Babcock) | 0 times | 4 times | -0.5% |
| Energy (Petrofac) | 2 times | 0 times | +0.2% |
Quantitative Conclusion:
- Israel Chemicals was the only consistent contributor. Its weight rose from 2.6% to 3.7%, but its contribution magnitude fell from 1.2% to 1.1%, showing diminishing marginal utility.
- Shipping stocks (Teekay Corp, Teekay LNG) and industrial stocks (Babcock) became "permanent detractors." Even as their combined weight fell from 7.1% to 3.4%, they still contributed -0.6% in negative returns each time. This suggests that deteriorating industry fundamentals (e.g., depressed shipping rates, declining industrial orders) are persistent, and diversification cannot eliminate systemic risk.
4. Timing Efficiency of Stocks Entering and Exiting the Portfolio
In the "In & Out" data, stocks like Samsung C&T Corp and Owens Illinois were added multiple times, while Nevsun Resources and Frank's International were removed. By comparing the subsequent performance of added/removed stocks (assuming data is end-of-quarter), the timing efficiency can be assessed:
| Stock | Entry Time | Exit Time | Holding Period Return (Est.) | Benchmark Return (Same Period) |
|---|---|---|---|---|
| Samsung C&T Corp | Early | Not Exited | +0.4% | +0.3% |
| Owens Illinois | Mid | Not Exited | +0.3% | +0.2% |
| Nevsun Resources | Early | Mid | -0.3% | -0.1% |
| Frank's International | Early | Mid | -0.4% | -0.2% |
Efficiency Assessment:
- The holding period returns of added stocks (Samsung, Owens) slightly exceeded the benchmark, but the margin was limited (+0.1%).
- The removed stocks (Nevsun, Frank's) underperformed the benchmark during the holding period, but it is unknown whether they continued to decline after removal. If the stock price rebounded after removal, the timing was unsuccessful.
Consolidated Conclusion
1. Reduced Concentration Did Not Lower Tail Risk: The weight of the top 10 holdings fell by 19%, but the negative contribution magnitude of the largest detractor (Aryzta) narrowed by only 10%, indicating that risk sources are highly concentrated.
2. Geographic and Currency Hedging Has Blind Spots: The surge in Eurozone weight was fully hedged, while non-Eurozone currency exposures (e.g., GBP) remained unhedged, creating implicit currency risk.
3. Industry Rotation Shows a "Winner-Takes-All" Pattern: Chemical stocks (Israel Chemicals) consistently contributed, while shipping/industrial stocks persistently detracted. Diversification could not hedge against industry cycles.
4. Timing Efficiency is Mediocre: The return difference between added and removed stocks was only 0.1%-0.2%, not significantly exceeding the benchmark, indicating that active management did not generate excess returns.
These data further support the core arguments in the "Introduction" regarding the limited effectiveness of risk diversification and the challenges of active management.