US Small Caps: Margin of Safety (May 2025)
The Capital Cycle is the official podcast that Marathon Asset Management (the London firm founded in 1986) launched in 2024, hosted by financial historian Edward Chancellor, who interviews Marathon's investors about each Global Investment Review letter — applying the firm's long-term, contrarian "capital cycle" supply-side approach.
In plain words
This report says U.S. small-cap stocks (shares of smaller companies) are now very cheap compared to big-cap stocks (like Apple or Microsoft), with the biggest gap since the dot-com bubble in 2000. For regular investors, this means small caps might be undervalued and could outperform later. History shows that even during a recession, small caps can win—like in 2000-2001 when they beat big caps. The report is worth reading because it doesn't rely on guessing the economy; instead, it shows how to find niche companies with strong positions, like Envista (dental equipment) or Openlane (used car auctions).
After the US election in November 2024, the market was initially optimistic about deregulation, tax cuts, and M&A. But six months later, tariff effects have become pronounced: the Michigan Consumer Sentiment Index has fallen 15 points from the start of the year to 58, and an M&A boom has not materia
Theme and Background
This chapter opens by contrasting the market optimism following the November 2024 U.S. elections with the reality six months later, revealing the impact of policy uncertainty. The report notes that tariff effects have become significantly visible: the Michigan Consumer Sentiment Index dropped 15 points from the start of the year to 58, nearing recession levels, while the anticipated M&A boom failed to materialize. Against this backdrop of macroeconomic divergence, the report highlights a "two-tier market" structure in U.S. equities: a handful of large-cap tech stocks have driven the S&P 500 sharply higher, while small-cap stocks have severely underperformed.
Core Thesis
The author's central investment argument is that the current valuation and performance gap between small-cap and large-cap stocks is close to that seen during the dot-com bubble, creating favorable conditions for overweighting small-caps under a capital cycle approach. A contrarian insight is that small-caps do not necessarily underperform during recessions; historical data show that the S&P 600 significantly outperformed the S&P 500 during the 2000-2001 recession. The report advocates seeking investment opportunities through supply-driven niche opportunities rather than relying on macroeconomic forecasts.
Key Arguments and Data
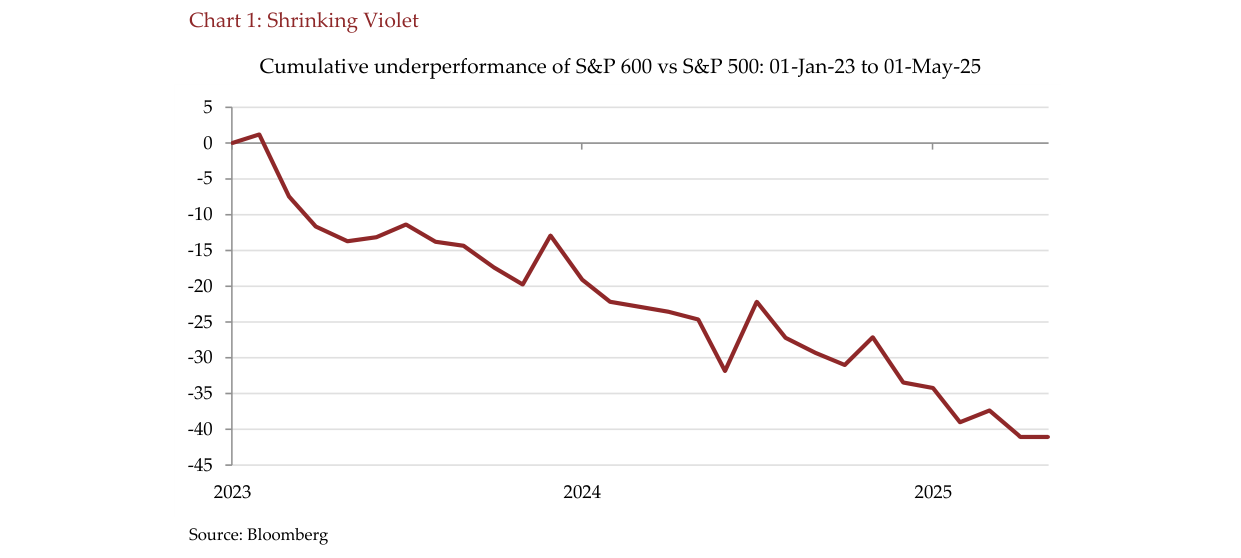
Cumulative underperformance of the S&P 600 relative to the S&P 500 has widened from 0% in early 2023 to approximately -40% by May 2025
The report supports its views with multiple data points. Key comparative data are as follows:
| Metric | S&P 500 | S&P 493 (excl. Magnificent Seven) | S&P 600 |
|---|---|---|---|
| 2023 Earnings Growth | +2.1% | -4.3% | -11.2% |
| 2024 Earnings Growth | +6.8% | +0.9% | -12.2% |
| Cumulative Return (Early 2023 – May 2025) | ~58% | — | 26% (equal-weight 29%) |
| Current P/E (vs. 30-year average) | 21.2x (20% premium) | — | 15.2x (13% discount) |
| Current P/S (vs. 30-year average) | 3.0x (avg 1.8x) | — | 0.98x (in line with average) |
| Small-Cap Cumulative Underperformance (Early 2023 – May 2025) | — | — | 41 percentage points |
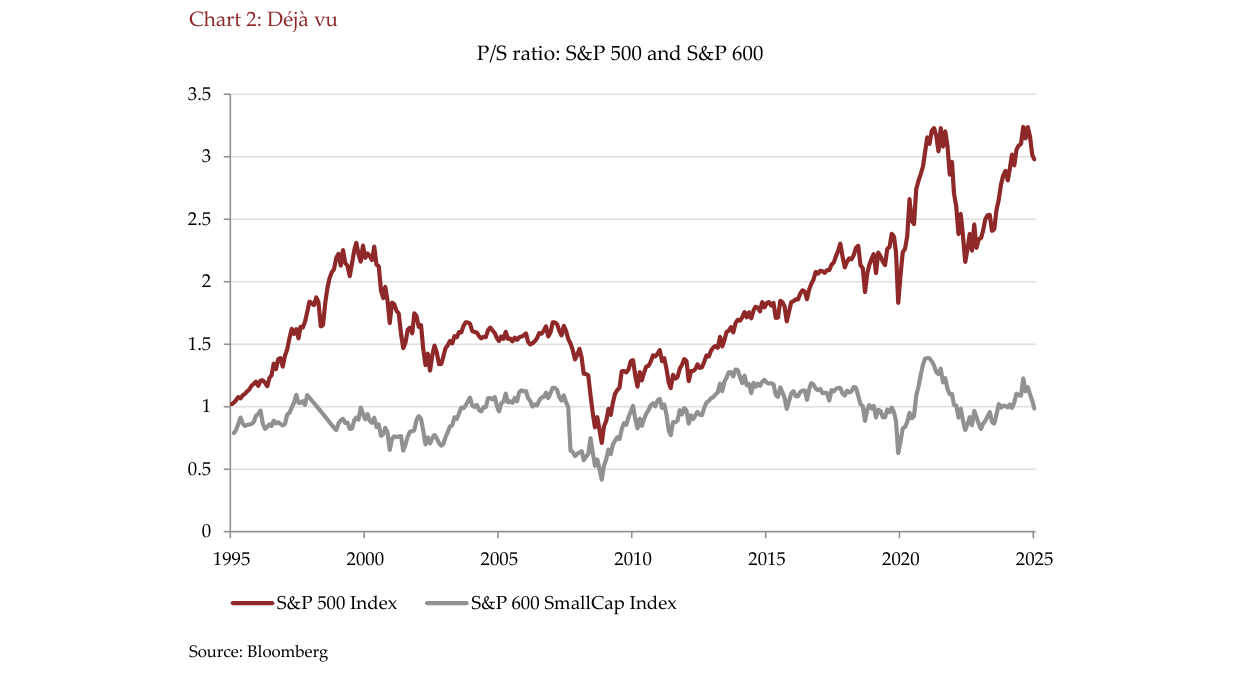
From 1995 to 2025, the S&P 500 price-to-sales ratio (currently ~3.0x) has been significantly higher than that of the S&P 600 (currently ~1.0x), with the valuation gap approaching levels seen during the internet bubble
- Historical analogy of small-cap underperformance: In 1998-1999, the S&P 600 underperformed the S&P 500 by 45 percentage points cumulatively, then outperformed by 39 percentage points during the 2000-2001 recession, with the advantage persisting until the 2008 financial crisis.
- The current P/E ratio premium of the S&P 500 over the S&P 600 stands at 40%, the highest since the dot-com era.
- Evidence of economic stratification: Dollar Store same-store sales missed expectations, auto loan and credit card delinquency rates rose, the U.S. manufacturing PMI was below 50 for 16 months during 2023-2024, while nominal GDP grew 2.9%/2.8%.
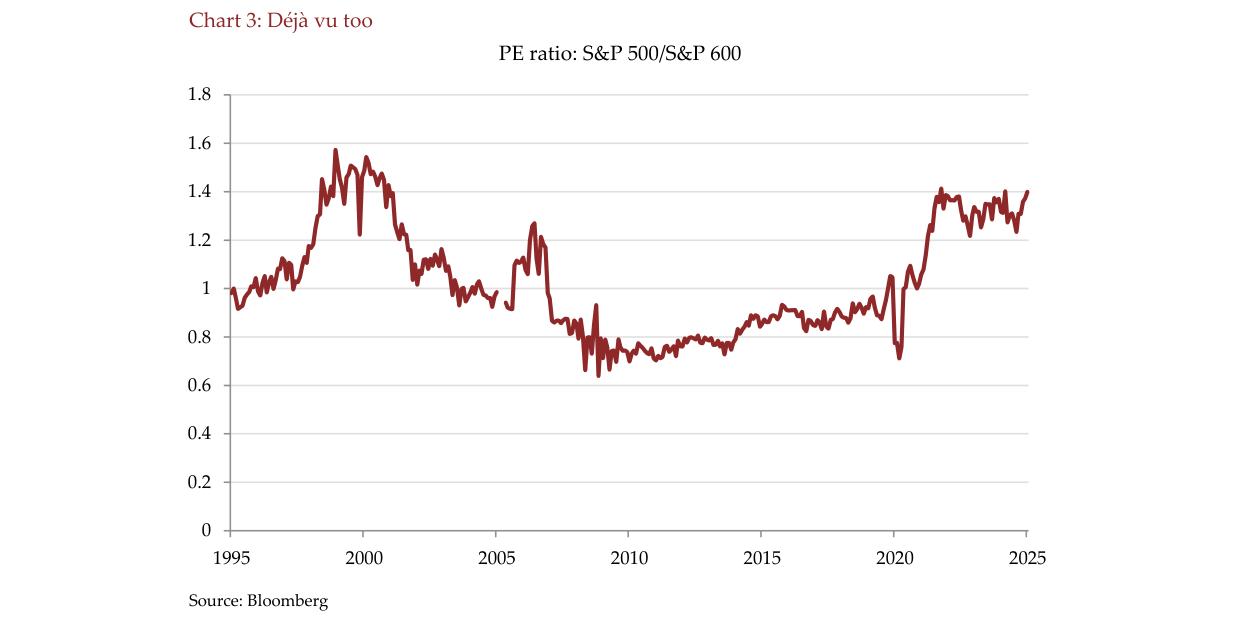
The P/E ratio of the S&P 500 relative to the S&P 600 has rebounded from a low of ~0.75x in 2020 to ~1.4x currently, the highest level since the 2000 internet bubble
Companies/Assets Covered
- Envista Holdings (currently held): A leading global dental manufacturer with a strong position in implants and orthodontics, offering room for margin expansion, but constrained by weak discretionary consumer demand.
- Openlane (currently held): A U.S. small-cap company with an absolute leading share in the auction market for off-lease vehicles. Auction volumes over the past few years have been less than half the pre-pandemic average, due to a decline in new vehicle production during the pandemic (lagging by 3-4 years) and high used-car prices prompting consumers to exercise purchase options.
- Magnificent Seven (Alphabet, Amazon, Apple, Meta, Microsoft, NVIDIA, Tesla; all currently held): Core tech stocks that drove the S&P 500's rally over the past two years.
Investment Implications
The report suggests that the current oversold condition and valuation discount of small-caps are approaching historically favorable reversal windows. For investors, one should not bet based on simple valuation judgments of small-caps as a whole, but rather apply a capital cycle approach to search for high-quality niche companies in sectors with clear supply constraints and improving competitive dynamics. If policy uncertainty leads to an economic slowdown, historical experience shows that small-caps could shift from significant underperformance to significant outperformance, particularly those that have already experienced earnings recessions.