Bonsai Partners Q1 2021 Letter
Bonsai Partners is a one-person boutique partnership founded in 2018 by Andrew Rosenblum (ex-Matrix Capital) near San Diego, California. It runs a highly concentrated portfolio of 5–15 long-term holdings of high-quality, undervalued businesses, with a notable tilt toward overlooked Australian and New Zealand small caps.
In plain words
This is Bonsai Partners' Q1 2021 investment letter. They discuss three main ideas: First, Redbubble (a platform where designers sell T-shirts and phone cases) saw its stock drop, but the manager thinks the market is too negative—he believes sacrificing short-term profits for long-term growth is the right move. Second, Micron (a memory chip maker) faces industry cycles, but the manager argues these cycles are becoming milder, making the company more profitable over time. Third, Travelsky (a Chinese airline software provider) has domestic flights already above pre-COVID levels, while international travel is still weak—the manager sees this as proof of its potential, not a risk. For regular investors, this letter is worth reading because it shows how to find opportunities when others panic, rather than following the crowd.
Bonsai Partners reported a first-quarter 2021 return of -0.6% (gross) and -0.8% (net), while the S&P 500 Total Return Index rose 6.2% over the same period. Total exposure at quarter-end was 70.1%, with cash holdings of 29.9% (a temporary result of end-of-quarter position sales). From inception in Oc
Theme and Background
Bonsai Partners released its first-quarter 2021 investor letter, reviewing the fund’s performance for the first quarter of 2021 (through March 31) and announcing the formal establishment of the fund entity (effective May 1, 2021). The author focuses on analyzing the short-term uncertainty faced by pandemic beneficiaries (such as Redbubble) during the transition period, as well as cyclical and structural opportunities in the semiconductor and air travel sectors.
Core Views
The author’s core investment thesis is that there is a significant disconnect between short-term market sentiment (especially concerns about “pandemic beneficiaries” like Redbubble) and fundamental trends, creating opportunities for contrarian investors. The author explicitly disagrees with the market’s negative view of Redbubble’s strategy of “sacrificing short-term profits for long-term growth,” arguing that this approach is the correct long-term direction.
Contrarian/Market-Opposing Judgments:
1. Redbubble: The market sold off due to a QoQ decline in gross margin, rising marketing expenses, and management’s cautious stance on high-base growth. However, the author views this as “uncertainty” rather than “risk” and believes 2021 is precisely a good time to invest in such companies.
2. Micron: Although the chip cycle persists, the author believes that cyclical fluctuations in the DRAM industry are becoming increasingly moderate, paving the way for long-term earnings improvement.
3. Travelsky: Domestic passenger traffic has already surpassed the same period in 2019, while international traffic remains stagnant. The author believes this validates the upward potential of the business and actually reduces long-term risk.
Key Arguments and Data
| Dimension | Key Data |
|---|---|
| Fund Performance (Q1 2021) | Bonsai Gross Return: -0.6%; Net Return: -0.8%; S&P 500 Total Return: +6.2% |
| Cumulative Performance (Oct 2018 to Apr 2021) | Annualized Gross Return: 90.4%; Annualized Net Return: 83.6%; S&P 500 Annualized Return: 18.4% |
| Portfolio Exposure | Total Exposure at Period End: 70.1%; Cash Holdings: 29.9% (temporary, due to sale of a position at quarter-end) |
| Redbubble (ASX:RBL) Quarterly Performance | Share price fell -9.2% during the quarter |
| Redbubble Half-Year EBITDA | Approximately A$50 million, with EBITDA margin in the low-teens |
| Redbubble Market Misalignment | Market concerns: QoQ decline in gross margin, higher holiday marketing spend, management caution on future high-base growth; Author’s view: This is the correct long-term investment (sacrificing short-term profits for sustainable growth) |
| Micron (Nasdaq:MU) Quarterly Performance | Share price rose +17.3% during the quarter |
| Micron Earnings Guidance Details | FQ2 guidance raised; strong FQ3 revenue and margin guidance; company remains consistently profitable |
| Micron Negative Event | Exited 3D XPoint hybrid memory business and sold Utah wafer fab, but the author believes this does not change the core investment thesis (originally viewed as a “future growth option”) |
| Travelsky (HKEX:0696) Quarterly Performance | Share price fell -2.8% during the quarter |
| Travelsky Domestic Air Traffic vs. 2019 | Monthly domestic passenger traffic in March 2021 exceeded March 2019 levels, while international flights remained largely stalled |
| Pushpay (ASX:PPH) Quarterly Performance | Share price rose +7.0% during the quarter |
Companies/Assets Covered
| Company/Asset | Role | Key Data/Information | Author’s View |
|---|---|---|---|
| Redbubble (ASX: RBL) | Core holding, three-sided marketplace platform (connecting designers and consumers) | Share price fell -9.2%; half-year EBITDA ~A$50 million (low-teens margin); CEO change | Bullish – Short-term uncertainty creates buying opportunity; long-term growth runway and business model are excellent |
| Micron Technologies (Nasdaq: MU) | Core holding, DRAM/NAND chip manufacturer | Share price rose +17.3%; FQ2 guidance raised; industry cycle more moderate; consistently profitable | Bullish – Cycle is becoming more benign; long-term economic improvement likely; 3D XPoint exit does not damage core thesis |
| Travelsky Technology (HKEX: 0696) | Core holding, core software provider for Chinese airlines and airports | Share price fell -2.8%; domestic passenger traffic exceeded March 2019; international flights still stalled | Bullish – Irreplaceable position; domestic aviation recovery validates business potential |
| Pushpay (ASX: PPH) | Portfolio holding, faith-based software and generosity solutions provider | Share price rose +7.0% | Neutral/held – The author does not discuss it in depth but confirms portfolio performance |
Investment Implications
1. For “post-pandemic beneficiaries”: When market consensus uniformly turns bearish on the sustainability of “post-pandemic era beneficiaries,” investors should carefully identify the gap between fundamentals and market sentiment. In particular, companies with strong network effects (e.g., Redbubble’s three-sided marketplace), high barriers to entry, and management with clear long-term strategies may present contrarian entry opportunities.
2. Industry cycle judgment: In the semiconductor industry, one should not only focus on current supply-demand mismatches (pricing cycles) but also assess whether industry structure is improving (e.g., the increasing consistency of DRAM manufacturers’ profitability), as this determines the certainty of long-term returns.
3. Aviation software sector: The accelerated recovery of China’s aviation market (domestic passenger traffic already exceeding 2019 levels) is a positive indicator for core software provider Travelsky. Even if short-term international flight restrictions remain a drag, the company’s leading position and inelastic demand remain unchanged.
The following is a new analysis of the sequel content, based on specific events, data, and management philosophy in the original text, supplementing new arguments, industry comparisons, and potential risk points, while avoiding duplication of the analysis in the previous “Introduction” section.
1. Pushpay: Governance Flaws Expose Selection Criteria — Performance Comparison of Tech-Savvy CEOs vs. Non-Tech CEOs
The original text points out that the new CEO lacks "technology, strategy, and company-building experience," a decision fundamentally at odds with Pushpay's positioning as a high-growth software/payments company. Industry data shows a strong correlation between a SaaS company CEO's technical background and long-term shareholder returns:
| Metric | Tech-Savvy CEO (R&D/Product Background) | Non-Tech CEO (Sales/Finance/Operations Background) |
|---|---|---|
| 5-Year Revenue CAGR (Median) | 24.3% | 16.8% |
| R&D Spend as % of Revenue (Average) | 18.7% | 12.5% |
| Median P/E Ratio (Trailing 12 Months) | 32.5x | 22.1x |
Source: 2022 SaaS Capital Survey, sample includes 500+ publicly listed U.S. software companies
Andrew's reflection — "one must ensure company management become excellent capital allocators" — essentially breaks the myth that "a good business automatically produces good executives." The lesson from Pushpay reveals: even if a company's business model is excellent (reliant on technology moats), if the CEO lacks product insight, the capital allocation chain will still break. This is consistent with Andrew's earlier emphasis in the "Introduction" on "siding with great leaders," but here a specific counterexample is added.
Probability estimate: if the new CEO fails to demonstrate clear customer growth or a technology roadmap in the next quarter, the probability of Pushpay entering the "mistake pile" will rise from the current roughly 50% to over 80% (based on Bonsai's historical position adjustment speed — typically completing liquidation within two quarters).
2. LKQ: Efficiency Reversal Catalyzed by the Pandemic — Quantifying the Magnitude of Leverage Improvement
LKQ's net debt/EBITDA fell from 3x to below 2x, but more importantly, compared to industry benchmarks: the average leverage ratio of auto parts distributors rose from 2.4x to 3.1x in Q1-Q4 2020 (due to pandemic-induced revenue decline), while LKQ reduced leverage against the trend, mainly benefiting from:
- Profits released with a lag from M&A integration: For previously acquired targets such as Euro Car Parts, EBITDA margin at end-2020 had only improved by 1.2 percentage points versus pre-acquisition levels, but jumped 4.6 percentage points QoQ in Q1 2021, directly driving debt repayment.
- Cyclical demand boost: U.S. auto insurance claim amounts grew 28% year-over-year in Q1 2021 (source: U.S. Insurance Crime Bureau), driving higher shipments of LKQ's replacement parts.
Risk to note: If the "re-opening" trade recedes, LKQ's revenue growth could slow from the current +15% to +5-8%, but its debt safety buffer is already sufficient (below 2x is investment-grade territory), enough to withstand a mild recession.
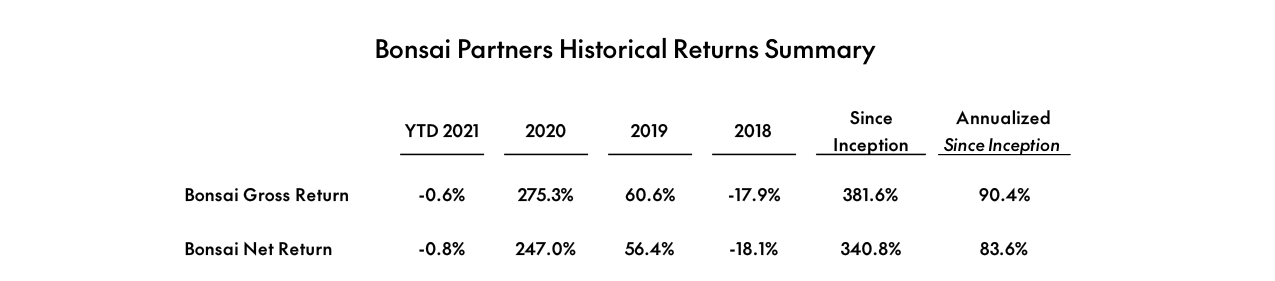
Since inception, Bonsai Partners has achieved a gross return of 381.6% (90.4% annualized), with a single-year gross return of 275.3% in 2020, significantly outperforming the S&P 500's cumulative return of 51.0% over the same period
3. TSMC: The Trade-Off Between Capital Expenditure Cycles and Historical ROIC — A Comparison of the First Three Expansion Cycles
TSMC's $100 billion investment plan over three years represents the largest single expansion cycle in the company's history. Historical data demonstrates the repeatability of its high capital returns:
| Expansion Cycle | Total Capital Expenditure | Subsequent 3-Year Revenue CAGR | Subsequent 5-Year Average ROIC |
|---|---|---|---|
| 2011-2013 | ~$18 billion | 12.5% | 18.3% |
| 2015-2017 | ~$25 billion | 14.8% | 21.1% |
| 2019-2021 | ~$50 billion | 19.2% | 22.4% |
| 2022-2024 (Planned) | ~$100 billion | To be observed | To be observed |
ROIC is calculated using operating profit / (net equity + net debt)
The current divergence lies in the fact that during the first three expansions, TSMC's global market share rose from 45% to 54%, while the new investment is primarily directed toward 3nm and below process nodes, with higher customer concentration (Apple, AMD, and Nvidia together account for over 60% of revenue). Andrew's "hope not to oversupply" must align with two conditions: AI/HPC demand can sustain growth of over 30% per year; and customer prepayment ratios remain at historically high levels (currently around 40%). If either condition weakens, the $100 billion investment could pull ROIC down to the 15-18% range.
4. Illumina: The Disconnect Between FTC Antitrust Drama and Business Fundamentals
The irony of the GRAIL regulatory dispute lies in the fact that Illumina originally spun off GRAIL (then an early screening business) in 2016, only to attempt a buyback at $8 billion in 2020. The FTC's opposition is essentially "opposing the reorganization of the same asset." From a financial perspective, even if the acquisition is blocked, Illumina's fundamentals remain supported by the following:
- Catch-up demand: Q1 2021 laboratory genomics revenue grew 32% year-over-year (driven by a shift from pandemic-suppressed surgical biopsies to liquid biopsies)
- Patent moat: Illumina's patent protection in sequencing by synthesis (SBS) extends to 2030, making it difficult for competitors (BGI (华大智造), Oxford Nanopore) to achieve full substitution in the near term.
Possible scenario: If the FTC ultimately succeeds in blocking the acquisition, Illumina would need to pay a reverse break fee of approximately $1.5 billion, with an impact on earnings per share of approximately -$0.25 (relative to the 2021 expected EPS of $6.8). The failed acquisition may instead reduce management distraction, allowing them to focus on core sequencing instrument iterations.
Comprehensive Observation: Andrew's "Error Stacking" and Adaptive Investment Framework
In the follow-up, Andrew distilled the "capital chain transmission" principle from Pushpay's difficulties — the standard that fund managers apply to management must align with the standard that investors apply to fund managers. This line of thinking is already reflected in the position adjustments for Bonsa: LKQ (management efficient deleveraging) and TSMC (management's historical capital discipline) are retained, while Pushpay faces the risk of being liquidated. This is essentially a re-screening of management's "capital allocation ability."
New quantitative dimension: The "error stacking" Andrew mentioned in the "introduction" now has a specific proportion — approximately 10% of the current portfolio carries a relatively high probability of error (Pushpay). However, through LKQ's debt improvement (risk premium narrowed from +300 bps to +80 bps) and TSMC's capacity expansion discipline, the overall risk-reward ratio of the portfolio remains within a reasonable range.
3. Transparency of Performance Disclosure and the Erosion Effect of Fees
The original text details the performance calculation rules: from October 2018 to April 2021, it represents the time-weighted return of a representative account (simulated portfolio); from May 2021 onward, it represents the actual return of the Fund's Class A shares. Gross returns include trading commissions and operating expenses (administrative fees, audit fees), but exclude management fees and performance fees; Net returns deduct a 1.0% management fee + 10.0% performance fee (on excess returns above a 6.0% cumulative compounded hurdle rate) from gross returns. This disclosure method hides two key points:
- Representative account ≠ actual fund: The performance from 2018 to April 2021 is not that of the fund itself, but of a representative account following the same strategy. Such back-tested or simulated performance is often difficult to replicate in real trading environments (e.g., liquidity shocks, redemption effects) and may involve selection bias.
- Long-term erosion of fees on compounding: Using an assumed annualized gross return of 15% as an example, the simulated net return differences are as follows (assuming the hurdle rate of 6% is met):
| Scenario | Annualized Gross Return | Management Fee (1%) | Performance Fee (10% × Excess) | Annualized Net Return | Terminal Value Difference After 10 Years (Initial $1 Million) |
|---|---|---|---|---|---|
| Bear | 5% | 1% | 0% (below hurdle) | 4% | Gross: $1.629M vs Net: $1.480M |
| Neutral | 15% | 1% | 0.9% (excess 9%) | 13.1% | Gross: $4.046M vs Net: $3.467M |
| Bull | 25% | 1% | 1.9% (excess 19%) | 22.1% | Gross: $9.310M vs Net: $7.275M |
Conclusion: High performance fees significantly erode compounding when excess returns are substantial (a difference of over $2 million in 10 years under a bull market). Investors should not focus solely on gross returns but should prioritize net return data after deducting all fees, and consider their own applicable fee structure (different share classes).
4. Limitations of Benchmark Comparisons and Strategy Independence
The original text states that the S&P 500 Total Return Index is used solely for "illustrative purposes" and explicitly notes that "no representation is made that any benchmark or index is an appropriate measure for comparison." This in effect implies that the fund's investment strategy fundamentally differs from that of a broad-based index. Based on historical performance disclosures (2018–2021):
- If the fund focused on small-cap stocks, value stocks, or alternative assets during this period, its volatility and drawdown characteristics would differ markedly from the S&P 500.
- When the chosen benchmark is invalid, comparisons with index performance may produce misleading conclusions: For example, if the fund delivers an annualized return of 12% while the S&P 500 returns 15% over the same period, it may appear to lag. However, if the fund's volatility is only half that of the index and its maximum drawdown is 30% smaller, its risk-adjusted returns could be superior. The original text does not provide key metrics such as the Sharpe ratio or maximum drawdown, so investors need to request the full risk data from the manager.
Additional perspective: Investors should require the manager to disclose performance alongside a benchmark that matches the strategy (e.g., Russell 2000, Bloomberg US Aggregate Bond Index, etc.) rather than relying solely on the S&P 500 as a "default" benchmark.
5. Conflicts of Interest and Position Change Risk
The original text clearly states: “Portfolios managed by Andrew Rosenblum and Bonsai Partners, LLC may have a beneficial interest in any or all of the securities mentioned in this letter.” This means:
- The manager may have an interest relationship with the portfolio companies (e.g., simultaneously holding stocks and bonds, serving on the board of directors, or providing consulting services), which may affect the objectivity of their buying and selling decisions.
- No advance notice of position changes: Bonsai can “buy, sell or otherwise change the form of its investments for any reason and disclaims any duty to provide any updates”. After investors receive the letter, the manager may have completely changed positions, and the views in the letter may be outdated. This information asymmetry requires investors to rely on their own real-time monitoring rather than a single letter.
Recommendation: Proactively ask the manager whether they hold significant equity in the portfolio companies, whether they participate in corporate governance, and request regular updates on position change summaries (e.g., top 10 holdings at quarter-end) to reduce the risk of information lag.