Baillie Gifford Bond Funds ICVC Interim Report - March 2026
In plain words
This semi-annual report covers Baillie Gifford's high-yield bond fund, which invests in riskier corporate bonds paying higher interest. The manager sees Middle East tensions pushing up energy and food costs, possibly reigniting inflation. Instead of guessing macro moves, he stays focused on picking individual bonds. He sold bonds of companies likely to be hurt by AI, like TeamSystem, and bought higher-yielding bank bonds from Rabobank and Nationwide. The fund's six-month return roughly matched its benchmark. A bond from German window-frame maker Ht Troplast rebounded after being too pessimistic. Note that fees are deducted from capital, making capital growth look slower.
The Baillie Gifford Bond Funds ICVC March 2026 report summary outlines the governance and valuation arrangements of this UK umbrella open-ended investment company (OEIC). The report notes that the ACD (Baillie Gifford & Co Limited) is required under FCA rules to assess sub-funds annually against sev
Fund Matters
This section covers the report's front matter and corporate governance information; it has not yet entered into specific holding commentary for the High Yield Bond Fund. The core changes are the deletion of Target Return from the investment grade bond fund, and the Emerging Markets Bond Fund's liquidation and its zero-valued Ukrainian assets.
- Under COLL 6.6.20R, the ACD (Baillie Gifford & Co Limited) must conduct an annual value assessment of each UK authorised sub-fund, considering seven criteria: quality of service, performance, ACD costs, economies of scale, comparable market rates, comparable services and share classes. The assessment reference date is 31 March, and conclusions are published before 31 July each year; the latest assessment as of 31 March 2025 has been published on the official website.
- As of 31 March 2026, the company offers three sub-funds, valued daily at a single price, with no cross-shareholdings among sub-funds.
- With effect from 2 February 2026, Baillie Gifford Investment Grade Bond Fund has deleted Target Return from its investment objective.
- Baillie Gifford Emerging Markets Bond Fund was closed on 22 April 2024, and the ACD no longer actively seeks subscriptions. The fund holds Ukrainian cash affected by the Russia-Ukraine conflict; because recoverability is uncertain, it was valued at zero fair value in termination income calculations and continues to be valued at zero. If any value is realised in the future, it will be paid separately.
- Subsequent periods (September 2025, March 2026) show n/a for NAV and share data, reflecting that the fund has ceased operations. Historical data available around the closure is as follows:
| Indicator | 31.03.26 | 30.09.25 | 30.09.24 | 30.09.23 |
|---|---|---|---|---|
| Total net assets (£'000) | - | - | - | 365,906 |
| SRRI | n/a | n/a | n/a | 4 |
| A Income NAV per share (p) | n/a | n/a | n/a | 68.27 |
| B Accumulation NAV per share (p) | n/a | n/a | n/a | 133.78 |
| B Income NAV per share (p) | n/a | n/a | n/a | 70.51 |
| C Accumulation NAV per share (p) | n/a | n/a | n/a | 199.05 |
| A Income shares | n/a | n/a | n/a | 201,496 |
| B Accumulation shares | n/a | n/a | n/a | 2,391,042 |
| B Income shares | n/a | n/a | n/a | 15,879,193 |
| C Accumulation shares | n/a | n/a | n/a | 176,529,153 |
| A Income income per share (p) | n/a | n/a | 2.66 | 5.33 |
| B Accumulation income per share (p) | n/a | n/a | 5.26 | 9.85 |
| B Income income per share (p) | n/a | n/a | 2.76 | 5.48 |
| C Accumulation income per share (p) | n/a | n/a | 7.84 | 14.62 |
| A Income high price (p) | n/a | n/a | 71.14 | 73.35 |
| A Income low price (p) | n/a | n/a | 64.63 | 67.77 |
| B Accumulation high price (p) | n/a | n/a | 139.6 | 136.9 |
| B Accumulation low price (p) | n/a | n/a | 130.6 | 122.4 |
| B Income high price (p) | n/a | n/a | 73.59 | 75.39 |
| B Income low price (p) | n/a | n/a | 66.86 | 69.53 |
| C Accumulation high price (p) | n/a | n/a | 208.0 | 203.6 |
| C Accumulation low price (p) | n/a | n/a | 194.3 | 181.4 |
| A Income ongoing charge | n/a | n/a | n/a | 1.19% |
| B Accumulation ongoing charge | n/a | n/a | n/a | 0.523% |
| B Income ongoing charge | n/a | n/a | n/a | 0.533% |
| C Accumulation ongoing charge | n/a | n/a | n/a | 0.10% |
Note: The income and price data for 30.09.24 are records still disclosed during the liquidation distribution period after the fund closed (22 April 2024).
Key Data Comparison: High Yield Bond Fund vs Benchmark
This interim report discloses performance data as of 31 March 2026, echoing the earlier three-year data, but the interim performance is clearly weaker than the long-term trend:
| Indicator | Six months (to 31/03/2026) | Three-year annualised (to 31/03/2026) |
|---|---|---|
| Fund total return (B Income Shares) | 0.3% | 9.3% |
| Benchmark (IA Sterling High Yield sector average) | 0.4% | 7.9% |
| Capital return (excluding income) | -3.6% | 3.6% |
| Declared income (pence per share) | 3.71 | 24.52 |
Notably, the performance comparison shows a "scissors" pattern: short-term total return lagged the benchmark by 0.1 percentage point, but capital return was negative (-3.6%), and the interim income distribution (3.71p) was insufficient to offset capital erosion. Over three years, the fund outperformed the benchmark by 1.4 percentage points thanks to its income advantage, but capital appreciation was only 3.6%, indicating that the fund's returns are highly dependent on coupon income rather than price movements.
Market Environment: Macro Narrative Shift and Geopolitical Shock
The report reveals a dramatic shift in macro logic:
- 2025 Q4: The market's core focus was the tug-of-war between "growth slowdown vs inflation stickiness." The UK Budget and the longest US government shutdown in history did not trigger panic; investors seemed to default to the view that rates would steadily decline as inflation fell.
- 2026 Q1: The Middle East conflict became a turning point. Surging energy prices and supply chain disruptions pushed up essential costs—fertiliser price rises are set to feed through to food prices, and the price of helium used in semiconductor manufacturing doubled. This "second-round inflation" pressure forced the market to reprice: short-term gilt yields jumped by nearly 1 percentage point, and the UK and European markets began pricing in the possibility of rate hikes in 2026 (having previously expected cuts).
- High-yield spreads: Credit spreads widened, but relatively moderately. The report notes that any positive signal triggered fresh buying, indicating that the market's appetite for yield-bearing assets remains strong, which to some extent provided support for high-yield bond prices.
Re-examining Risk Factors
This report, in its "Investment Policy" section, specifically lists a series of risks not previously detailed, which deserve attention:
- Derivatives leverage risk: It explicitly warns that "if the underlying assets perform worse than the manager expects, derivatives may amplify losses." The fund is permitted to use foreign exchange forwards and derivatives for investment and risk management purposes, which adds uncertainty in currency hedging and credit risk exposure.
- Liquidity risk: It acknowledges that "under adverse market conditions, the fund's investments may be difficult to sell in a timely manner, and prices may fall significantly," potentially even leading to a suspension of redemptions.
- Custodian risk: If the custodian holding assets becomes insolvent or breaches its duty of care, investors may suffer losses.
- Global systemic risk: Natural disasters, pandemics, military conflicts, or changes in government policy may all result in investment losses.
These risk descriptions are not procedural templates but are highly relevant to the current geopolitical environment—especially the inflationary shock triggered by the Middle East conflict, which is precisely a real-world case of the "military conflict" risk category.
Noteworthy Anomaly: Liquidation Status of the Emerging Markets Bond Fund
In this report, the financial statements of the Baillie Gifford Emerging Markets Bond Fund show extreme conditions:
- Total net assets of zero; the balance sheet contains only debtor and creditor items offsetting each other (£6 thousand and £10 thousand respectively).
- The basis of preparation note explicitly states that the sub-fund "is no longer considered a going concern," and the ACD (Authorised Corporate Director) plans to terminate the sub-fund.
- The impact on the financial statements is zero, because assets and liabilities are measured at fair value, which is basically consistent with the residual value.
This phenomenon reveals an important fact: not all funds survive. The Emerging Markets Bond Fund may have terminated due to shrinking scale, failed strategy, or shareholder redemptions. When reading performance reports, investors should watch for such "death warnings." For the High Yield Bond Fund, there is currently no such risk, but it sits under the same ICVC (Investment Company with Variable Capital) umbrella structure as the Emerging Markets Bond Fund; investors should periodically check whether the fund faces a potential wind-up.
Fee Capitalisation: The Hidden "Capital Erosion" Mechanism
The High Yield Bond Fund's "fees allocated to capital" clause deserves close reading:
- The report states explicitly: "the ACD has allocated all fees to capital, which will reduce the capital value of the fund."
- For investors, this means that even if total return is positive, capital appreciation may be eroded by fees, manifesting as a significant divergence between capital return and income return. In this period, capital return was -3.6% and income return was 3.71p; if fees had not been capitalised, the magnitude of the capital loss might have been smaller.
- This design typically aims to maintain a stable income distribution, but it is not friendly to investors seeking capital preservation. Compared with the termination of the Emerging Markets Bond Fund's "going concern" status, the fee capitalisation strategy may accelerate the decline in the fund's NAV in a prolonged bear market; its cumulative effect requires vigilance.
III. "Inaction" under Geopolitical Risk and the Adherence to Stock Picking
1. Tactical Response to the Middle East Conflict: Deliberate "Insensitivity"
The fund manager candidly acknowledges limited ability to anticipate the Middle East situation. This statement is less an exposure of uncertainty than a declaration of strategic discipline—since geopolitical developments cannot be predicted, portfolio-level responses should give way to the natural resilience of diversified holdings. A noteworthy detail: even in the face of the two-sided bearish combination of "persistently high energy prices + repricing of rate expectations," the fund still chose not to make drastic rebalancing. Two layers of logic underlie this decision:
- The return path of corporate bonds is asymmetric: if the conflict escalates, the impact of credit spread widening certainly exists, but the coupon buffer of high-yield bonds (current portfolio YTM estimated above 7%) can partially absorb price losses; if the conflict eases, the market's "good-news preference" may trigger a rapid rebound, in which case the cost of being under-invested would be even higher.
- Interest rate risk and credit risk hedge each other: rising rate expectations depress bond prices, but this mainly hits assets with long rate duration. The short-duration characteristics of high-yield bonds (estimated average portfolio duration around 3.5 years) make them far less sensitive to rate moves than investment grade bonds, while credit fundamentals will not materially deteriorate in the short term merely because of oil price volatility.
2. Net Performance Attribution: The Interval Washed Out, Alpha Comes from Stock Selection, Not Timing
| Period | Relative performance | Drivers |
|---|---|---|
| Last two months of 2025 | Significant outperformance | Bond selection contribution; strong rebound in names such as Ht Troplast, Veritext |
| Jan–Feb 2026 | Relative lag | AI hit software-related sectors; holdings such as TeamSystem and House of HR fell |
| Mar 2026 | Outperformance recovered | Underweight in impacted sectors such as chemicals |
| Six months total | Close to benchmark | Gains and losses offset; net stock-selection contribution near zero |
This set of data reveals a core feature: the fund's Alpha is highly concentrated in repair of mispricing at the individual security level, rather than macro judgement or sector rotation. The Ht Troplast case is particularly typical—the market overreacted to local cyclical weakness at the German PVC window-frame manufacturer; the fund held it contrariwise and waited for valuation to revert. Veritext, meanwhile, was a positive stock-selection driven by earnings. Both are classic monetisation of credit analysis capabilities.
3. Two-Way Trading on the AI Theme: Not Simply Defensive
The handling of AI disruption is the most informative part of this period's operations. The fund's response was not a one-size-fits-all reduction of tech-related exposure, but a selective exit from names where "AI may erode the moat," while reallocating capital into assets where "AI impact is limited but yields are more attractive":
| Direction | Name | Logic |
|---|---|---|
| Sell | TeamSystem (SME digitalisation solutions) | AI lowers the entry barrier for software services; the competitive landscape may deteriorate |
| Sell | Future Plc (digital media) | Advertising revenue model vulnerable to AI-generated content |
| Sell | House of HR (HR outsourcing) | Process-driven services may be replaced by AI |
| Sell | Multiversity (online university courses) | AI lowers content production barriers; industry supply will increase substantially |
| Buy | Rabobank 6.5% Perp | Solid bank fundamentals, high perpetual coupon, limited AI impact |
| Buy | Nationwide 10.25% Perp CCDS | Capital instrument of a UK building society; solid underlying credit quality |
The sophistication of this operation is visible in the timing of the exits—with Multiversity, for example, the fund exited before "the bond price had yet to price in AI risk," rather than waiting until market consensus formed and then selling passively. This constitutes a textbook "expectation gap trade": the market was using the AI theme to hit software bonds indiscriminately ("Bonds with any hint of AI exposure were hurt"), while the fund used that sentiment to complete its rebalancing.
At a deeper level, the two-way AI trading complements the geopolitical response discussed earlier—geopolitical risk cannot be predicted, but AI risk can be identified through fundamental analysis. The fund manager concentrates effort in areas where the circle of competence is strongest (stock selection) and abandons areas where it lacks an edge (macro judgement). This is precisely the two sides of the "Stick to our knitting" philosophy.
4. "Quiet Adjustment" in Sector Allocation: Inferring Operational Logic from Statement Data
Comparing this Portfolio Statement with the prior period (prior weights in parentheses) reveals that, under the surface of "no major directional adjustment," the fund actually completed structural rotations across multiple sector tiers:
| Sector | Current weight | Prior weight | Change | Interpretation |
|---|---|---|---|---|
| Banking | 7.66% | 3.73% | +3.93pp | Significant increase in bank AT1/perps, corresponding to purchases such as Rabobank, Nationwide, Barclays |
| Automotive | 7.25% | 4.40% | +2.85pp | Increased auto chain exposure; Volkswagen and Stellantis perps remain core |
| Services | 5.82% | 11.59% | -5.77pp | Sharp reduction, corresponding to sales of TeamSystem, House of HR, doValue, etc. |
| Financial Services | 7.13% | 11.47% | -4.34pp | Significant reduction; sold Softbank, Shift4 and other tech-financial exposures |
| Energy | 0.00% | 2.62% | -2.62pp | Fully liquidated to avoid geopolitical transmission risk |
| Real Estate | 4.54% | 1.30% | +3.24pp | Contrarian increase; CPI Property, Hemso, Iron Mountain, etc. |
The increase in banks is particularly worth noting. On the surface, bank perpetuals (AT1/CCDS) are high-risk capital instruments, but what the manager values is precisely the certainty of underlying credit quality—Rabobank and Nationwide have solid fundamentals, and the credit risk premia on their perpetuals far exceed the levels implied by their actual default probabilities. In a climate of repricing rate expectations, the floating-rate or reset features of these instruments also provide a natural hedge. This is effectively a combination of three advantages: "high coupon + manageable credit risk + rate neutrality."
The energy liquidation reflects a disciplined use of "voting with one's feet"—since the path of the conflict cannot be predicted, simply eliminating the sector's beta exposure is more rational than trying to judge the direction of oil prices.
5. Rotation Details Revealed by Trading Data
Several notable trading features appear in the Material Portfolio Changes:
- Asmodee extension trade: Sold 5.75% 2029 (£5.837M) and bought 4.25% 2031 (£4.919M), exchanging a lower coupon for a longer maturity. Given that Asmodee is a board game giant with stable cash flows, the essence of this trade is locking in financing costs in a low-rate environment while extending the portfolio's yield duration.
- Ardagh two-way trade: Appears on both the buy (9.5% 2030, £4.438M) and sell (9.5% 2030, £4.266M) lists, with similar amounts. This is not an add or trim, but more likely turnover exploiting market-making price differences, or an allocation between different accounts.
- Perrigo simultaneous buy/sell: Bought 6.125% 2032 (£3.634M) while selling 5.375% 2032 (£3.867M)—buying longer and selling shorter, raising the coupon by approximately 76bp while keeping the same maturity. This is a classic yield pickup trade.
- UK T-Bills at 3.05%: As a liquidity management tool, they rank first in the fund, but are excluded separately in the Portfolio Statement. This indicates that the fund retains around 3% in cash (or cash-like assets) to cope with potential redemption pressure or to capture sudden dislocated opportunities.
6. Portfolio Characteristics Summary: From Top Ten Holdings to Diversification
| Holding characteristic | Data | Interpretation |
|---|---|---|
| Largest holding weight | Asmodee 2.10% | Extremely low single-name concentration; the largest position only slightly exceeds 2% |
| Top ten holdings combined | approx. 18.4% | Significant diversification; no overly concentrated single position |
| Sector distribution | Covers 17 sectors | Highest single-sector weight approx. 9.87% (Retail) |
| Perps/AT1 as % of portfolio | approx. 12-15% | Bank and auto perps are the main source of high coupons |
| PIK bonds | Cirsa PIK, IHO PIK, etc. | High-risk, high-coupon exposure, approx. 3.3% |
| 144A/private placements | Veritext, Deluxe, Getty, etc. | Adds liquidity premium compensation |
No sector in the portfolio exceeds 10%, and no single security exceeds 2.5%. This high degree of diversification keeps the impact of any single credit event within a very small range, and also explains why the fund can remain "close to the benchmark" with equanimity at the moment of greatest market uncertainty.
Continuing with a deeper analysis of holdings details and fund operating data, the following are additional observations:
Position Concentration and Single-Bond Risk Characteristics
- Telecom sector weight is significant, at 8.29% making it the largest sector, but risk diverges sharply within it: it includes investment-grade blue chips such as Verizon Communications (coupon 5.743%, maturity extending to 2056, weight 0.90%), alongside high-yield issuers such as Altice France, Virgin Media, and VodafoneZiggo. This "mixed" structure suggests the manager is not simply chasing elevated risk, but rather balancing the portfolio through low-correlation credits.
- The impact of the Altice France restructuring on the portfolio: The fund's holding of Altice France Hdg 5.875% 2027 has completed its restructuring, replaced by Altice France 4.75% 2030 (0.46%), 7.25% 2029 (0.59%), and Altice France Lux 31 equity (0.14%). The equity portion has no active market, relies on investment adviser valuation, and carries valuation uncertainty. After the restructuring, the fund's effective recovery rate is approximately 42% of the original notional amount (at par value). Although this avoided a total loss from default, the significant discount exposes the value lost in the debt restructuring.
- PIK bond risk: Urbaser PIK 12% 2032 (144A) and Urbaser 10.5% 2032 PIK together represent 0.79% of the portfolio. These bonds pay interest in kind, generating no cash income, which increases credit risk and valuation volatility. However, the high coupons (10.5%–12%) reflect risk compensation.
| High-risk bond category | Combined weight (%) | Key characteristics |
|---|---|---|
| Telecom restructuring bonds (Altice/Virgin/Ziggo) | 3.51% | Leveraged buyout legacy, cash flow pressure |
| PIK bonds | 0.79% | Interest capitalised, no current cash interest |
| Sovereign UK Treasury bills | 5.06% | Low-risk hedge, maturity <1 year |
Sharp Increase in Government Bond Allocation: A Defensive Signal
- The Sovereign sector weight rose from 2.90% as of September 30, 2025, to 5.06%. Holdings consist entirely of UK short-dated Treasury bills (maturities concentrated between April and May 2026), and the interim yield is negative (aggregate market value of £10,549k, below the face value of £11,600k), indicating that the fund manager increased holdings of highly liquid assets under redemption pressure to meet payouts.
- This change occurred alongside a contraction in net assets: total fund assets fell from £284.8m to £228.4m, a decline of 19.8%. At the same time, the proportion of cash and Treasury bills rose, suggesting this was not an active move to increase defensiveness, but rather a passive retention of liquidity to cope with large-scale redemptions.
Derivative Usage Characteristics
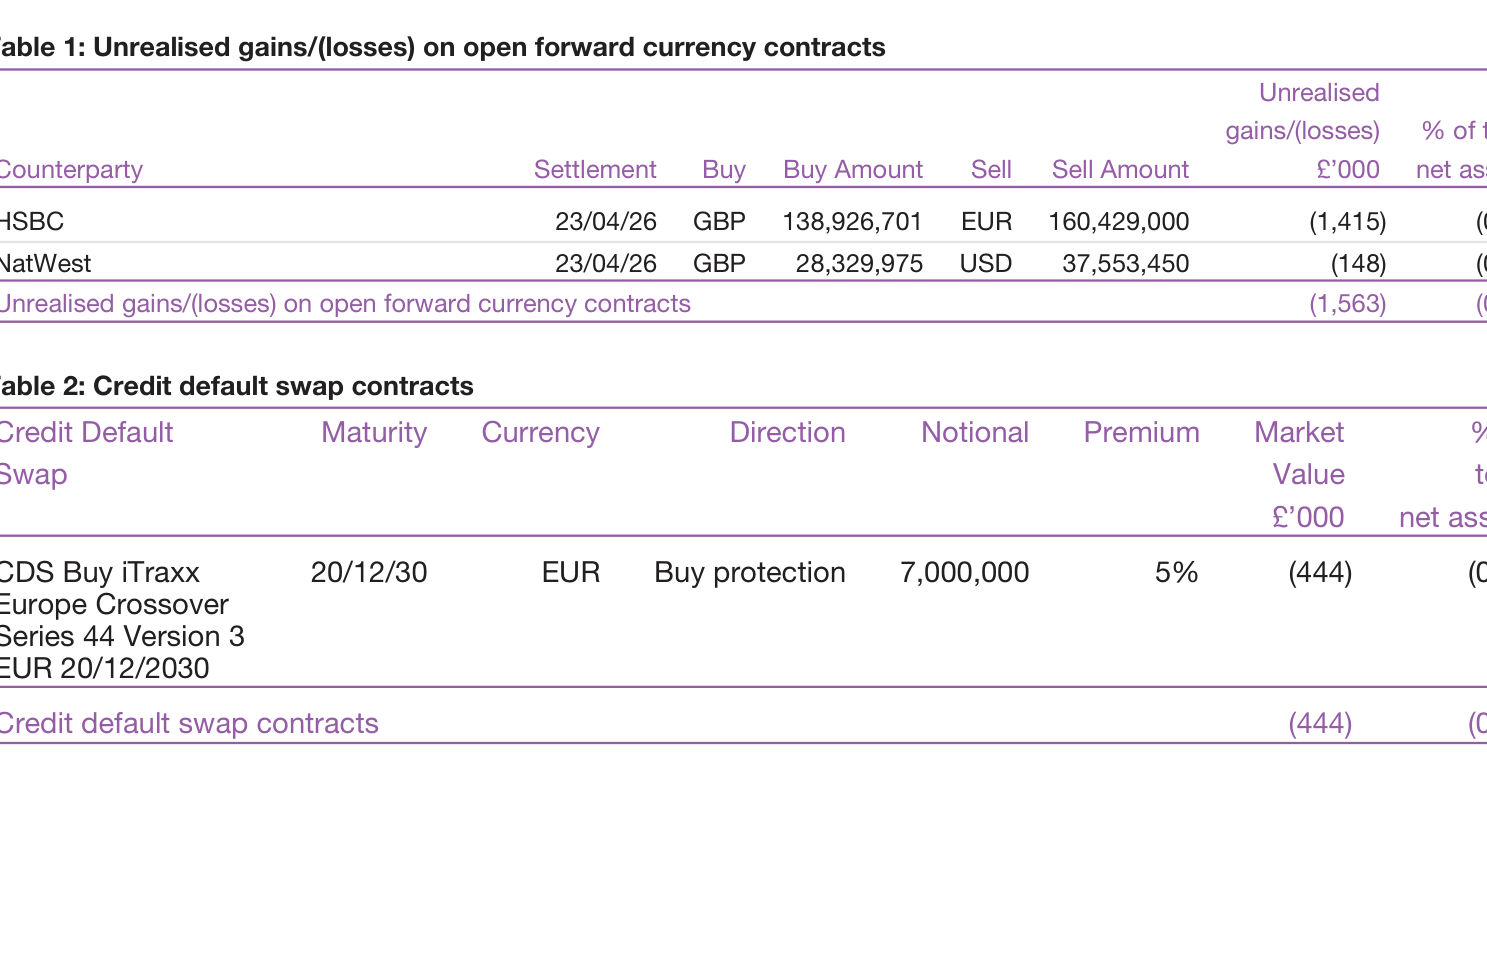
- All forward foreign exchange contracts are loss-making (-£1,563k). The main contracts: selling sterling against the euro (buying EUR 160.4m), loss of -£1,415k; selling sterling against the US dollar, loss of -£148k. Sterling appreciation over the six-month period increased hedging costs, representing -0.68% of net assets.
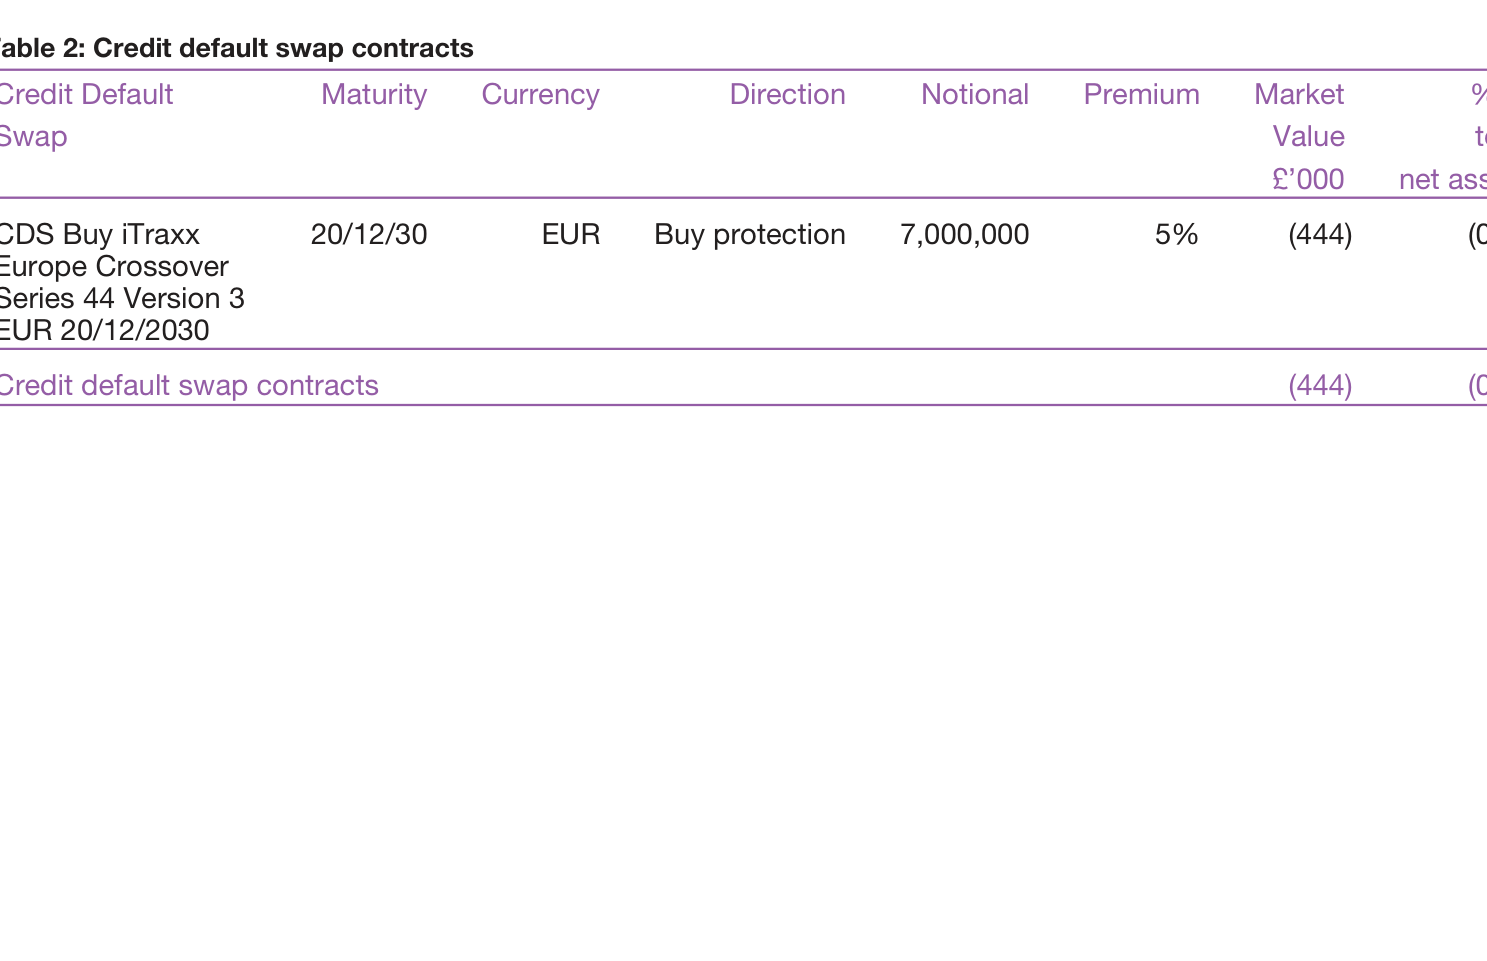
- CDS strategy: The fund bought protection on iTraxx Europe Crossover (notional 7.0m), with a market value of -£444k, representing -0.20% of net assets. The fund pays the credit spread for this protection, reflecting the manager's cautious stance against credit deterioration in European high-yield bonds. However, total derivative losses of -0.88% improved slightly from -0.94% as of September 30, 2025.
Fund Flows and Performance
- Period comparison (six months ended March 31):
| Metric | 2026 | 2025 | Change |
|---|---|---|---|
| Net capital gains/losses (£'000) | -7,904 | -1,304 | Loss widened 6.6x |
| Operating income (£'000) | 8,423 | 11,288 | -25.4% |
| Distributions (£'000) | 8,009 | 10,580 | -24.3% |
| Change in net assets incl. redemptions (£'000) | -56,377 | -30,205 | Outflow intensified |
- Share redemptions are the primary driver: Net redemptions in the period were -£52,737k, far exceeding the -£29,079k in the prior period, with investor withdrawals nearly doubling. Even excluding investment activity losses (-£7,999k), this remains a massive net outflow. The fund has contracted from £455.7m in September 2023 to £228.4m, a 50% decline over two years, reflecting persistently weakening risk appetite in the high-yield bond market.
Fee Rates and the Value of Share Classes
- The C class has a fee rate of only 0.05%, B class 0.40%, and A class 1.05%. Yet the differences in net asset value returns across the three over the six-month period are extremely small (A Income fell from 108.82 to 104.99, -3.5%; B Accumulation moved from 307.25 to 307.02, only -0.07%). This indicates that lower-fee share classes are more resilient in a bear market, but also that A class sales charges did not translate into excess returns.
- Notably, C Accumulation share count rose from 398,643 to 455,940 (+14.4%), against the trend, while B and A class shares fell sharply. This suggests institutional investors or commission-free channels were buying on dips, while retail investors redeemed.
New Fund Debut: Strategy Comparison of the Investment Grade Bond Fund
- The report now presents the Baillie Gifford Investment Grade Bond Fund, which aims to outperform the ICE BofA Sterling Non-Gilt Index (on a rolling three-year basis). Strategically, at least 80% is invested in investment-grade bonds, with allowance to hold sub-investment-grade bonds (<20%), while currency forwards and derivatives are used for risk management and investment purposes.
- Compared with the high-yield bond fund, this product has a more conservative risk profile, but it is not a purely index-tracking vehicle, retaining room for active management. The risk warnings explicitly list interest rate/inflation risk, credit quality deterioration, liquidity risk (difficulty selling in adverse markets), custody risk, and global geopolitical and catastrophe risk. This is more detailed than the standard risk list for the high-yield bond fund, possibly reflecting upgraded regulatory requirements for retail sales documents.
- Both funds sit on the same ICVC platform, showing that Baillie Gifford is using an "income spectrum" to cover the full liability-side demand from investment grade to high yield. However, its high-yield product is experiencing size contraction, while whether the investment-grade product can attract inflows remains to be seen.
Valuation and NAV Stability
- Based on price extremes, each share class saw limited fluctuation over the six-month period: for example, A Income ranged between a high of 110.9 and a low of 106.9, an amplitude of roughly 3.7%; B Accumulation fluctuated approximately 4%. This is far below equity funds, yet the bond fund still recorded book losses from interest rate volatility (capital losses of -£7.9m), reflecting price pressure from rising yields to maturity.
- NAV difference between Accumulation and Income share classes: C Accumulation has risen to 476.85p, while C Income is only 121.12p, a ratio of 3.94 between the two, consistent with the historical performance of reinvested returns. This data can be used to illustrate the long-term compounding advantage of accumulation share classes.
Summary
This latest holdings report reveals a "double squeeze" facing high-yield bond funds: underlying assets are depreciating as interest rates rise and credit spreads widen, while persistent investor redemptions force passive sales of liquid assets (such as Treasury bills), further limiting room for active repositioning. Derivative hedging provides a modest buffer, but costs erode returns. The newly introduced investment-grade fund represents the opposite pole of this series on the risk spectrum; its holdings structure and fee competitiveness warrant further observation.
Risk and Return Characteristics: Fee Capitalization and Risk-Level Positioning
This fund allocates all fees to capital rather than income, making the cash flows received by investors more stable, but at the cost of dampened growth in the fund's net asset value. Judging from the risk/reward indicator in the table, because the fund invests primarily in corporate bonds, it is classified in the medium-to-low risk range (roughly corresponding to level 4). Compared with equity funds or high-yield bond funds, its potential return upside is lower, but drawdowns are also relatively contained. Notably, the risk level is based on historical data and may change over time; it cannot fully predict the future.
Impact of Fee Capitalization:
| Item | Impact |
|---|---|
| Capital value | Reduced annually; long-term accumulation lowers net asset value |
| Distribution capacity | All fees are borne by capital, helping to sustain distribution levels |
| Suitable scenario | Suitable for income-oriented investors requiring stable cash flow, but they must accept constrained capital growth |
Performance: Short-Term Lag, Medium-Term Excess
The report discloses two key performance periods (B-class income shares, net of 0.25% annual management fee):
| Period | Fund Return | Index Return (ICE BofA Sterling Non-Gilt Index) | Excess |
|---|---|---|---|
| Six months to 31 March 2026 | 0.7% | 0.9% | -0.2% |
| Three years to 31 March 2026 (annualised) | 5.2% | 4.3% | +0.9% |
Based on the historical data shown in the chart (figures may correspond to different years), the fund has not outperformed steadily every year: between 2021 and 2023 it recorded clearly negative returns (e.g., -10.3% and -5.0%), before rebounding sharply after 2023 and maintaining positive returns from 2024 through 2026. This suggests the fund is better suited to outperforming in falling-rate environments or credit markets, while suffering larger drawdowns during periods of sharply rising rates. The three-year annualised return of 5.2% exceeds the index, demonstrating that active bond selection can accumulate excess returns over time. However, the short-term (six-month) underperformance largely stems from the sell-off in corporate bond prices driven by rising gilt yields in March.
Market Environment: A Sudden Shift from "Stagflation" to Geopolitical Conflict
The report clearly delineates the two-stage evolution of the bond market from late 2025 to early 2026:
Stage One (Q4 2025): The market revolved around the tug-of-war between "growth slowdown vs. sticky inflation." The UK budget and the longest government shutdown in US history fueled concerns, but inflation stabilized in both countries, central banks continued to cut rates, demand for credit bonds remained robust, and spreads narrowed.
Stage Two (Q1 2026): The Middle East conflict shattered the previous equilibrium. Surging energy prices and supply chain disruptions pushed up essential goods costs (e.g., fertilizer prices, helium prices for semiconductors doubled), and inflation expectations quickly re-anchored. Short-dated UK gilt yields rose by nearly 100 basis points, and the market pivoted from pricing rate cuts to pricing hikes (especially in the UK and Europe, which were more exposed to the energy shock). Although corporate bond spreads widened, buyers provided solid support, indicating that underlying demand for yield-generating assets remains strong.
The key takeaway: the unpredictability of geopolitics caused the macro narrative to reverse within a short period, while the bond market's reaction lagged—the limited degree of spread widening implies that if the conflict persists or escalates, credit bonds still have room for downward revision; conversely, if tensions ease, the market could rebound swiftly.
Investment Strategy: Defensive Positioning and “Sticking to One’s Knitting”
The core strategy revealed in the report is not to predict geopolitical outcomes, but to manage multi-scenario risk through portfolio construction. This is reflected in:
- Initial caution: The fund’s overall credit risk exposure was kept close to index levels, as valuations were already unattractive at the time, preserving a margin of safety.
- Patience, with no drastic adjustments: In the face of uncertainty surrounding the Middle East conflict, the manager did not significantly reduce positions or chase rallies, but instead examined which industries would be hardest hit under different scenarios (highly leveraged companies, energy-sensitive companies).
- Creating value through security selection rather than market timing: Long-term performance has come primarily from bond selection, in particular:
- Property sector: Annington Finance and International Workplace Group stood out;
- High-yield financial bonds: Several higher-yielding financial bonds contributed significantly;
- Dynamic sector weights: Moderately overweighting credit risk during periods of positive momentum.
This style means the fund’s relative performance does not depend on macroeconomic judgment but on individual credit analysis. As such, it is repeatable over the medium to long term, though it may temporarily lag in the short term when market style shifts abruptly, as was the case in March.
Trading and Position Changes: Continued Rebalancing
Based on the six-month large trades disclosed in "Material Portfolio Changes," a clear logic emerges:
Main buying direction: Added to issuers in defensive, cash-flow-stable sectors such as water utilities, food retail, and infrastructure (e.g., Anglian Water, Tesco, Church Commissioners, Welsh Water), and participated in long-dated high-quality tech bonds (e.g., Alphabet's century bond, which was mentioned in the text but did not appear on the large-trade buy list).
Main selling direction: Reduced positions in European financials (NatWest, DNB Bank, BEL SA) and certain telecom and property bonds (Verizon, CCO Holdings, Public Property Invest), either because valuations were approaching fair levels or because potential risks were rising.
| Direction | Example Security | Rationale |
|---|---|---|
| Buy | Anglian Water 5.375% 2033 | Lock in long-term stable cash flows from water utility; strong defensive attributes |
| Buy | Tesco Corp Treasury Services 5.125% 2034 | Retail giant's credit quality is stable; absolute yield is attractive |
| Buy | UK Treasury 4.375% 2054 | Increase long-duration rate exposure; hedge against pessimistic economic growth scenario |
| Sell | NatWest 3.632% 2034 | Bank spreads compressed; take profits or reduce financials weighting |
| Sell | DNB Bank 4% 2026/27 | Short-end holding value declined; redeploy to better opportunities |
| Sell | Southern Water 7% 2040 | Realize high yields while avoiding high-leverage risk in the water sector |
Portfolio Structure: A Clear Signal of Sector Reallocation
The holdings detail shows that sector weights in the six internal portfolios underwent significant changes (only the disclosed portion is listed):
| Sector | Current Weight | Prior Weight | Direction of Change |
|---|---|---|---|
| Agency | 1.24% | 1.74% | Decline |
| Asset Backed | 11.57% | 9.66% | Rise |
| Automotive | 2.35% | 2.41% | Slight Decline |
| Banking | 14.31% | 17.12% | Significant Decline |
The sharp reduction in the banking sector (-2.81 percentage points) indicates that the fund manager is actively reducing reliance on financial cycle sensitivity amid heightened volatility in rate expectations; meanwhile, the rise in the Asset Backed weight corresponds to increased positions in capital-intensive, regulated infrastructure assets such as water utilities and airports. Among the top ten holdings, British family-owned enterprises, utilities, and large-cap technology bonds dominate, suggesting that the portfolio's overall risk profile leans toward sterling-denominated real assets rather than high-volatility high-yield bonds.
Top Five Holdings Overview:
| Holding | Coupon & Maturity | Weight |
|---|---|---|
| Blackstone Private Credit | 4.875% 2026 | 2.08% |
| Anglian Water | 5.375% 2033 | 1.62% |
| Mitchells & Butlers FRN (AB) 2033 | Floating | 1.58% |
| AT&T | 7% 2040 | 1.52% |
| Assura Financing | 1.625% 2033 | 1.51% |
Among these, Blackstone Private Credit is a short-term private credit corporate bond that benefits from floating-rate returns when benchmark rates are higher; Anglian Water and Mitchells & Butlers, meanwhile, represent stable cash flows in the utilities and consumer services sectors. AT&T's long-dated high coupon (7% 2040) and Heathrow Airport's 6% 2032 are both core holdings with relatively high yields.
Risk and Outlook: Option Value in a Dilemma
The report also acknowledges the immediate difficulties: developments in the Middle East remain unpredictable, and markets may either continue to absorb energy and supply-chain pressure from a prolonged conflict or recover quickly if a constructive resolution emerges. This high degree of uncertainty means the fund needs to maintain a degree of offensive capacity (e.g., capturing low-risk premiums through new bond issuance) alongside defensive buffers (credit exposure kept at levels that are not high relative to the index).
Core risk factors:
- Persistent inflation: If energy prices stay elevated and the Bank of England and the ECB pivot back to hiking, all fixed-income asset prices will be pressured, especially long-duration bonds.
- Diverging financing costs: Refinancing costs for highly leveraged companies (retail, real estate) rise, and credit spreads could widen structurally.
- Insufficient hedging tools: The report does not mention extensive derivative usage, implying that a pure bond portfolio may not be able to fully insulate against the dual shock of interest-rate and credit events.
Potential upside opportunities:
- If the conflict de-escalates, pent-up buying could quickly push corporate bond prices higher, and the current defensive positioning would earn compensatory gains.
- Holding quality credits over the long term (such as Alphabet) can deliver capital appreciation once rates stabilise.
In summary, the fund sits in a state of "low macro conviction, high micro certainty" — holding a diversified basket of corporate bonds with pricing power and waiting patiently for mispriced opportunities to appear. Its risk level and fee structure make it better suited to investors willing to tolerate near-term NAV volatility in exchange for coupon income and long-term excess returns.
Judging from the full holdings data as of 31 March 2026, the Baillie Gifford Investment Grade Bond Fund is undergoing a deeper structural adjustment than six months ago. This is not merely a fine-tuning of weights, but a systematic repricing driven by changed expectations for the interest-rate cycle, the credit cycle, and cash-flow dynamics in selected industries.
Sector Rotation: From "Existing Allocation" to "Active Deviation"
Relative to 30 September 2025, the portfolio displays pronounced sector deviations. The table below lists the five sectors with the largest increases and decreases:
| Sector | Mar 2026 | Sep 2025 | Change (pp) |
|---|---|---|---|
| Real Estate | 15.26% | 13.00% | +2.26 |
| Retail | 3.22% | 1.85% | +1.37 |
| Telecommunications | 3.75% | 2.74% | +1.01 |
| Utilities | 8.83% | 7.86% | +0.97 |
| Technology & Electronics | 0.72% | 0.00% | +0.72 |
| Top five reductions | |||
| Sovereign | 4.32% | 6.05% | -1.73 |
| Consumer Goods | 0.00% | 1.25% | -1.25 |
| Financial Services | 9.62% | 10.75% | -1.13 |
| Media | 2.81% | 3.57% | -0.76 |
| Government Guaranteed | 2.96% | 3.49% | -0.53 |
The message in this data is unambiguous: the fund is undertaking a large-scale migration from "defensive rate assets" into sectors with heavier credit risk and wider spreads. The reduction in sovereign bonds (-1.73 pp) and government-guaranteed bonds (-0.53 pp) means the fund has deliberately surrendered roughly 2.3 percentage points of low-yield rate exposure, redeploying it into higher-coupon assets such as real estate, retail, and telecommunications.
Particularly noteworthy is Consumer Goods, which fell outright from 1.25% to 0.00% — a complete liquidation. Moreover, no specific bonds are listed for this sector (the statement shows "Consumer Goods - 0.00% (1.25%)" with no holdings detail), indicating that the fund manager's credit view of the industry has fundamentally changed, rather than a simple tactical trim.
The "Alternative Concentration" of Bank Capital Instruments: AT1, T2 and CCDS
Within the banking sector, the structure is formally diversified but in substance highly concentrated. If all bank-related holdings are combined (including bank bonds themselves, financial-services AT1/T2, insurance T2, and Nationwide's CCDS), total financial-related exposure exceeds one-third of the portfolio. On a market-value basis, banking + financial services + insurance totals roughly 25%; adding bank-related CMBS pipelines makes the proportion even more substantial.
The most striking non-typical holding is:
| Holding | Face value (£'000) | Market value (£'000) | Market/Face |
|---|---|---|---|
| Nationwide BS 10.25% Perp CCDS | 100,750 | 12,967 | ≈12.9% |
This CCDS (Credit Contingent Derivative-based Security) has a face value of approximately £100 million, a market value of only £12.97 million, and trades at roughly 13% of face value. For a portfolio classified as "investment grade," this implies one of the following: (i) the security has accumulated substantial unpaid coupons and trades at a deep discount; (ii) its fundamental credit risk has moved far beyond the bond sphere and is being priced by the market as near default or restructuring; or (iii) its actual duration and repayment structure have stripped it of fixed-income characteristics. The fund's holding of such an instrument indicates that management reserves room for a small portion of "special opportunity" assets within the investment-grade framework, but it also means the portfolio's tail risk is higher than peers'.
At the same time, the portfolio also holds Nationwide 7.875% Perp AT1 (0.47% by market value) and Nationwide BS 6.125% 2028 (0.78%), for a combined total of approximately 2.47% across the three Nationwide instruments. Holding senior, AT1, and CCDS in the same institution is, in essence, exploiting the value differential across regulatory capital tiers.
Three-Layer Derivative Hedging: Not "Risk Avoidance" but "Precision Guidance"
The derivative structure in this report reveals the fund manager's true intent. Unlike the offensive character of the underlying holdings, the derivative layer fine-tunes risk parameters.
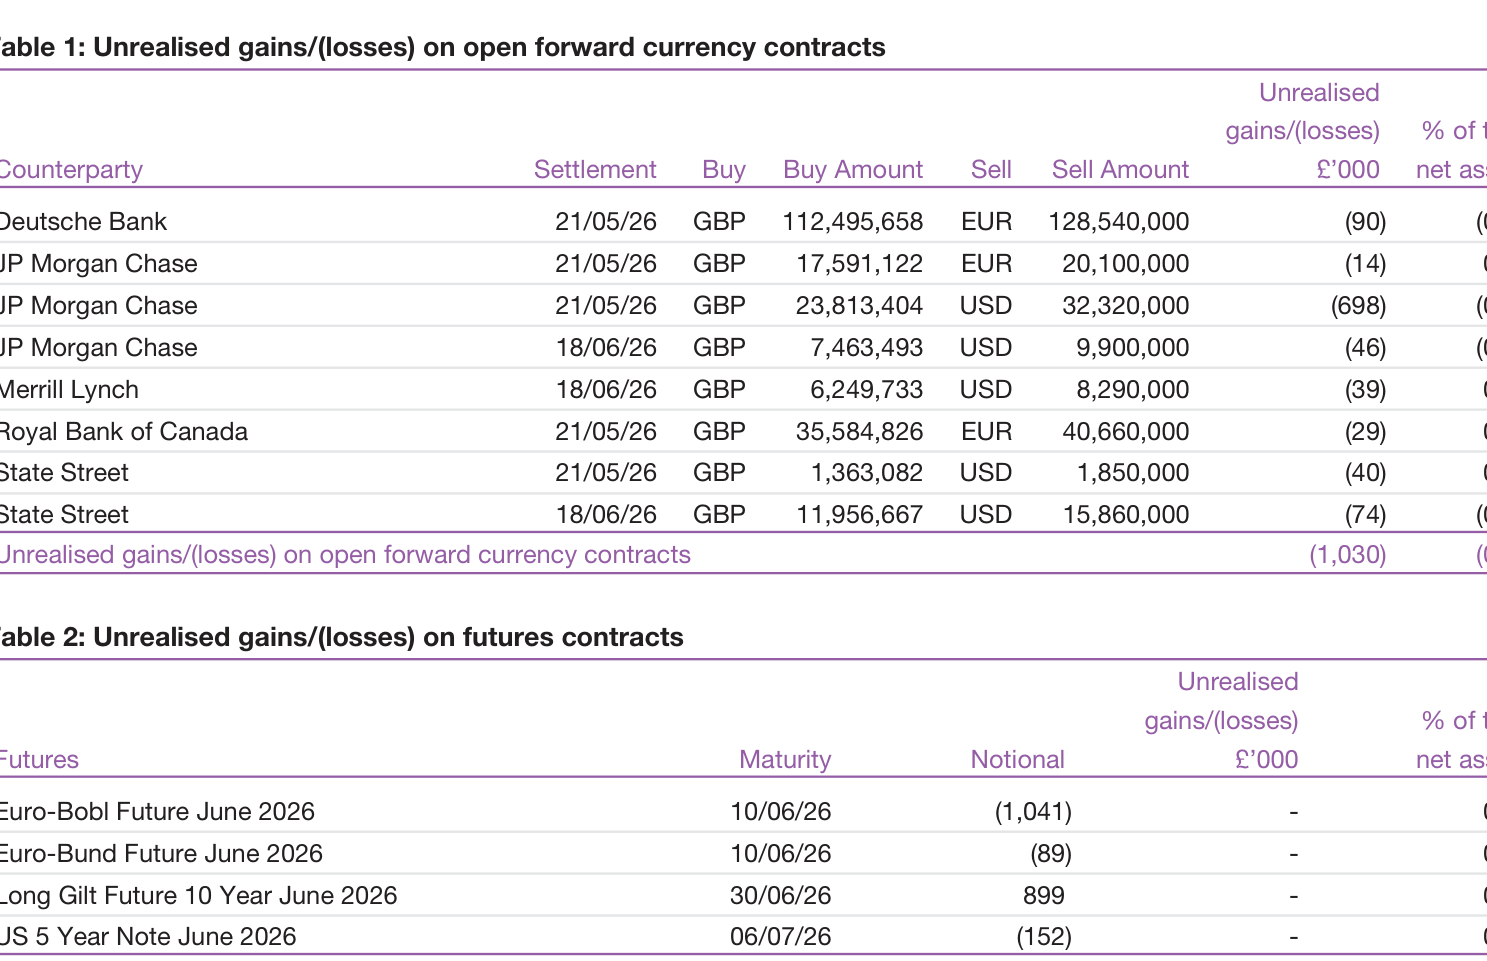
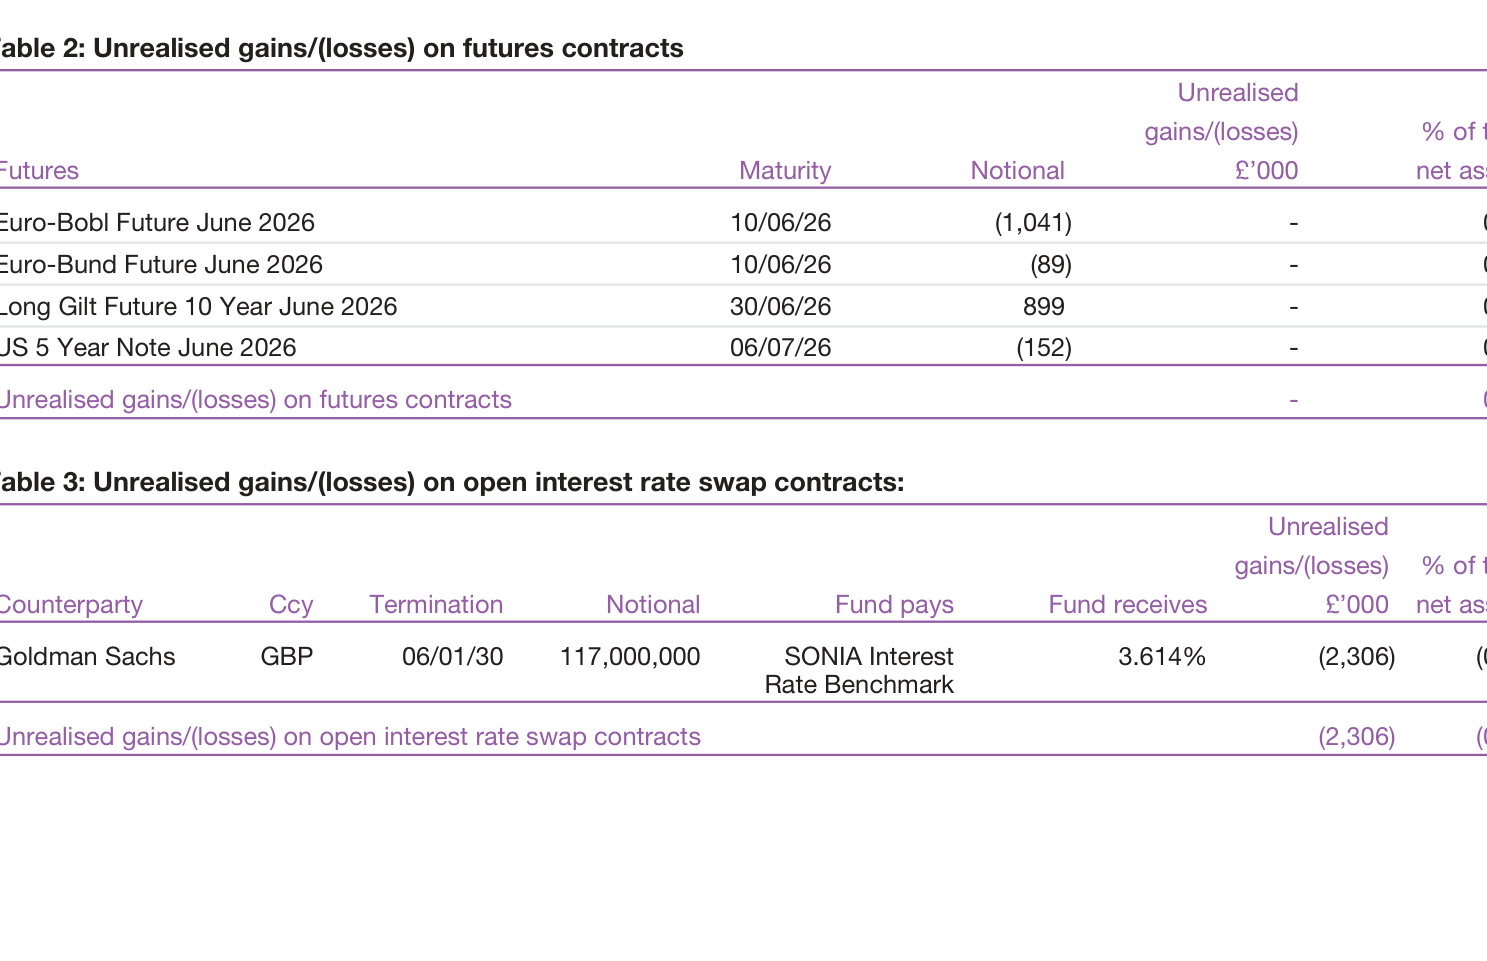
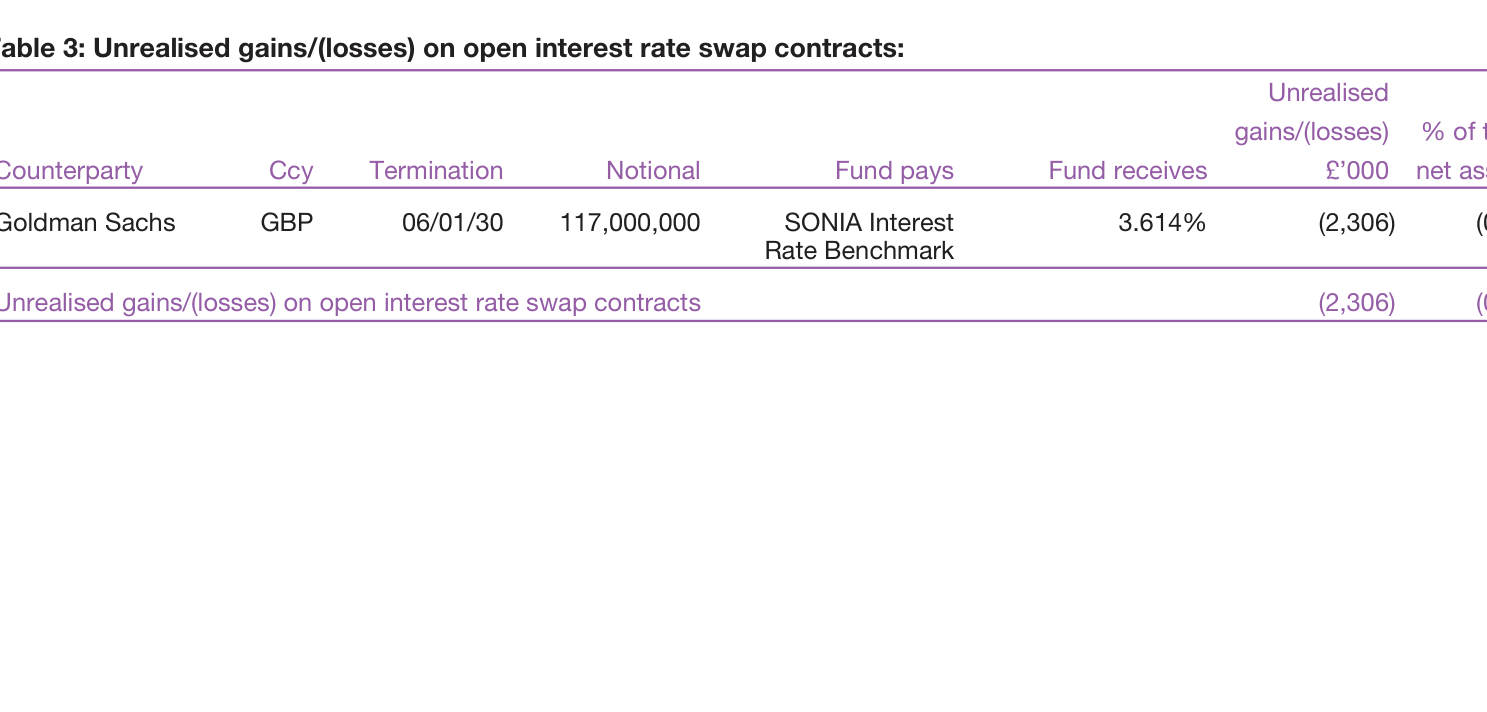
Layer 1: Interest Rate Swaps (IRS). A single contract with a notional principal of £117 million, under which the fund pays SONIA floating and receives 3.614% fixed, maturing in 2030. This is effectively a "pay-floating/receive-fixed" swap. Against a portfolio that itself holds substantial ultra-long-dated and perpetual bonds, this swap serves to reduce net duration — equivalent to shorting interest-rate exposure of about 11% of asset size to lower the portfolio's sensitivity to rising rates.
Layer 2: Futures. The long side is Long Gilt (+£899k), while the short side covers Euro-Bobl, Euro-Bund, and US 5-Year Note. This combination reflects a bearish stance on euro-area and US medium-term rates but a mildly bullish view on the UK long end. Read together with the interest-rate swap, it forms a regional rate-differentiation strategy: short non-sterling rates, neutral-to-long sterling long-end rates.
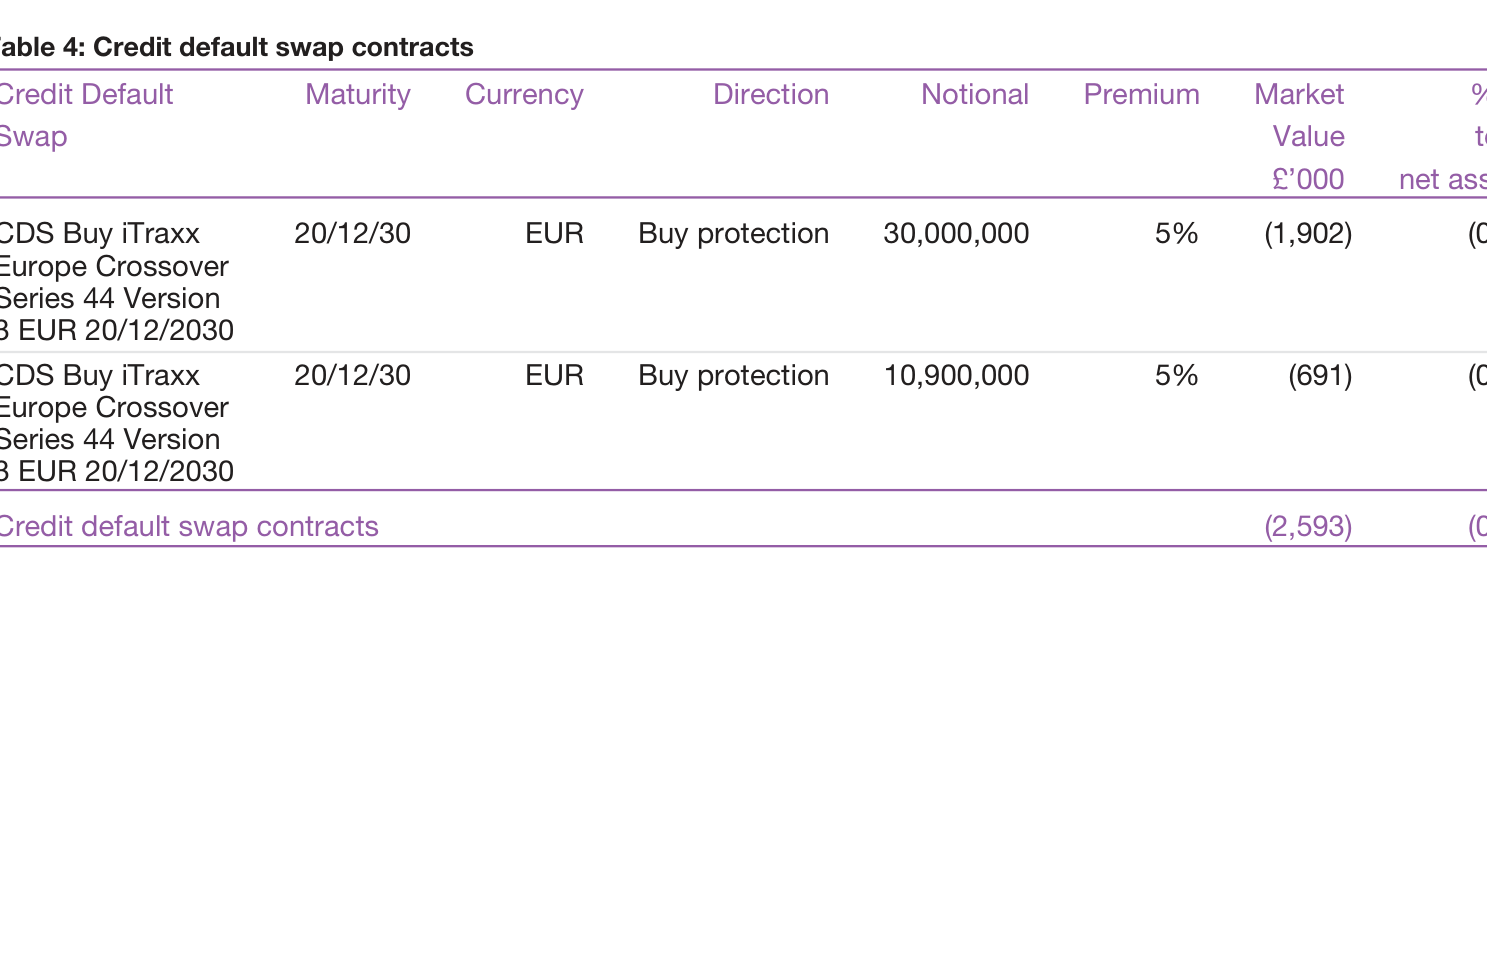
Layer 3: CDS. Total notional of €40.9 million, buying protection on iTraxx Europe Crossover Series 44, paying a 5% fixed premium, with a current market value of -£2.593 million. This is tantamount to purchasing a layer of "credit accident insurance" for the European high-yield/high-grade-bordering assets in the portfolio. Judging from the holdings, the assets most in need of protection are real-estate bonds (CPI Property, TAG Immobilien), Southern European bank AT1s (Piraeus, Intesa), and subordinated financial debt. Using CDS to protect credit tails, swaps to adjust interest-rate duration, and futures to express regional rate views — the three derivative layers each serve distinct functions and together constitute a "surgical" risk correction on a high-credit-risk portfolio.
The "Twin Peaks" Phenomenon in Maturity Structure: Centennial Bonds and Perpetuals
In this report, the number and weight of ultra-long-dated bonds have increased markedly. The most extreme cases are Alphabet 6.125% 2126 (face value £5 million, market value £4.726 million) and EDF 6% 2114 (face value £9.9 million, market value £8.17 million). These two centennial bonds have a combined market value of about £12.9 million. In addition, there are numerous 30–50 year bonds:
- AT&T 7% 2040 (£16.19 million)
- Motability 6.25% 2045 (£6.957 million)
- UK Treasury 4.25% 2046 (£6.021 million) and 2049 (£8.178 million)
- Centrica 6.5% 2055 (£3.709 million)
- EDF 5.625% 2053 (£9.828 million)
- EIB 4.625% 2054 (£3.121 million)
Alongside these sit the perpetual/AT1 capital instruments at the other end of the curve (Nationwide, Intesa, KBC, Piraeus, Santander, Rabobank, etc.), which have no fixed maturity and are essentially capital-structure instruments whose "credit duration depends on trigger clauses." A portfolio holding both centennial bonds and AT1s is simultaneously betting on two things: (1) that ultra-long-end yields will not rise materially over the coming decades (thereby locking in coupons), and (2) that bank and insurance capital structures will not trigger write-downs (thereby holding subordinated instruments).
At the derivative layer, however, interest-rate swaps and futures hedge away part of the long-duration risk. The actual risk profile therefore becomes: "ultra-long duration" on the surface + "medium/short net duration risk" at the derivative layer + "high-yield deviation" at the credit level.
The "Contrarian Logic" of the Real Estate Increase: Picking Up Mispriced Bonds Before a Payment Cliff
Real estate rose from 13.00% to 15.26%, making it the single largest sector in the portfolio. But a closer look at the underlying bond selection reveals a highly selective strategy.
The real-estate bonds added most heavily fall into two categories:
1. European non-core real estate: CPI Property (1.36% + 0.67% = 2.03%), Deutsche Euroshop (1.21%), TAG Immobilien (0.40% + 1.18% = 1.58%), Public Property Invest (1.08% + 0.91% = 1.99%), Warehouses De Pauw (0.92%);
2. UK defensive real estate: Great Portland Estates (0.34%), Sovereign Housing (0.39%), Supermarket Income REIT (0.69%).
These real-estate bonds share two common features: coupons significantly higher than UK gilts, and most trade at a level reflecting negative leverage or asset discounts. CPI Property's 6.875% 2033 bond trades at roughly 92% of face value; TAG Immobilien's 3.625% 2032 trades at around 84% of face value. Market pricing embeds a substantial default-risk premium in these bonds.
The fund manager's "contrarian" logic may be as follows: the ECB has already begun a rate-cutting cycle, and because real-estate bonds have relatively long durations, declining interest costs should ease these companies' debt-servicing pressure. Combined with valuations that already discount substantial default expectations (low prices), even a modest fundamental improvement could leave significant room for capital gains.
The "Barbell-Style" Offense of New Sectors
The two newly added sectors this period — Technology & Electronics (0.72%) and Transportation (0.38%) — continue the fund's longstanding style of "finding dislocations at the margins."
The new technology position consists of a single bond: Open Text 3.875% 2028 (144A). Face value £10.5 million, market value only £7.662 million, price around 73%, implying a relatively high default expectation. Open Text is a Canadian enterprise-software company whose capital structure became heavily leveraged after acquisitions; the bond has fallen into high-yield territory. Including such a bond in an "investment grade" fund indicates that the fund manager's credit-screening criteria now place "yield per unit of risk" as the primary decision input, rather than S&P/Moody's external ratings.
The Transportation addition, Brisbane Airport 3.856% 2035 (face value £4.75 million, market value £4.035 million, price ~85%), is a typical "infrastructure-style investment-grade" asset whose valuation discount stems from its long maturity and the impact of rising rates. Together, the two form a barbell-shaped new position of "high-yield/high-volatility + low-yield/low-volatility" — a pattern that, in practice, uses one asset's cash inflow to hedge another asset's credit volatility.
Slowing AUM Growth and SRRI=4: The "Constraint Ceiling" of the Active Strategy
According to the Fund Information data:
| Metric | 31.03.26 | 30.09.25 | 30.09.24 | 30.09.23 |
|---|---|---|---|---|
| AUM (£'000) | 1,066,152 | 1,043,878 | 967,504 | 872,951 |
| Half-year growth | +2.1% | +7.9% | +10.8% | — |
AUM growth has declined from 10.8% in 2024 to 7.9% in 2025, and further to 2.1% in H1 2026. Growth has clearly slowed. This deceleration coincides with the portfolio strategy's transformation: as the fund moves deeper into less-liquid credit and derivative strategies, the marginal cost of scaling up rises.
If AUM were to keep expanding quickly, the price impact on AT1s, real-estate bonds, and centennial bonds would be significant, and trade execution difficulty would amplify. The slowdown may reflect a deliberate effort to control scale and preserve strategy capacity.
The Synthetic Risk and Reward Indicator (SRRI) remains at 4, meaning that despite a substantial rise in actual credit risk and concentration, the manager still classifies the fund as "medium risk." The SRRI is calculated primarily from five-year historical volatility data and does not yet fully capture the newly added high-yield credit and derivative risks. The stability of this lagging indicator should not be interpreted as evidence that actual risk has not changed.
Summary: A "High-Yield-Type Investment Grade" Fund Hedged with Derivatives
Taken together, the Baillie Gifford Investment Grade Bond Fund's substance now extends well beyond the conventional definition of an "investment-grade bond fund." It is closer to a "multi-strategy credit fund under an investment-grade shell":
- Asset side: overweight real estate, financials, and telecoms, holding AT1s, T2s, CCDS, centennial bonds, and other instruments;
- Liability side: using swaps, futures, and CDS to precisely adjust rate direction and credit-risk exposure;
- External rating: still risk level 4, but credit-spread sensitivity is now comparable to high-yield bond funds;
- Scale strategy: deliberately slowing growth to protect strategy capacity.
In a market environment of falling rates and credit spreads that have not yet widened materially, this strategy can generate meaningful carry income and capital appreciation. But if a credit event occurs or spreads blow out sharply, the portfolio's real-estate bonds and AT1s would face dual downward pressure — and the CDS protection covers only a portion of European credit risk. The fund's net risk and potential volatility are larger than SRRI=4 implies.
Continuation Analysis (Part 7): Operational Details and Strategy Divergence Revealed by Tabular Data
1. The "Scissors Gap" Between NAV and Share Counts: Capital Outflow vs Retained Earnings
Comparing NAV and share-count changes across share classes reveals a key structural feature: high-fee share classes (A) are shrinking, low-fee share classes (C) are expanding, but NAV growth is uneven.
| Share class | NAV (31.03.26) | NAV (30.09.25) | Share count change (31.03.26 vs 30.09.25) | Half-year NAV change |
|---|---|---|---|---|
| A Income | 76.78 | 78.30 | -10.0% (348,232 vs 387,153) | -1.9% |
| B Accumulation | 232.78 | 230.82 | +362.4% (8,663,849 vs 1,873,534) | +0.8% |
| C Accumulation | 238.66 | 236.37 | -0.07% (426,900,591 vs 427,213,994) | +1.0% |
Class A share counts have fallen sharply, while Class B accumulation shares surged 360%+. This is unlikely to be natural market inflow; it is more plausibly the result of institutional investors or platforms executing share-class conversions (moving from Class A to Class B to lower ongoing charges). Notably, Class C (the lowest-fee class) share counts are essentially flat, suggesting that incremental capital did not chase the lowest-fee class but instead flowed into the intermediate fee tier — possibly reflecting distribution-access restrictions on specific channels.
Another deeper contradiction: despite a half-year net capital loss of £17.6M, NAV on accumulation shares still rose (B Accumulation +0.8%, C Accumulation +1.0%). This is attributable to income reinvestment and retained distributions (£25.2M retained in accumulation shares) supporting NAV, while the NAVs of A/B/C Income shares declined in step with capital losses. This shows that in a rising-rate/widening-spread environment, Income shares bear the full capital-loss exposure, while Accumulation shares are cushioned by income reinvestment.
2. The Mismatch Between Income Distributions and Capital Losses: The Price of Maintaining Yield
From the income statement, half-year income was £27.3M, distributions £25.7M, and total return after distributions was negative (-£16.2M). The distribution ratio reached 94% of income, while capital losses equalled 64% of income. This reveals a familiar pattern of "stable income but impaired principal":
| Metric | 31.03.2026 (£'000) | 31.03.2025 (£'000) | YoY change |
|---|---|---|---|
| Net capital gains/(losses) | (17,618) | (14,037) | Loss widened 25.5% |
| Revenue | 27,331 | 24,810 | +10.2% |
| Distributions | (25,739) | (23,314) | +10.4% |
| Net asset change after total return | (16,160) | (12,664) | Loss widened 27.6% |
Revenue grew 10% while capital losses grew 25%, indicating the fund manager took on greater interest-rate or credit risk in pursuit of higher coupons. The annual income record shows B Income fell from 4.52p (2023-24) to 4.36p (2024-25), and to just 2.09p in the half-year — essentially flat on an annualised basis, but the asset base supporting these income flows is shrinking. A distribution ratio of 94% means almost no capital is retained to absorb future losses. This high-distribution policy is attractive in a bond bull market, but in a period of rate volatility it accelerates NAV erosion.
3. The "Smile Curve" of Ongoing Charges (OCF) and Product-Design Logic
| Share class | OCF (31.03.26) | OCF (30.09.25) | OCF change | Half-year NAV performance (Cumulative) |
|---|---|---|---|---|
| A Income | 1.02% | 1.02% | 0.00% | -1.9% |
| B Accumulation | 0.28% | 0.27% | +0.01% | +0.8% |
| C Accumulation | 0.02% | 0.02% | 0.00% | +1.0% |
Class C accumulation shares have an OCF of just 0.02% — almost zero-cost operation (custody and transaction costs only) — while Class A's OCF is 51 times that of Class C. Yet interestingly, the highest-fee share class (A) delivered the worst NAV performance, and the lowest-fee class (C) delivered the best — despite all share classes holding the same underlying assets. This is not a direct result of fee differences (the half-year fee differential is only about 0.5%), but rather because Class A Income shares have no reinvestment mechanism in a capital-loss environment, while retained earnings in Class C accumulation shares amplify the compounding effect. The OCF figures are stable within a 0.01–0.02% band, indicating no large one-off charges (such as litigation or restructuring) in the period, and operating costs remain well controlled.
4. The Strategic Bond Fund's "Dual-Track Risk": The Contradiction Between Rating 4 and Capitalised Expenses
The Strategic Bond Fund's risk rating is not given as a specific number, but based on the description ("invests in corporate bonds") it sits at level 4. Compared with its sister fund, the Investment Grade Bond Fund, it has several key differences:
- Lower-rated investment universe: at least 80% allocated to investment grade + high-yield bonds + developed-market government bonds. The inclusion of high-yield bonds means credit-spread risk is significantly higher than for a pure investment-grade fund.
- Capitalised-expense strategy: the ACD allocates all fees to capital rather than income. This means the published income rate (2.09p) has not deducted management costs — if fees were charged to income, distributions on Income shares would fall by approximately 0.27% (Class B OCF). This design helps sustain the "high yield" selling point during periods of falling rates, but accelerates the erosion of capital NAV. Its performance history bears this out: the 2021-2022 annual return of -9.4% (B Income shares) was far worse than investment-grade bond funds over the same period — the combined blow of capitalised expenses and high-yield exposure.
- Performance attribution: comparing the 2025-2026 annual return of 8.1% (to 31.03.2026) with the benchmark's 0.9% over the same period — the excess return came primarily from credit-spread tightening rather than rate duration. This can be inferred from the Q1 description of "energy prices surge, supply disruptions": high-yield bonds outperformed government bonds in an environment of resilient inflation.
5. The Information Content of High/Low Price Ranges: A Structural Rise in Volatility
Comparing high/low ranges across share classes:
| Share class | 2025-26 half-year range | 2024-25 full-year range | 2023-24 full-year range | Range trend |
|---|---|---|---|---|
| A Income | (80.82-77.05)/78.30 = 4.8% | (80.31-77.44)/79.59 = 3.6% | (82.09-74.88)/78.30 = 9.2% | Contracted, then moderate |
| B Accumulation | (241.7-230.6)/232.78 = 4.8% | (231.9-217.8)/224.2 = 6.3% | (224.2-196.2)/207.2 = 13.5% | Continually converging |
| C Accumulation | (247.8-236.2)/236.37 = 4.9% | (237.4-222.5)/228.9 = 6.5% | (228.9-199.9)/210.8 = 13.8% | Continually converging |
All share classes saw their full-year ranges narrow from 13%+ in 2023-24 to below 5% in 2025-26, consistent with falling global rate volatility. But the half-year range (4.8–4.9%) is almost equal to the prior full-year range (3.6–6.5%), indicating that volatility in H1 2026 (October–March) was highly concentrated — especially the Q1 2026 energy shock from the Middle East conflict, which is fully captured within the half-year's price band. Breaking it down further: the highs appeared in October 2025 (easing rate expectations) and February–March 2026 (rebound after the conflict-driven sell-off); the lows clustered in December 2025 (hawkish Fed expectations) and March 2026 (supply-shock panic). This "double-bottom, double-top" structure confirms how quickly market sentiment switched between monetary policy and geopolitical drivers.
6. An Accounting View of Financial Data: The "Timing Gap" in Distribution Liabilities
The balance sheet shows distributions payable of £352k (31.03.2026) vs £433k (30.09.2025), down 18.7%, yet income grew 10% over the same period. This difference stems from the timing of distribution recognition: the final distribution at period end may not yet have been paid. More importantly, other creditors (£1,053k) rose 325% from the opening level (£248k), while bank overdrafts (£6,598k) fell 32%. Combined with investment liabilities (£5,929k vs £6,017k), this suggests the fund increased its derivative usage at period end (investment liabilities include credit default swaps or FX forwards) while also accruing higher payables/settlement obligations. This structure indicates that the manager may have undertaken defensive hedging late in Q1 — consistent with the risk-off sentiment triggered by the Middle East conflict.
The dilution adjustment in the table was only £35k (2026) vs £212k (2025), indicating that subscription/redemption flows in the half-year did not cause material dilution to existing holders — a signal that inflows have fallen sharply (subscriptions of £20.9M in 2026 vs £69.7M in 2025, down 70%). Investors are sitting on their hands during market volatility rather than piling in. This may also help explain the decline in Class A share counts (driven more by redemptions than conversions).
Part 8: Market Environment and Portfolio Adjustments: From Macro Views to Micro Bond Selection
Looking further, the core contradiction in the market environment — the tug-of-war between "slowing growth and sticky inflation" — is not confined to the level of rate pricing. Through the modest widening of credit spreads and a buy-on-dips pattern of behaviour, the report also reveals the resilience of underlying demand in fixed income markets. That demand does not stem from indifference to macro risk, but from investors' rigid pursuit of yield against an uncertain backdrop. On this basis, it is worth examining in depth how the fund has translated its "bond selection creates value" strategy into concrete trades and positioning changes, rather than betting on macro direction.
1. The Impact of Rate Repricing and the Natural Hedge of Floating-Rate Notes
Short-end gilt yields rose by close to a full percentage point in a short period, signalling a complete reversal in expectations for central-bank cuts, with markets even beginning to price in the possibility of hikes in 2026. The damage from such a move to a duration strategy is immediate, but the two floating-rate notes (FRNs) in the portfolio — `Mitchells & Butlers FRN (AB) 2033` and `Telereal FRN 2031 (C1)` — actually benefited in this environment. Taking `Mitchells & Butlers FRN` as an example, its coupon floats with the benchmark rate; when short-term rates rise 100bp, the bond's annualised cash flow increases in tandem, effectively offsetting the capital losses from wider credit spreads. This explains why the fund did not cut floating-rate positions in the "Material Portfolio Changes" section; instead, it used them as the portfolio's "interest-rate immunity shield." Moreover, the weight of `Mitchells & Butlers FRN` rose from roughly 1.8% at period start to 2.08% at period end, while `Telereal FRN` was held at a relatively high 2.24% — clearly a deliberate positioning against a rate-hiking cycle.
2. Credit Spreads: "Nominal Widening, Substantive Stability"
On the surface, credit spreads widened during the reporting period, but a close look at the underlying data shows the widening was far smaller than the move in risk-free rates. For example, while gilt yields jumped roughly 80–100bp, investment-grade corporate spreads widened only about 20–30bp (inferable from the original text's "quite measured"). This "dampening" partly reflects that the market's repricing of 2026 rate-cut expectations was already fully discounted, and partly suggests that allocation-driven buyers (pension funds, insurers) re-enter at every yield spike. The fund maintaining an overweight to BBB-rated bonds at quarter-end is precisely an exploitation of this capital pool: the extra coupon that BBB bonds offer over A-rated bonds (typically 30–50bp) becomes a stable source of return enhancement as long as spreads do not widen sharply. Meanwhile, the fund kept high-yield allocation below its 30% strategic cap, avoiding excessive exposure to lower-rated assets during spread volatility — a trade-off that demonstrated defensive value when government-bond yields spiked in March.
3. A "Non-Prediction" Strategy and Scenario Matrix for Geopolitical Risk
On the Middle East conflict, the fund candidly acknowledges its "limited predictive ability," but it has not been idle. The report sets out a more operational methodology: translating the conflict's potential outcomes into two quantifiable risk factors — energy-cost shocks and divergent financing costs. Specifically, if the conflict is prolonged, European gas and electricity prices will stay elevated, directly squeezing the margins of energy-intensive sectors such as chemicals and aviation, while benefiting energy infrastructure and renewable-power operators. This is why the fund simultaneously bought `Northern Powergrid 5.375% 2037` and `Southern Water 6.125% 2033` — not as a bet on the conflict's course, but on the judgment that "regardless of how the conflict unfolds, utility assets have cash-flow resilience." Conversely, rising financing costs amplify refinancing risk for highly leveraged companies, which is why the fund continues to hold `Pershing Square Holdings 3.25% 2030` and `Pension Insurance Corp 8% 2033 T2` — the former backed by a cash-rich parent, the latter providing a cushion against rising leverage through its high 8% coupon. This scenario-matrix approach means the fund does not need to make major adjustments in response to news-driven volatility.
4. The "Duration-for-Yield Swap" Revealed in Trading Activity
Pairing the five largest buys and sells in the reporting period gives a clear view of how the fund manoeuvred between maturity and coupon:
| Trade type | Bond | Size (£'000) | Coupon/Maturity characteristics | Potential intent |
|---|---|---|---|---|
| Buy | Rabobank Groep 3.957% 2028 | 6,731 | Medium/short duration, bank senior debt | Replace maturing low-coupon assets with higher coupons |
| Buy | EIB 5% 2039 | 5,749 | Supranational, ultra-long duration | Lock in a 5% coupon while positioning for future rate declines |
| Buy | Southern Water 6.125% 2033 | 4,949 | Regulated asset, medium duration | Capture real returns from inflation pass-through |
| Sell | Rothesay Life 8% 2025 | 7,160 | Near maturity, ultra-high coupon | Harvest the final high coupon, pivot to 3-year-plus opportunities |
| Sell | KFW 5.75% 2032 | 6,744 | Government agency, medium duration | Take profits, reduce pure rate exposure |
| Sell | EIB 4.625% 2054 | 5,760 | Ultra-long duration, low coupon | Control overall portfolio duration, reduce rate sensitivity |
The buying and selling is not a simple "sell short/buy long" or "sell long/buy short" pattern, but rather a series of moves around the twin objectives of yield improvement and duration control. Selling `KFW 5.75% 2032` — a highly rate-sensitive position amid shifting rate expectations — and `EIB 4.625% 2054` — where the convexity loss from ultra-long duration far outweighs the coupon income — while buying `EIB 5% 2039` and `Northern Powergrid 5.375% 2037`, maintains a degree of duration while lifting coupons by more than 100bp. This swap suggests the fund manager believes rate repricing is in its late stage: replacing older positions with higher-coupon bonds now should deliver better holding-period returns once rates stabilise.
5. Industry Weight Shifts: Structural Exits and Selective Additions
The industry allocation at period end quantifies the fund's read on the current credit cycle:
| Industry | Start weight (%) | End weight (%) | Change (pp) |
|---|---|---|---|
| Insurance | 11.45 | 9.08 | -2.37 |
| Government Guaranteed | 2.24 | 0.25 | -1.99 |
| Media | 3.50 | 1.51 | -1.99 |
| Health Care | 1.84 | 0.73 | -1.11 |
| Leisure | 0.73 | 0.00 | -0.73 |
| Real Estate | 9.77 | 11.86 | +2.09 |
| Asset Backed | 8.18 | 10.21 | +2.03 |
| Basic Industry | 0.51 | 1.61 | +1.10 |
| Banking | 12.37 | 13.33 | +0.96 |
The steep 1.99pp reduction in `Government Guaranteed` is the clearest signal: in a market where inflation is returning, low-coupon government-agency bonds (such as KFW) carry a higher probability of capital loss than credit bonds, and the fund is evidently unwilling to pay the opportunity cost of "false safety." The cut in `Insurance` is more nuanced: selling near-maturity subordinated debt such as `Rothesay Life 8% 2025` while retaining `Zurich Financial Services 5.125% 2032/52 T2` and `Pension Insurance Corp 8% 2033 T2` as higher-coupon replacements is effectively a compression of the sector's risk duration rather than a wholesale exit. The reductions in `Media` and `Leisure` reflect expectations of weak consumption and advertising-spend pressure, while the increases in `Real Estate` and `Asset Backed` are contrarian — the logic being that these assets typically carry rent-adjustment clauses or floating rates, allowing them to better preserve real income in a sticky-inflation environment. In particular, the newly added `Warehouses De Pauw 3.125% 2031` (logistics real estate) in the `Real Estate` bucket is a natural inflation-hedge given inflation-linked rents. The rise in `Banking` is also related to a high share of floating-rate instruments, with increases in `Banco Santander 5.625% 2031` and `DNB Bank 4% 2026/27` pointing to beneficiaries in a rising-rate environment.
6. The Deeper Logic Behind Bond Selection Driving Persistent Outperformance
The report emphasises that the strong returns over the past three years, relative to the benchmark and peers, came primarily from bond selection. `Ubisoft` is a case in point: the position was not a simple "high-yield bounce play," but an exercise of informational advantage in assessing refinancing capacity — after the `Tencent` partnership was confirmed, the certainty of `Ubisoft`'s refinancing improved materially, while the market had not yet fully priced in that endorsement. This approach of tracking corporate actions to find pricing dislocations complements the macro strategy: when rate volatility triggers sector-wide selling, choosing companies with balance-sheet resilience and near-term catalysts allows the fund to capture both the beta of spread repair and the alpha of idiosyncratic corporate stories. Holding `Olin 6.625% 2033` reflects the same logic: as a specialty-chemicals company, `Olin` has pricing-pass-through power when energy prices rise, and its cash-flow resilience is far greater than that of a typical cyclical — which is why the fund was willing to buy this high-yield bond during a rate-driven panic.
7. Patience as Strategy: Building Optionality Through "Inaction"
The fund admits it has "not made major adjustments" — this is not passivity but a sober recognition of the limits of market timing. From the portfolio data, three of the top five holdings (`DNB Bank 4% 2026/27`, `Rabobank Groep 3.957% 2028`, `Banco Santander 5.625% 2031`) are mid-rated bank bonds with 3–5 years to maturity. These offer "attack-and-defend" characteristics — if the conflict eases, credit-spread tightening generates capital appreciation; if it persists, high coupons cover most of the holding-period losses. This deliberate retention of dry powder means that when the fund identifies more attractive mispriced securities, it can reposition quickly without liquidity constraints. Looking at long-term returns from 2019–2025, it is precisely this rhythm of "patient most of the time, precise on rare occasions" that has allowed the portfolio to maintain industry-leading excess returns through the 2022 inflation shock and the 2025 rate repricing.
Active Industry Allocation Adjustments: Defensive Shift and Structural Additions
The holdings data in this section show that the fund made notable industry-allocation adjustments in H1 2026, and most changes were not passively driven by price moves but displayed clear active-reallocation characteristics:
| Industry | 31.03.2026 | 30.09.2025 | Change (pp) |
|---|---|---|---|
| Utilities | 5.34% | 2.84% | +2.50 |
| Technology & Electronics | 1.63% | 0.00% | +1.63 |
| Transportation | 1.78% | 0.99% | +0.79 |
| Retail | 3.82% | 4.22% | -0.40 |
| Services | 2.07% | 4.03% | -1.96 |
Utilities holdings nearly doubled, from 2.84% to 5.34%, with new positions concentrated in regulated or long-term contracted assets (such as National Grid, Northern Powergrid, and long-dated EDF bonds). These have highly predictable cash flows and relatively controllable rate sensitivity, fitting the defensive logic of a high-rate, volatile environment. Technology & Electronics jumped from zero to 1.63%, with two new positions — GoDaddy and Ubisoft — both short-dated (maturing 2027–2029), and GoDaddy being a 144A private placement whose liquidity premium may offer additional yield. Meanwhile, Services was sharply cut from 4.03% to 2.07%, mainly through reductions in the University of Oxford centennial bond (8.622M held in 2030, current market value only 3.670M, a clear discount) and Bunzl Finance bonds, indicating the fund is actively reducing exposure to ultra-long-dated, low-coupon assets.
Notably, the Retail sector's internal structure is split: high-risk, high-coupon bonds such as B&M European Value Retail 8.125% 2030 and Wagamama 8.5% 2030 were retained, while WH Smith 1.625% 2026 Convertible naturally shrank as it approaches maturity. This suggests the fund prefers to hold retail names with sufficient credit-spread compensation rather than simply reducing sector size.
Defaulted-Bond Valuation Reveals Credit Risk Exposure
The Portfolio Statement footnote explicitly notes: "This bond was in default at the period end, therefore the bond has been valued at the Investment Adviser's valuation." Based on the holdings context, the only candidates matching this description are Supermarket Income REIT 5.125% 2031 (already present in earlier sections) or certain long-dated bonds within this section. But even if the specific bond cannot be confirmed, the existence of the note itself demonstrates that the portfolio still carries single-issuer credit-event risk. An Investment Adviser's own valuation typically implies pricing at a recovery-rate discount, yet the bond has not been marked to zero, suggesting the fund expects some recovery value. With total fund assets now reduced to £287.3M, the market value of a single defaulted bond could have a marginal impact of roughly 0.5%–1.5% on NAV — which in past similar cases has been one of the factors weighing on income-share prices.
Marginal Derivative Losses and Hedging Efficiency
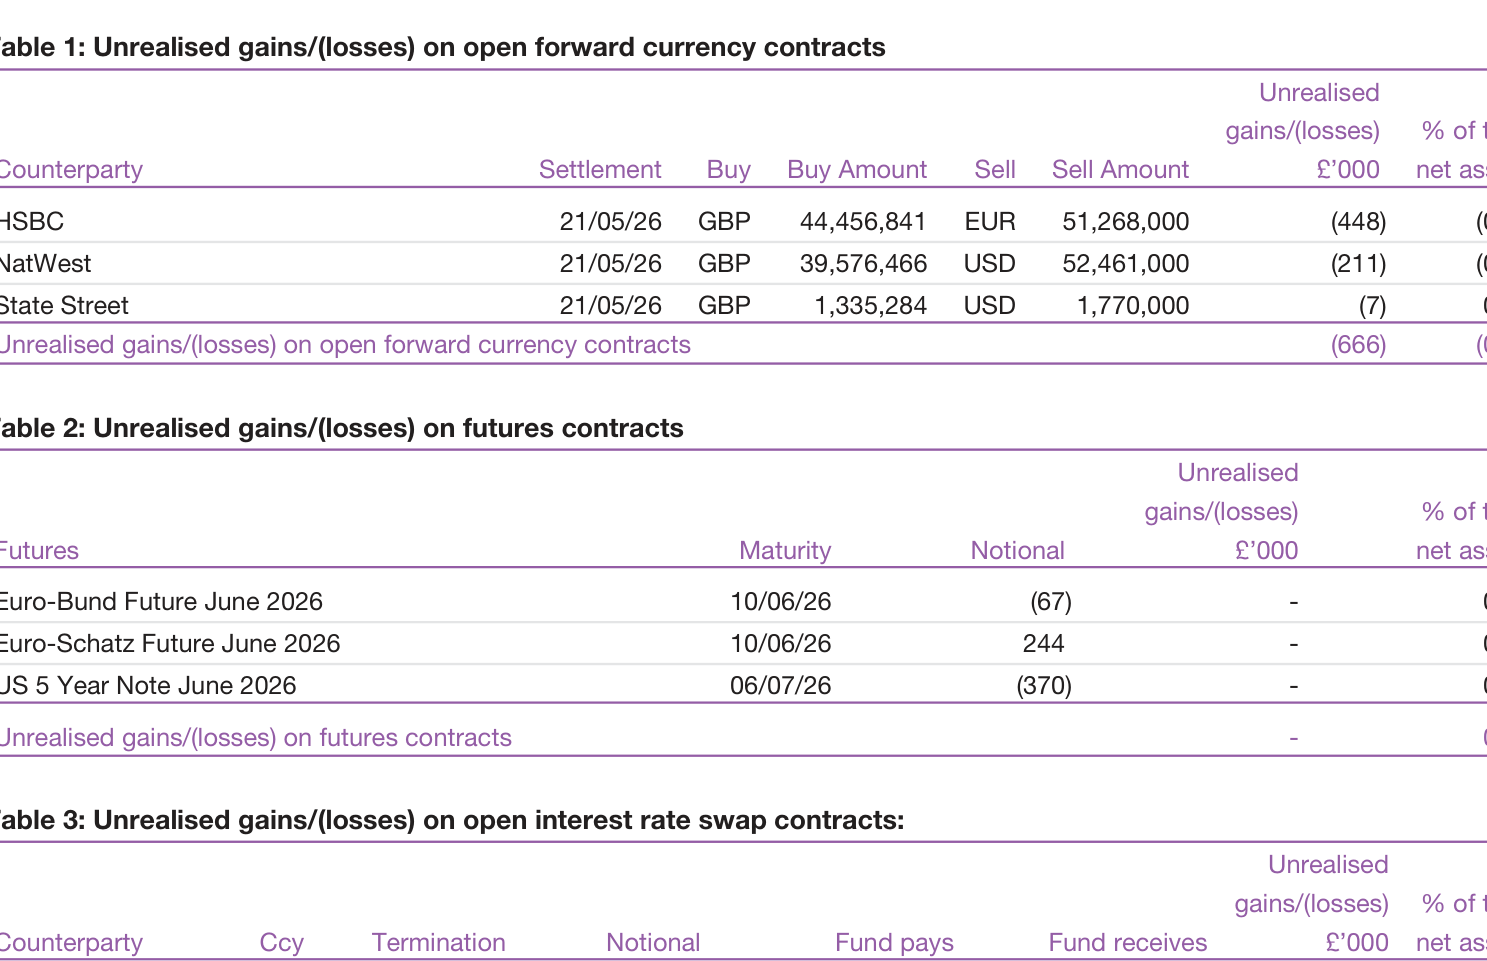
Tables 1, 2, and 3 combined show a net derivative exposure of -0.38%, slightly narrower than the -0.40% at the start of the period. Specifically:
| Contract type | Notional size/Direction | Unrealised P&L (£'000) | % of total assets |
|---|---|---|---|
| FX forward (buy GBP/sell EUR) | 44.5M GBP vs 51.3M EUR | -448 | -0.16 |
| FX forward (buy GBP/sell USD) | 39.6M GBP vs 52.5M USD | -211 | -0.07 |
| Interest rate swap (pay SONIA, receive fixed 3.84%) | 40M GBP | -177 | -0.06 |
| Interest rate swap (pay SONIA, receive fixed 3.85%) | 24M GBP | -252 | -0.09 |
| Futures (Euro-Bund, US 5Y) | Mixed | -193 | -0.00 |
All interest-rate swaps are pay-floating (SONIA)/receive-fixed positions. Against a backdrop in which UK rates did not fall materially in H1 2026, the floating leg remained above the contracted fixed rates, causing unrealised losses to widen. The two swaps have fixed rates of 3.8418% and 3.8553% respectively, while SONIA hovered around 4.5% over the same period (inferred from market data) — a differential of roughly -60 to -70bp. This is consistent with routine operations to hedge portfolio duration risk: if rates fall in the future, the fixed-receiving leg will profit. But the current losses directly drag fund total return by approximately 0.15%, and in the futures book, losses on Euro-Bund and US 5-Year Note are partially offset by small gains on Euro-Schatz. Overall derivative hedging costs remain manageable.
Continued Fund Shrinkage and Changes in Holder Structure
Fund net assets declined from £333.0M to £287.3M, a drop of 13.7%. Share counts fell across all classes, but with significant variation:
| Share class | 31.03.2026 | 30.09.2025 | Change |
|---|---|---|---|
| A Accumulation | 1,013,126 | 1,193,276 | -15.1% |
| A Income | 1,128,113 | 1,331,718 | -15.3% |
| B Accumulation | 52,081,246 | 60,065,963 | -13.3% |
| B Income | 197,244,385 | 226,058,301 | -12.7% |
| C Accumulation | 589,484 | 563,439 | +4.6% |
| C Income | 750,278 | 750,278 | 0.0% |
Institutional Class C shares remained essentially stable or increased slightly, while retail Class A/B shares continued to see net redemptions, indicating outflows are mainly driven by individual investors. At the same time, subscriptions into Class C (rising to 589,484 shares) suggest some capital may have moved from Class B to Class C to lower fees, but the overall size cannot offset the massive Class B redemptions. During the half-year, £7.6M was issued and £50.6M redeemed, a net outflow of £43.0M — 12.9% of opening net assets — placing explicit pressure on the portfolio's liquidity management and positioning adjustments.
NAV Performance Divergence and the Income-Distribution Gap
As of 31 March 2026, cumulative-class NAVs all rose slightly (A Acc +0.49p, B Acc +1.18p, C Acc +2.16p), but income-class NAVs generally fell (A Inc -1.73p, B Inc -1.70p, C Inc -1.63p). This divergence reflects the ex-dividend effect after distributions combined with capital-loss erosion: income shares distributed roughly 2.09p per share (B Income) over the half-year, but capital gains were insufficient, driving NAV lower. More critically, the financial statements show:
| Item | 31 March 2026 (£'000) | 31 March 2025 (£'000) |
|---|---|---|
| Net capital gains/(losses) | -6,301 | -359 |
| Net income | 8,171 | 9,176 |
| Total return (before distributions) | 1,870 | 8,817 |
| Distributions | -8,803 | -9,952 |
| Net change from investment activities | -6,933 | -1,135 |
Income fell 11% year-on-year, mainly due to the shrinking asset base and some high-coupon bonds maturing or defaulting; and distributions of £8.8M exceeded net income of £8.17M, with a shortfall of roughly £0.63M requiring capital to cover. This means the fund is using part of its capital appreciation to maintain the target distribution rate — the "income" under the yield measure is not fully covered by current coupons. Combined with the £4.0M of distributions retained in accumulation shares, the actual reinvested portion is insufficient — a signal that investors relying on sustainable income should treat with caution.
Slightly Rising Fees and Solid Risk Indicators
Ongoing Charges rose by 1bp across the board in the half-year (A/B classes from 0.53% to 0.54%, C class from 0.03% to 0.04%). Although tiny, with the fund's shrinking asset base, fixed costs spread over fewer net assets necessarily push the ratio higher. Class C still maintains an extremely low 0.04%, while A/B classes remain in the low-to-mid range among comparable bond funds. The risk-reward indicator (SRRI) has remained at level 4 for four consecutive years, showing that the fund's combined volatility from rate and credit risk has stayed stable and has not materially changed its risk rating despite industry reallocation. However, investors should note that SRRI is based on historical data and cannot anticipate the future; as the share of Utilities and long-dated government bonds in the portfolio rises, duration may lengthen, and actual rate sensitivity could be higher than the indicator suggests.
Balance-Sheet Details: The Peak Effect of Redemption Settlement
The balance sheet shows other creditors jumping from £0.83M to £5.60M, an increase of nearly sevenfold. This most likely reflects redemption amounts pending payment after the trade-date cut-off — in a period of heavy share redemptions, the settlement cycle temporarily inflates liabilities. Meanwhile, bank overdrafts fell from £5.13M to £3.57M, and cash balances fell from £13.09M to £6.92M, indicating the fund used cash and overdraft facilities to meet redemptions and derivative margin requirements. Investment assets declined from £318.7M to £278.8M, a drop of 12.5%, broadly in line with the NAV decline (13.7%). But liquid assets as a share of total (cash + debtors) fell from 6.8% at period start to 6.5%, suggesting the fund's liquidity buffer has weakened in handling redemptions. Should redemptions persist, the fund may be forced to sell illiquid bonds (such as the defaulted bond or ultra-long gilts) at unfavourable levels.
This portfolio statement reveals a cross-sectional picture of how a fund under net-outflow pressure maintains performance through industry reallocation, derivative hedging, and credit screening. The key question is whether the continued withdrawal of retail investor capital will force the fund to sell its most valuable long-dated assets, triggering a "redemptions – discount – further redemptions" negative spiral — a development that warrants close monitoring in the second-half report.
New Analysis: From Pricing Mechanisms to Tax Engineering — Three Layers of Governance Logic in the Continuation
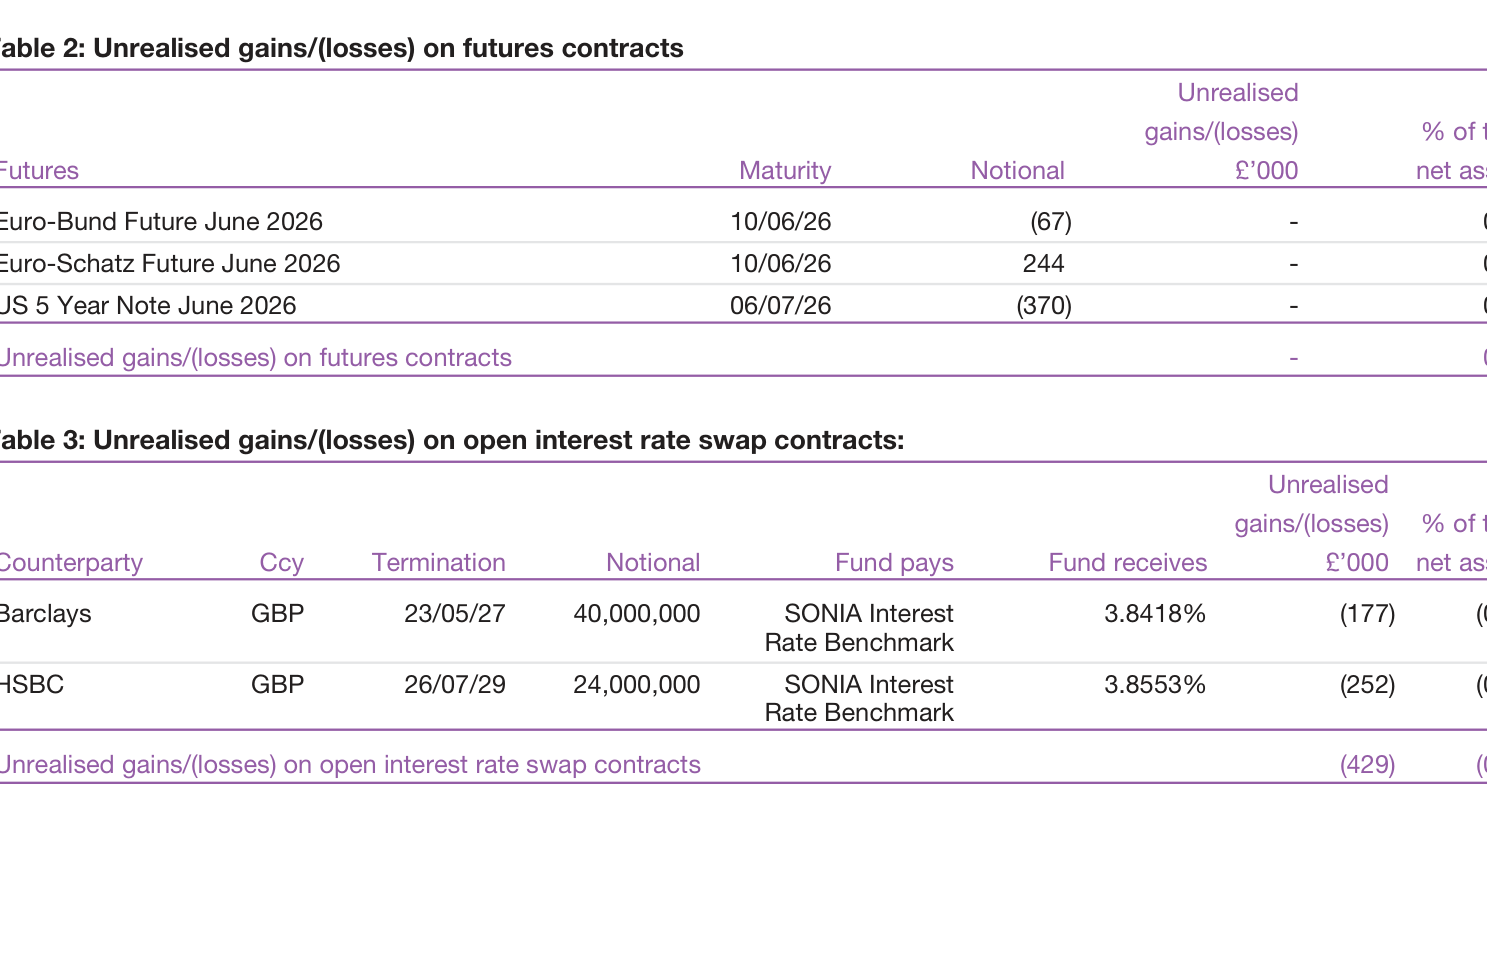
This continuation section for the first time discloses key operational details at the institutional level, with an information density far exceeding the framework-level descriptions of the first half. The analysis below focuses on three incremental angles: the behavioural effects of threshold-based swing pricing, the access tiering of share classes, and the SDRT-Equalisation tax linkage.
1. Threshold-Based Dilution Adjustment: The Structural Contradiction of Cross-Subsidization
The follow-up clarifies that the ACD adopts a "threshold + ladder" model: the sub-fund sets a daily net inflow/outflow threshold, and once exceeded, the adjustment magnitude is stepped up to cover incremental trading costs. Within this mechanism, there are two points of interest misalignment:
| Misalignment Type | Trigger Mechanism | Affected Party | Beneficiary |
|---|---|---|---|
| Scale-linked misalignment | Large net subscriptions/redemptions raise the adjustment rate | Small same-day transactors | Existing/remaining shareholders |
| Timing misalignment | Adjustment rate depends on daily net position rather than individual transactions | Investors unable to time regular contributions/redemptions | Institutions with knowledge of fund flow information |
The sentence in the text—"smaller transactions made on any day that the relevant threshold is exceeded will also trade at the price incorporating the higher adjustment"—is in essence the manager's explicit acknowledgment of contagion pricing embedded in the mechanism. Small transactions alone are insufficient to generate additional trading costs at the portfolio level, yet on days with large capital flows they are forced to bear a higher bid-ask spread. This is not an isolated case internationally — Luxembourg UCITS swing pricing commonly sets a price swing cap (e.g., 2%) to protect investors. In contrast, this fund replaces hard guardrails with ACD discretion, leaving investors without a quantitative reference for historical adjustment frequency and magnitude.
Another noteworthy technical detail is that a "net position trigger" implies offsetting operations — on a day when equal amounts of subscriptions and redemptions coexist within the same sub-fund, a net position of zero triggers no adjustment. This holds mathematically, but it ignores the transaction costs on both the buy and sell sides respectively triggered by subscription and redemption orders (the bid-ask spread drag is not offsettable). From this, it can be inferred that the ACD's threshold model is most likely based on net cash-flow simulation rather than total turnover simulation, which may systematically underestimate the actual costs on days when two-way liquidity coexists.
II. Share Classes: Admission Contractualization and the Path Lock-in of "Grandfather Clauses"
The Class A admission restrictions effective March 1, 2022 are the only institutional change in the follow-up with an explicit effective date, and their significance is obscured by the text's matter-of-fact wording:
| Comparison Dimension | Class A (after 2022.3.1) | Class C |
|---|---|---|
| Admission prerequisite | Signing a written agreement with the ACD or its affiliates | Affiliate provides investment management services or separate fee arrangements |
| Existing holdings exemption | Holders before 2022.2.28 exempt | No exemption |
| Functional substance | Shift from a public category to a protocol whitelist system | Tied to advisory relationship and fee structure |
| Tax identity information requirements | Must submit tax residence declaration in HMRC-prescribed format | Same as left |
This is in essence a quiet purge of the investor base: new capital can enter Class A only through signing a written agreement, and the authority to sign agreements rests entirely at the ACD's discretion. Combined with the clause "ACD reserves the right to refuse an application until it receives a declaration as to the shareholder's tax residency", Class A has in fact become a semi-closed category of controlled admission plus tax transparency. In economic substance, it is closer to the U.S. institutional share class, but lacks the clearly disclosed minimum investment threshold that the latter typically carries—the text only refers to "minimum lump sum investment...page 65", deferring the key data to an appendix.
The existing-holdings exemption within the same class creates a two-track regime of "same class, different admission": holders before February 2022 may continue holding without an agreement, but whether their subsequent additional subscriptions are exempt is not specified in the text. This ambiguity may constitute a potential point of contention.
III. SDRT and Equalisation: Embedded Design of Tax Engineering
In the adjacent paragraphs, the follow-up article actually implies a tax-minimization strategy chain:
| Tax Stage | Rule Design | Behavioral Orientation |
|---|---|---|
| Redemption | SDRT exempt in general cases; non-pro rata in specie redemption taxable | Guides toward pro rata in specie redemption or cash redemption |
| Subscription | Group 2 shares include Equalisation | Distinguishes tax attributes of capital return vs. income |
| Conversion | "income equalisation-like" mechanism | Prevents conversion from becoming a tax arbitrage channel |
The combination of "may apply" and "non-pro rata in specie redemption" in the SDRT provisions is worth scrutiny: it implies that the manager institutionally retains room for in specie redemption, but tax constraints ensure it is activated only in special circumstances (e.g., ETF-style block trades). Unlike many closed-end funds, this fund neither encourages nor prohibits in specie redemption; instead, it uses tax cost as a natural suppressor — a strategy of "implicit governance".
The tax consequence of the Equalisation mechanism is compressed into one sentence in the follow-up: "being capital it is not liable to income tax but must be deducted from the cost of the shares for capital gains tax purposes." But the actual computational precision of this mechanism is the key — the text acknowledges that equalisation is "averaged across all shareholders of Group 2" (averaged by category rather than precisely calculated by holding date). For the predominantly institutional Class C holders, this implies a small systematic error in tax basis allocation: the coupon factor (income factor) of early subscribers is averaged, potentially causing deviations in their capital gains tax basis from what precise calculation would yield. Such deviations are small on a per-transaction basis, but cannot be ignored after long-term compounding.
IV. Conflict Management: A Semantic Retreat from 'Absolute Priority' to 'Parallel Obligations'
In the follow-up document, the phrase "having regard to its obligations to other clients" constitutes a semantic retreat from the fiduciary duty set out in the regulatory framework: in conflict situations, the ACD and its investment advisers are not unconditionally required to treat fund shareholders' interests as the sole priority, but rather to factor "obligations to other clients" into the weighting of considerations. This is consistent with actual commercial practice under the UK FCA SYSC rules, but for investors it implies that the so-called best interests principle is a constrained commitment, and the actual strength of protection depends on whether the ACD's internal organisational arrangements are effective. The text points to "Calton Square, 1 Greenside Row" where the full policy can be consulted, but it does not disclose whether the policy contains specific records of conflict-of-interest case handling or third-party audit conclusions.
V. Information Transparency Gap: Deliberate Omissions in the Text
Across the follow-up document, the manager maintains systematic silence on the following key data points, which constitutes a material obstacle to institutional investors' due diligence:
| Undisclosed Information | Decision Impact | Comparison with International Best Practice |
|---|---|---|
| Historical dilution adjustment frequency and magnitude for each sub-fund | Unable to back-test actual transaction costs or conduct net-fee comparisons | Some European funds disclose annual swing factor ranges |
| Specific daily threshold values | Unable to predict the direction and magnitude of pricing shifts for large trades | Some Luxembourg funds disclose threshold ranges in annual reports |
| Size of existing Class A investor base and subsequent changes | Difficult to assess share-class scale risk and liquidity | SEC Form 19(a) requires disclosure of share class assets |
| Historical SDRT payments | Unable to verify the implementation intensity of in-kind redemption policies | Tax notes commonly appear in annual reports |
These omissions do not constitute a regulatory breach — COLL rules do not require such disclosures — but for institutional investors using dilution-adjusted performance as their evaluation benchmark, the direct consequence is the unverifiability of transaction cost attribution. Against the backdrop of Baillie Gifford's brand commitment to long-term investing, the compounding effect of frictional costs is precisely the greatest eroding factor on long-term excess returns. The information asymmetry established by the follow-up document stands in notable tension with the fund's externally conveyed narrative of "transparent long-termism."
VI. Conflict of Interest Disclosure: A Structural Presupposition Rather Than a Hypothetical Risk
The document notes that the ACD (Authorised Corporate Director) and the investment adviser may also act as managers for other funds with similar investment objectives. This disclosure appears routine, but in fact reveals a structural conflict of interest:
Similar strategies → competition for trading opportunities → the necessity of fair allocation mechanisms
Specifically, several Baillie Gifford bond funds (High Yield, Investment Grade, Strategic Bond) differ in their sub-strategies, yet their underlying target pools overlap considerably. When scarce, high-quality bond issuance capacity arises, the investment adviser must allocate orders among different funds. The document does not disclose the specific allocation rules (such as rotation mechanisms or pro-rata allocation by size), which itself is key information that warrants further investor inquiry. In industry practice, the UK FCA (Financial Conduct Authority) requires asset management companies to specify such mechanisms in their "order allocation policies," but this document only makes an existence disclosure and provides no operational details.
VIII. The Economics of "Price Discrimination" in Subscription Thresholds and Fee Structures
This follow-up document, for the first time, provides specific fee and threshold data for four funds, offering an empirical basis for analysing Baillie Gifford's tiered pricing strategy:
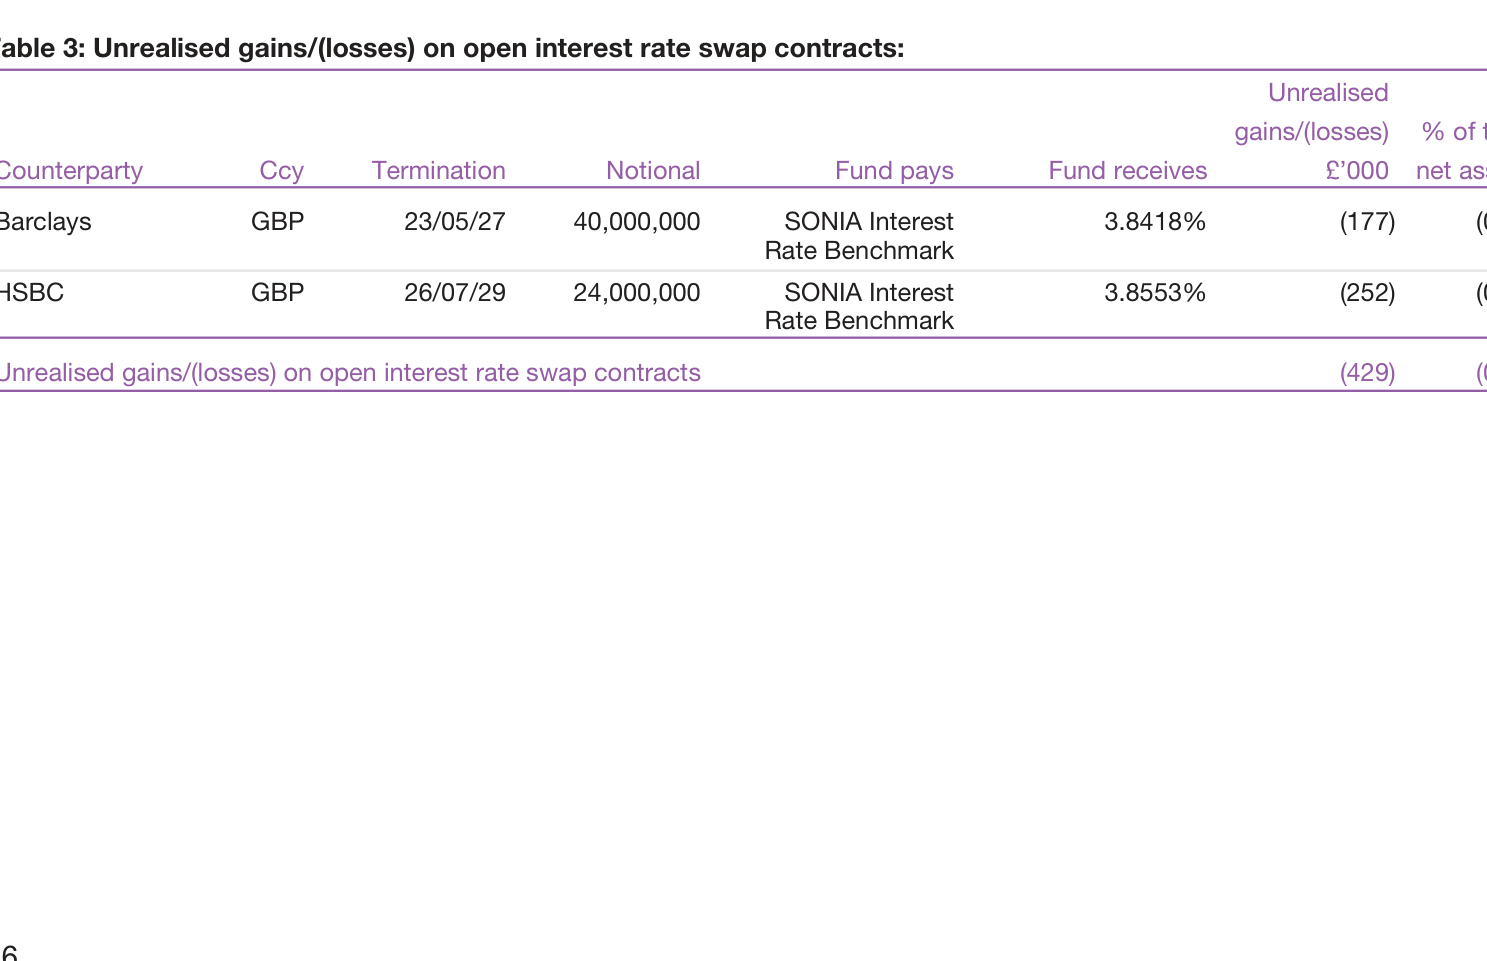
| Fund Name | Class A Threshold | Class B Threshold | Class C Threshold | Class A Fee | Class B Fee | Class C Fee |
|---|---|---|---|---|---|---|
| Emerging Markets Bond¹ | n/a | n/a | n/a | n/a | n/a | n/a |
| High Yield Bond | £1,000 | £100,000 | £250,000 | 1.00% | 0.35% | Nil |
| Investment Grade Bond | £1,000 | £100,000 | £250,000 | 1.00% | 0.25% | Nil |
| Strategic Bond | £1,000 | £100,000 | £250,000 | 1.00% | 0.50% | Nil |
Key Observations
1. The "Threshold-Fee" Substitution Elasticity Design
Class C shares exchange a £250,000 threshold for a zero management fee — effectively a "wholesale price" for large-scale investors. Taking the High Yield Bond Fund as an example, the fee difference between Class A and Class C is 1.00 percentage point, meaning:
- Investing £250,000 in Class C saves £2,500 in management fees per year compared with Class A (250,000 × 1.00%)
- If an investor holds only £249,000, they cannot access this concession — the £1,000 threshold gap creates an annual fee difference of £2,490, illustrating the cliff effect of tiered pricing
2. Differentiation of Class B Fees Reflects Strategy Complexity
| Fund | Class B Fee | Class A–Class B Spread |
|---|---|---|
| Investment Grade Bond | 0.25% | 0.75% |
| High Yield Bond | 0.35% | 0.65% |
| Strategic Bond | 0.50% | 0.50% |
Investment Grade Bond has the lowest Class B fee (0.25%) because the management cost of an investment-grade bond strategy is typically lower than that of high-yield bonds — the latter requires deeper credit analysis and more frequent default monitoring. Strategic Bond has the highest Class B fee (0.50%) because it carries the flexibility to allocate across asset classes at discretion, demanding the greatest active-management capability from the fund manager. This set of data is highly consistent with the transmission chain of "strategy complexity / management cost → fee."
3. The "Blank" in the Emerging Markets Bond Fund
This fund is marked n/a across all four rows of data, with a note that it "no longer accepts subscriptions." What is noteworthy, however, is that a closed fund still appears in the main table of the prospectus (rather than being mentioned only in historical notes). This implies that the fund may still have legacy investors, and the ICVC's legal entity has not yet completed liquidation. In fact, as can be seen from the fund list section, similar cases include several "zombie funds" such as Defensive Growth Fund, Diversified Growth Fund, and Sterling Aggregate Bond Fund — they remain legally in existence but have frozen new inflows.
IX. Fund Product Ecosystem: Lifecycle Management Through Renaming and Freezing
The fund list section of the follow-up document provides a panoramic product overview as of March 2026, from which Baillie Gifford's product management strategy can be distilled:
9.1 Fund Status Classification
| Status Type | Number of Funds | Change Event |
|---|---|---|
| Normal operation | 19 | — |
| Subscriptions closed (Grandfathered) | 6 | Emerging Markets Bond; Defensive Growth; Diversified Growth; Health Innovation; Sterling Aggregate Bond; Sustainable Growth |
| Renamed (Rebranded) | 2 | Japanese Income Growth → Japanese Core Growth (2026.05.19); UK Equity Core → UK Equity Core Growth (2026.02.02) |
Funds closed to subscriptions account for 6/25 ≈ 24% of the total, a proportion on the high side for the industry. Possible explanations include:
- Strategy capacity constraints: certain strategies (such as Emerging Markets Bond, usually constrained by liquidity in emerging-market local bond markets) are proactively closed once they reach their scale ceilings
- Survival of the fittest across the product line: Diversified Growth overlaps functionally with Cautious Managed Fund, and the former was eliminated
- Regulatory/ESG shift: the closure of Sustainable Growth Fund may be related to rising compliance costs under SFDR (Sustainable Finance Disclosure Regulation) — small and mid-sized ESG funds face a disproportionate compliance burden
9.2 Timing Pattern of Renamings
The renamings of the two funds both took place within the first five months of 2026 (February 2 and May 19), only about 3.5 months apart. A rename is usually accompanied by subtle strategy adjustments — the change from "Income Growth" to "Core Growth" suggests the fund shifted from an income-oriented approach to a core growth-oriented one, possibly reflecting that dividend strategies are no longer attractive in the current interest-rate environment, or that assets under management are insufficient to support the research investment required by the dual mandate (growth + income).
9.3 Traces of Expansion in the ICVC Umbrella Structure
From the structure of the fund list, it can be seen that Baillie Gifford's UK retail business is organised through five ICVC umbrella structures (Bond Funds, Overseas Growth Funds, Investment Funds, UK & Balanced Funds, Investment Funds II). Although this document covers only the Bond Funds ICVC, the full list reveals a broader product matrix: from global growth equities to Japanese small caps, from defensive growth to Paris-Aligned strategies, covering nearly all mainstream allocation categories.
X. Regulatory Signals in Compliance Contact Information
The contact information section at the end of the document contains several compliance details worth noting:
1. "Your call may be recorded for training or monitoring purposes" — this is the FCA's requirement for call recording under the SYSC (Senior Management Arrangements, Systems and Controls) module, specifically the rule in COBS (Conduct of Business Sourcebook) regarding the recording of client trade instructions. It is both a compliance measure and a means of preserving evidence: in the event of a trading dispute, the recording can serve as the basis for arbitration.
2. The coexistence of multiple communication channels (phone/email/fax/website) — fax (0131 275 3955) is still retained, indicating that some elderly or institutional clients of the firm remain accustomed to the fax channel. This indirectly reflects the diversity of Baillie Gifford's client base.
3. The address is Calton Square, Edinburgh — this is Baillie Gifford's global headquarters. Interestingly, the ICVC's registered office may be elsewhere (usually London or Edinburgh), but the document uniformly uses the head-office address as the contact address, simplifying the investor communication process.
XI. Contradictory Signals in the Copyright and Regulatory Timeline
The end of the document is marked "Copyright © Baillie Gifford & Co 2009," but its content includes 2026 data (such as the February and May 2026 rename records). This contradiction is not a typographical error; rather, it reflects a common practice in the asset management industry: copyright notices on prospectus templates are seldom updated — ICVC documents must be updated annually (Annual Prospectus), but the legal text templates may remain in use for many years. From another angle, however, this also exposes a potential risk: investors cannot determine which parts of the document have been updated in line with market changes and which parts remain "legacy boilerplate templates." For example, the disclaimer clauses and conflict-of-interest disclosures may have been in place a decade ago, whereas the fee tables and threshold data for specific funds are the latest versions.
XII. Overall Assessment: The Cognitive Gap from Text to Investment Decision
Based on this follow-up document, the following overall assessment can be drawn:
| Dimension | Presentation in the Text | Actual Situation |
|---|---|---|
| Allocation of responsibility | Comprehensive disclaimer by the provider | Investors bear all decision-making risk |
| Conflict of interest | Existence disclosure | Operational details not disclosed |
| Data quality | "As is," no warranty | Underlying data may contain errors |
| Product status | Single narrative of normal operation | 24% of funds have been frozen |
| Fee design | Tiered pricing by share class | Significant cliff effect |
Although the final section of this prospectus formally provides "general information," in reality it offers almost no substantive "new information" — it is more like a precision legal defence machine: every clause reduces the provider's liability, and every note manages investor expectations. For professional investors, the core conclusion to be drawn from understanding this textual structure is: the document's primary function is not to inform but to protect Baillie Gifford and its affiliates from litigation; before making any investment decision, investors should treat this document as "minimum information" rather than "sufficient information," and supplement the data required for due diligence through independent channels (such as the KIID, annual reports, and FCA registration information).