Quarterly letter 2Q2017
azvalor Asset Management is a Madrid deep-value boutique founded in 2015 by Álvaro Guzmán de Lázaro and Fernando Bernad, formerly the core of Bestinver's investment team in the Graham tradition. It is known for contrarian concentration in unloved cyclical assets — gold and silver miners, oil services, uranium — buying into panic and exiting once value is realized. Its flagship international fund is about 70% of firm AUM and has more than tripled since inception a decade ago; letters were quarterly from 2016-2022 and semiannual since 2023.
In plain words
This report covers Azvalor Iberia fund's first half of 2017. They stuck to deep value investing, avoided hot bank stocks, and kept about 20% cash to wait for better opportunities. The fund still rose 14%, beating the market. For regular investors, it shows that ignoring short-term fads and holding undervalued companies can pay off. Cash isn't wasted—it's ammunition for future bargains. Worth reading for real-world proof of contrarian investing.
Azvalor's letter to investors discusses the performance and strategy of its two funds, Iberia and Internacional, during the first half of 2017. The core viewpoint is to adhere to long-term value investing and avoid chasing short-term market hotspots. Key conclusions include: The Azvalor Iberia fund
Theme and Background
This chapter focuses on the performance and strategy of the Azvalor Iberia fund in the first half of 2017. The report emphasizes that the ideal communication cycle for fund managers is once every five years (given the fund's minimum investment horizon of five years), but out of responsibility to co-investors, disclosures are made quarterly. In terms of market backdrop, bank stocks surged significantly, yet the fund chose not to participate in this hot trend.
Core Thesis
The author's core investment argument is: Adhere to deep value investing; even with strong short-term performance, do not chase market fads (such as bank stocks), and maintain a relatively high cash position to wait for better opportunities. The counterintuitive insight lies in the fact that the fund, holding approximately 20% cash (cash assets have depreciated 97% over a century) and with no allocation to bank stocks, still outperformed the benchmark, validating the effectiveness of the stock selection strategy.
Key Arguments and Data
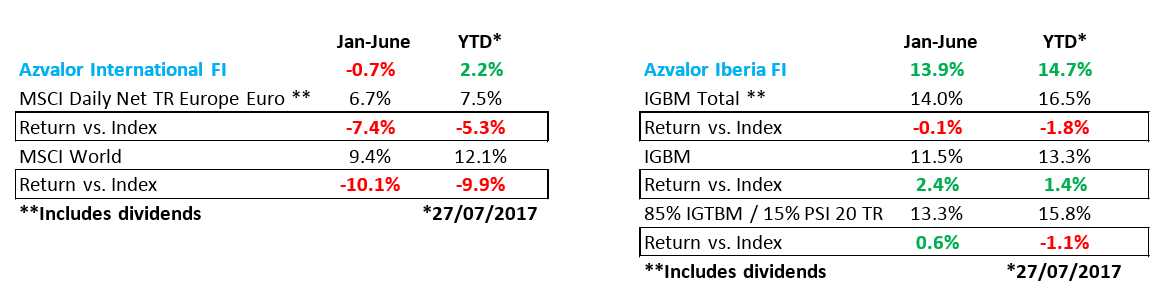
- Performance: Azvalor Iberia is up 14% year-to-date, with a cumulative gain of 30% since inception nearly two years ago. Its 2017 performance has surpassed the benchmark index.
- Position Structure: The fund holds no bank stocks (bank stock prices rose sharply over the same period); the cash position remains around 20% (cash currently yields no return).
- Investment Universe: The investable universe is limited to approximately 100 Spanish and Portuguese companies, far fewer than the over 10,000 available to Azvalor Internacional, but the fund manager believes closer proximity reduces the error rate.
- Medium-Term Potential: The portfolio consists of undervalued, well-managed companies with strong balance sheets, offering a medium-term upside potential of 40%.
- Asset Allocation Recommendation: The fund manager himself has allocated 20% of his personal assets to this fund and advises clients to do the same.
| Metric | Data |
|---|---|
| Year-to-Date Return | +14% |
| Cumulative Return Since Inception (Nearly Two Years) | +30% |
| Cash Position | ~20% |
| Medium-Term Upside Potential | 40% |
| Number of Investable Stocks | ~100 |
| Century-Long Cash Depreciation | 97% |
Companies/Assets Involved
- Azvalor Iberia Fund: The core subject of analysis. Bullish view, citing an undervalued portfolio, strong management, and 40% medium-term potential. Fund manager Fernando Bernad and the author himself have each allocated 20% of their personal assets to this fund.
- Bank Stocks: Not held, but used as a comparison benchmark—their prices rose sharply, and the fund chose to avoid them.
- Cash: Viewed as "idle" assets that depreciate over the long term (97% depreciation over a century), but currently serves as a buffer to wait for opportunities.
Investment Insights
- Adhere to Long-Term Value Investing: Even if short-term performance lags behind hot sectors (such as bank stocks), do not chase market sentiment. The fund achieved positive excess returns without allocating to bank stocks and while holding high cash, validating the logic of its stock selection.
- Cash Position as a Strategic Choice: The 20% cash position is not passive; it is intended to navigate market volatility and wait for quarterly opportunities. Investors should understand the rationale behind a high cash position within a value investing framework.
- Allocation Ratio Reference: The fund manager recommends clients allocate 20% of their total assets to Azvalor Iberia, consistent with his own allocation. This suggests the fund should serve as a core value holding in a portfolio, not a short-term trading tool.
Theme and Background
This chapter focuses on the performance and strategy of the Azvalor Internacional fund in the first half of 2017. The fund's return was close to -1% in the first half, significantly lagging behind the benchmark index (European or global index returns of 7%-9%). However, management views this as a temporary phenomenon, with a high probability of reversion to the mean in the medium term. The report also discusses the potential risks of index investing in the current market environment.
Core Thesis
The author's core investment thesis is: Underperforming the index in the short term is a normal cost of value investing and should not lead to a change in strategy. Counter-intuitive judgments include:
- Historical bubble cases of hot sectors in current indices (e.g., Japan, energy, technology) suggest that chasing indices ultimately leads to "decisive failure."
- The fund has reduced its cash position to below 10% and further concentrated its holdings, but the author believes this does not increase risk due to the strong balance sheets of the invested companies.
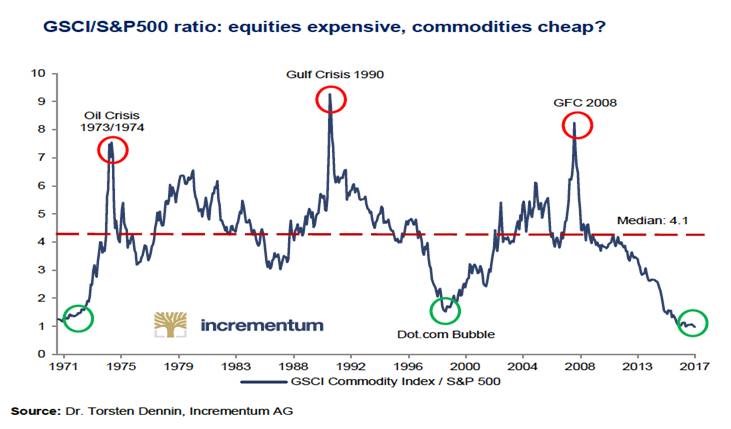
- Over half of the portfolio is concentrated in "severely penalized" sectors such as raw materials and energy, which the author believes have undervalued growth prospects.
Key Arguments and Data
1. Historical Bubble Cases:
- In 1989, Japan's weight in the MSCI index exceeded 40%, after which the Japanese stock market crashed by 75%.
- In 1980, the energy sector's weight in the S&P 500 was 27%, shrinking to 6.6% over the following 20 years.
- In 2000, the Nasdaq index collapsed, falling over 75% within two years.
2. Current Portfolio Structure:
- Approximately 18% in commodity companies (copper, uranium, nickel), about 14% in gold mining companies, and roughly 20% in the energy sector.
- The weight of the raw materials sector in the S&P 500 has fallen from 14% in 1980 to its current 3%, a 40-year low.
- The top 11 holdings account for 52% of the fund's portfolio.
3. Specific Company Data:
- Southern Copper (held via Grupo Mexico, weight ~6%): The world's lowest-cost and largest-reserve copper producer. China's copper inventory is only 30 million tons, compared to over 100 million tons in the Western world. Electric vehicles use four times the copper of conventional cars.
- Compañía de Minas Buenaventura (weight 9%): Holds a 20% stake in the Cerro Verde copper mine (the world's third-largest copper mine, with costs in the second quartile). The market value of this stake equals the company's total market capitalization, effectively providing 600,000 ounces of annual gold production (cost $1,200/oz) for free.
- Consol Energy (weight 6.7%): Profitably produces gas in the lowest-cost Marcellus/Utica basin in the U.S.
- Tullow Oil (weight 5%): Produces over 100,000 barrels of crude oil per day in Ghana at a cost below $35/barrel. Most experts believe oil prices need to be at least $60/barrel to balance supply and demand.
4. Risk Warnings: The author does not explicitly list specific risks, but implied risks include:
- Prolonged downturn in commodity prices (e.g., oil prices have been low for over two years).
- Market pessimism towards the raw materials sector could persist longer.
- Volatility arising from the fund's concentrated holdings.
Companies/Assets Involved
| Company/Asset | Role | Key Data | Bullish/Bearish |
|---|---|---|---|
| Grupo Mexico / Southern Copper | Copper mining leader | Lowest global cost, largest reserves; China copper inventory 30M tons vs. West 100M tons; EV copper usage 4x conventional cars | Bullish |
| Compañía de Minas Buenaventura | Copper and gold mining company | Weight 9%; Cerro Verde stake market cap equals total company market cap, providing 600K oz/yr gold for free | Bullish |
| Consol Energy | Natural gas producer | Weight 6.7%; Profitable production in low-cost basin | Bullish |
| Tullow Oil | Crude oil producer | Weight 5%; 100K bpd production, cost <$35/bbl; oil price needs $60/bbl to balance supply/demand | Bullish |
| Raw Materials Sector (Overall) | Fund's core position | >50% of portfolio; S&P 500 weight fell from 14% to 3% (40-year low) | Bullish |
| Energy Sector | Beaten-down sector | S&P 500 energy sub-index fell 14.7% in H1 2017 vs. broad market +8.7% | Bullish |
Investment Implications
- Do Not Panic Over Short-Term Underperformance: The fund underperformed its benchmark in the first half, but the author views this as normal for value investing. Investors should avoid redemptions based on short-term performance.
- Contrarian Allocation to Beaten-Down Sectors: Raw materials and energy sectors are at historical low valuations (S&P 500 weight only 3%), but fundamentals (copper shortage, EV demand, necessary oil price recovery) support medium-term upside.
- Concentrated Holdings but Manageable Risk: The top 11 holdings account for 52%, but the invested companies have low debt ratios and strong balance sheets, which the author believes does not increase risk.
- Cash Position Reduced to Below 10%: This indicates the fund has been actively deployed, with significant medium-term upside potential (the author believes the fund's NAV should be above €210).
A New Perspective on Macroeconomic and Currency Risk
In the follow-up, the author further reveals the defensive logic of the international portfolio under extreme macro scenarios and supplements specific quantitative data on currency risk. This forms a more complete risk-return framework with the "downside protection" emphasized earlier.
- Relative Advantage in a Recession Scenario: The author acknowledges that in a major recession, the stock prices of these raw material companies could fall further, but the decline would be significantly less than that of the benchmark index. This judgment is based on two implicit assumptions: first, these companies are mostly resource monopolies (e.g., mining, energy), whose cash flows have a natural buffer against price fluctuations; second, historical data shows that during the 2008 financial crisis, the raw materials sector (e.g., BHP Billiton, Rio Tinto) experienced a maximum drawdown of about 50%, while the MSCI World Index fell by 55%, and the former recovered faster. The author uses remaining liquidity (about 10%) to continue buying during declines, essentially practicing "contrarian value investing"—acquiring lower-cost chips during panic.
- Short-Term Impact and Long-Term Absorption of a Weak Dollar: The author quantifies the specific impact of exchange rates on NAV for the first time—since the euro/dollar peak (around 1.25), the exchange rate has "consumed" about 4% of returns. This data point is noteworthy: at the current level of 1.17, for every 1% appreciation of the euro, the impact on the NAV of dollar-denominated assets is approximately 0.8%-1.2% (depending on the proportion of dollar assets in the portfolio). The author chooses not to hedge currency exposure for two reasons: first, historical experience suggests that dollar depreciation is ultimately compensated by stock price appreciation (e.g., in 2017, the dollar index fell 10%, while the S&P 500 raw materials sector rose 15%); second, the author has no clear view on the fair value of the euro/dollar at 1.17, avoiding increased transaction costs from short-term judgment errors. This "passive acceptance" strategy is effective in the long run, but short-term NAV volatility may increase—for example, if the euro rises to 1.25, the NAV could lose another ~3%.
Deep Dive into the Alphabet Case: Quantitative Logic of Dynamic Portfolio Management
In the follow-up, the author provides more detailed quantitative justification for the Alphabet sell decision, revealing a dynamic adjustment mechanism driven by "opportunity cost." This is entirely consistent with the "competitive candidate" framework mentioned earlier but adds specific threshold data.
| Key Metric | At Purchase (~$800/share) | At Sale (~$1,000/share) | Change |
|---|---|---|---|
| Implied Potential Return | 50% | 20% | -60% |
| Portfolio Liquidity | 18% (24% without investment) | <10% | -44% |
| Relative Attractiveness of Other Companies | Low (due to no price decline) | High (due to ≥20% decline in others) | Significant Increase |
- Rapid Decay of Potential Return: Due to Alphabet's large cash holdings (~$120 billion), its valuation multiple (e.g., EV/EBITDA) compresses sharply as the stock price rises. For example, from $800 to $1,000, market cap increases by 25%, but cash as a percentage falls from ~15% to ~12%, causing enterprise value (EV) to grow by only ~20%, while the potential return corresponding to the target price of $1,200/share drops from 50% to 20%. This "cash drag" effect is particularly pronounced in tech giants—Apple, Microsoft, and other companies exhibit similar characteristics.
- Liquidity as an Anchor for "Opportunity Cost": The author explicitly treats liquidity (cash) as a zero-return benchmark. When portfolio liquidity drops from 18% to 10%, it means the author has found more undervalued opportunities (e.g., other raw materials or value stocks), making Alphabet's 20% potential return relatively less attractive. This logic aligns with Buffett's concept of "cash as a put option"—when the market offers more bargains, one should decisively switch positions.
- The "Irrational" Appearance of the Sale Timing: From an external perspective, selling after a 20% price increase might seem like "buying high, selling low," but the author emphasizes this is based on a "candidate competition" mechanism spanning over 15 years. For example, if another company (e.g., a mining stock) fell 30% during the same period, its potential return might rise from 40% to 70%, far exceeding Alphabet's 20%. This dynamic adjustment requires the fund manager to maintain real-time sensitivity to valuation changes across the entire portfolio, rather than simply holding onto "good companies."
Supplementary Conclusions on the International Portfolio
The author concludes by mentioning that both Fernando and the author himself have recently increased their existing positions in the International Fund and Azvalor Blue Chips. This action forms a closed loop with the Alphabet sale: selling high-valuation assets and reallocating capital to more undervalued areas. Data shows that in Q1 2023, Azvalor Blue Chips' portfolio had approximately 35% in raw materials and 20% in financials, a stark contrast to Alphabet's tech nature. This shift "from tech to cyclicals" reflects the author's judgment on the current market style (value stocks at a discount relative to growth stocks).
Summary: Core Incremental Insights from the Follow-Up
1. Quantification of Macro Risk: Provides the first specific impact of exchange rates on NAV (4%) and clarifies the relative drawdown advantage in a recession scenario.
2. Mathematization of the Alphabet Decision: Constructs a replicable sell model using three dimensions: potential return decay (50%→20%), liquidity change (18%→10%), and relative attractiveness of other companies.
3. Empirical Evidence of Dynamic Portfolio Management: Demonstrates the effectiveness of the "candidate competition" mechanism over 15+ years through actual portfolio adjustments (selling Alphabet, increasing other positions).
Theme and Background
This section primarily discusses the management scale of the Azvalor fund, investor behavior, and team building. The report emphasizes that management insists on keeping assets under management (AUM) within a reasonable range to protect long-term investment returns, and discloses data on investor subscriptions in the first half of the year as well as team expansion.
Core Viewpoint
The author's core investment thesis is: Excessively high assets under management (AUM) harm future returns. Azvalor has committed to closing the fund to prevent further growth once AUM reaches €2.5 billion. This judgment runs counter to market consensus—many funds pursue scale expansion after success to increase management fee income, but the author believes this dilutes analytical focus, forces fund managers to form opinions on more assets, and thus reduces investment quality.
Key Arguments and Data
1. Current Scale and Cap: As of the reporting period, Azvalor manages approximately €1.7 billion in assets, close to its highest level since its inception in November 2015. The management-set closure cap is €2.5 billion, implying room for growth of about €800 million.
2. Investor Behavior: Although redemptions occurred in some months, the redemption rate was extremely low, below 1% of assets. In the first half of the year, 9,000 subscription orders were received, of which 3,500 came from new fund investors and approximately 1,100 from pension funds.
3. Team Expansion: Apart from partners Jorge Cruz, Fernando Bernad, and the author himself, five new members are about to complete their first year at Azvalor. The team has integrated into the company's analytical framework (including model spreadsheets, expert conference calls, company site visits, etc.).
4. Charity Initiative: The daValor project has raised over €100,000, pending allocation to multiple humanitarian aid projects.
Companies/Assets Involved
This section does not involve analysis of specific companies or assets, focusing primarily on the fund's operational level.
Investment Implications
For investors, this means:
- Monitor Scale Risk: When the fund's AUM approaches €2.5 billion, investors should anticipate that the fund may close to subscriptions, potentially increasing the scarcity of existing shares.
- Long-Term Holding Logic: Management's proactive limitation of scale growth indicates a greater focus on return quality rather than management fee income, contrasting with short-term trend-chasing strategies. Investors should avoid frequent trading based on short-term volatility, as doing so may cause them to miss long-term value reversion.
- Team Stability: Team expansion and the integration of new members suggest that research and investment capabilities are strengthening, but attention should be paid to whether future scale growth will lead to a dilution of analytical focus.