Quarterly letter 1Q2017
azvalor Asset Management is a Madrid deep-value boutique founded in 2015 by Álvaro Guzmán de Lázaro and Fernando Bernad, formerly the core of Bestinver's investment team in the Graham tradition. It is known for contrarian concentration in unloved cyclical assets — gold and silver miners, oil services, uranium — buying into panic and exiting once value is realized. Its flagship international fund is about 70% of firm AUM and has more than tripled since inception a decade ago; letters were quarterly from 2016-2022 and semiannual since 2023.
In plain words
This letter covers three things: the fund made money in Q1 but lagged the market, which they say is normal for their five-year horizon; they warn that passive index funds beating active funds may signal a bubble, as history shows indexes often crash afterward; and they keep 15-20% cash, which hurts returns but lets them buy cheap. For regular investors: don't focus on short-term performance, be wary of index highs, and cash can be smart.
Azvalor's letter to investors discusses the long-term performance comparison between active management and passive investing. The core argument is that the current outperformance of passive index funds over active management is not a "new paradigm" but rather the fourth occurrence in the past 50 yea
Theme and Background
This chapter is the opening section of Azvalor’s letter to investors. It primarily outlines the firm’s investment philosophy and communication principles, and reports the fund’s performance for the first quarter of 2023. The author emphasizes a five-year investment horizon but, out of responsibility to co-investors, reports results on a quarterly basis. The fund achieved positive absolute returns in the first quarter but underperformed its benchmark index.
Core Views
- Long-Term Investment Perspective: The author explicitly sets a minimum five-year investment horizon, acknowledging that quarterly reporting is not ideal but is maintained for transparency.
- Relative Underperformance: Although the fund generated positive returns in the first quarter (“we have made money”), it lagged behind the benchmark (“others have made more than us”). The author does not defend or explain this underperformance, merely stating the facts.
Key Arguments and Data
| Metric | Data |
|---|---|
| Absolute return in Q1 | Positive (specific figure not disclosed) |
| Relative performance vs. benchmark | Below benchmark (specific gap not disclosed) |
- The author does not provide specific return percentages, only qualitative descriptions of “positive absolute returns” and “below the benchmarks.”
- Actual investor returns depend on the net asset value (NAV) at the time of subscription, implying that returns vary for investors entering at different points.
Companies/Assets Involved
This chapter does not mention any specific companies, industries, or assets. The content is entirely focused on the fund’s own performance reporting and investment philosophy.
Investment Insights
- Short-Term Performance Noise: Underperforming the benchmark in a single quarter is neither a bearish nor bullish signal in itself, consistent with normal fluctuations under the firm’s long-term investment framework.
- Value of Transparency: The author’s proactive disclosure of relative underperformance demonstrates a commitment to investor communication, which helps build trust. However, investors must independently assess the long-term effectiveness of this strategy.
- Focus on Long-Term Performance: Given the five-year investment horizon, single-quarter relative performance should not be used as a decision-making basis. Investors should wait for longer time windows (e.g., three or five years) of performance data to evaluate the fund’s true capability.
Theme and Background
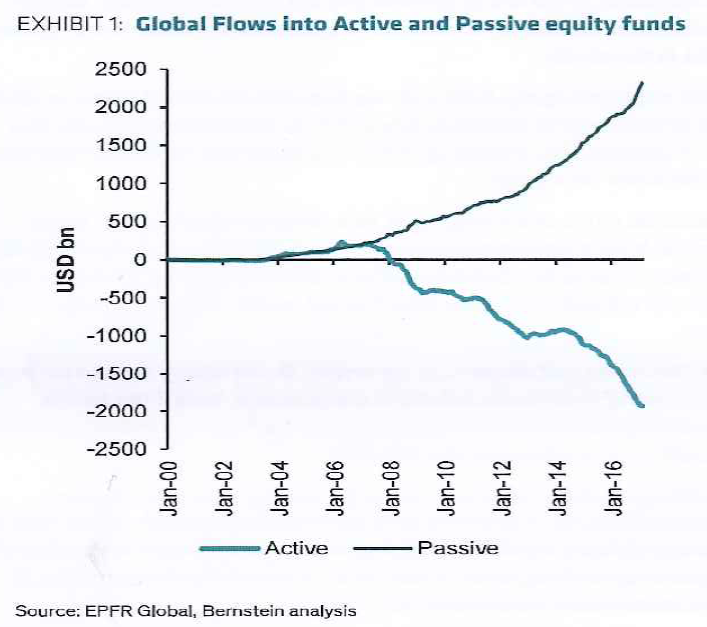
This chapter delves into whether the current phenomenon of passive index funds outperforming active management funds represents a "new paradigm" or signals a market bubble. The author questions this widely accepted trend and attempts to find answers from historical data, analyzing its sustainability and practical implications for investors.
Core Thesis
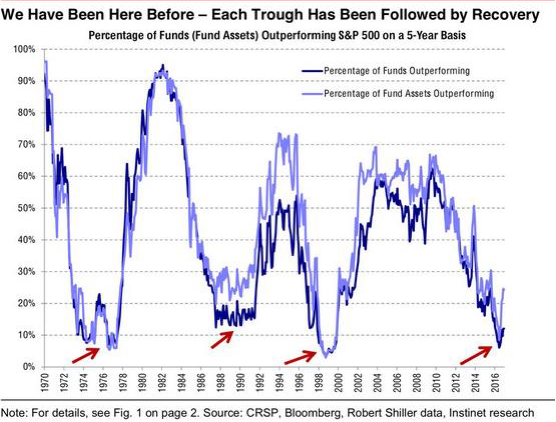
The author's core judgment is that the current outperformance of passive investing over active management is not a "new paradigm" but merely the fourth occurrence in the past 50 years, and historically, such trends do not persist for long. The author argues that when index performance becomes extreme (e.g., 1999), it often foreshadows a market bubble, after which the index may crash. Therefore, at current elevated valuations, investing in indices is not the optimal choice, while active management funds may generate excess returns during bear markets.
Key Arguments and Data
The author supports the thesis with historical data and counterintuitive phenomena:
1. Historical Cycle Comparison: Data shows that the current period is one of only four in the past 50 years where the benchmark index has outperformed active management funds. Historically, such extreme divergence does not last long, and when it reaches current levels, the index often subsequently collapses (as indicated by the 1999 arrow).
2. Counterintuitive Risks of Passive Products:
- The "Spain ETF" Irony: Investors buy ETFs tracking the Spanish index, but the actual "domestic sales in Spain" of the index constituents are very low, meaning investors are not truly "betting on Spain."
- Liquidity Mismatch: The liquidity of the ETF itself may be higher than that of its underlying assets. During market panics, this structure could lead to "dramatic" consequences for holders.
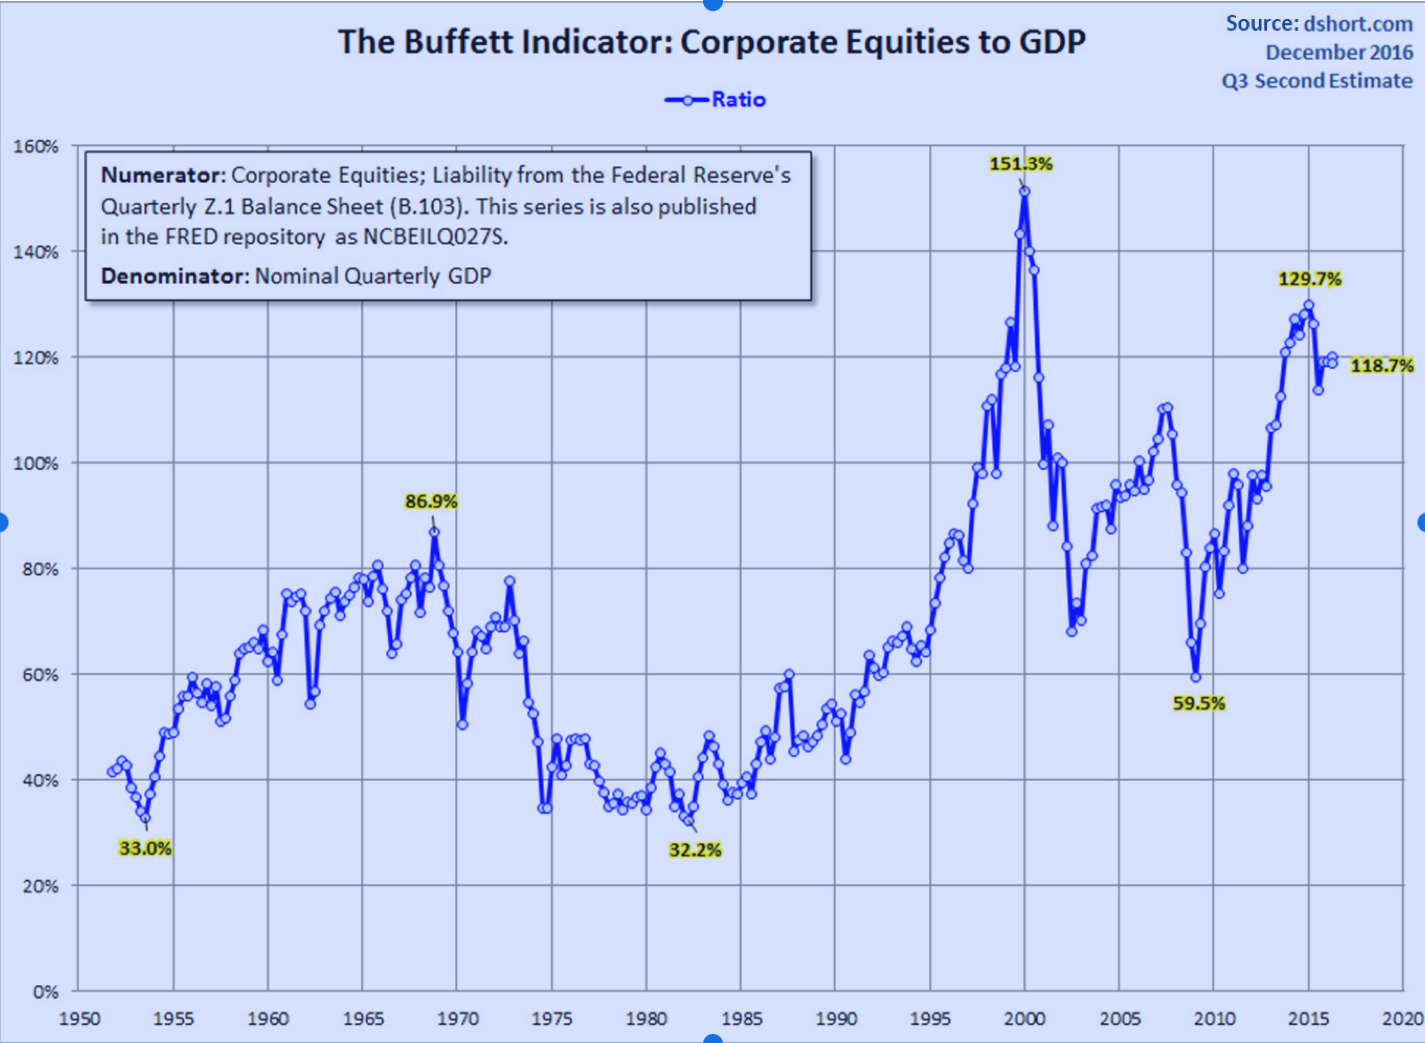
3. Elevated Market Valuations: Using Warren Buffett's preferred metric (market cap/GDP), current market valuations are at the upper end of the historical range over the past 70 years. The author believes that the Fed's money creation and artificially low interest rates have fueled investment optimism, explaining the high stock prices.
Comparative Data: Active vs. Passive Fund Performance
| Metric | Data |
|---|---|
| Proportion of European equity funds beating benchmark over past 10 years | Only 9% |
| Positioning of the current period in history | 4th time in 50 years benchmark outperforms active management |
| Historical precedent (e.g., 1999) | Index subsequently crashed, but active management funds (e.g., Azvalor) still generated excellent returns |
Companies/Assets Involved
- Alphabet (Google): The author explains the rationale for buying in detail, as a case study of active stock selection.
- Buying Thesis: Capitalizing on analyst skepticism regarding the Q1 earnings report, the author bought at an EV/EBITDA of less than 9x, only 10% above the all-time low from 2008. At the time, the stock price had only doubled from 2007 levels, but profits had grown ninefold.
- Competitive Advantages: Brand, services, scale, network effects, and technological advantages, with near-monopolies in search, video, and operating systems.
- Risk and Reward: The author sees 50% upside potential and limited downside risk (as cash represents 30% of market cap). However, the author admits it is impossible to predict the shape of the internet in 20 years, merely assuming Alphabet will remain dominant and larger within 5 years.
- Bullish: The author is explicitly bullish and has established a position.
Investment Implications
1. Beware of the "Bubble" Risk in Passive Investing: The current consensus that passive products are winning big may itself be a signal that the market is overvalued and a bubble is about to burst. Investors should avoid blindly chasing index gains at elevated valuations.
2. Opportunities for Active Management in Bear Markets: History shows that when the index crashes (e.g., 2000), excellent active management funds can instead generate strong returns. Currently, 66% of Azvalor's portfolio positions are priced below their 2011 levels, and the portfolio's P/E ratio is only 10x (vs. over 20x for the S&P 500), providing a margin of safety.
3. Seek Out "Forgotten" Sectors: The author suggests focusing on sectors and regions that are not in the index and are overlooked by the market. These areas contain a large number of low-P/E stocks, some of which are high-quality companies that have entered buy zones.
4. Key Elements for Active Stock Selection: To outperform the index, one needs: ① A company vision based on deep analysis that differs from the consensus; ② The fortitude to stick with convictions under pressure; ③ The humility to admit mistakes and exit.
Theme and Background
This section discusses the strategic logic behind Azvalor Fund maintaining a relatively high cash position (liquidity), as well as the fund’s recent philanthropic activities. The author argues that the “explicit cost” (return drag) of holding cash is accompanied by an “implicit advantage”—the flexibility to seize opportunities amid market uncertainty.
Core Views
- Maintaining a 15%-20% cash position is a strategic choice for actively managed funds, not a passive mistake. The author acknowledges that if the fund had been fully invested since inception, cumulative returns (approximately 20%) would have been higher. However, the cash reserve gives the fund the flexibility to act decisively in uncertain environments.
- Contrarian judgment: While the current market generally favors full or high exposure, the author believes that cash is the “default option,” and it is held only when stocks lack a sufficient margin of safety. This patient approach to waiting for opportunities aligns with top fund managers who have consistently outperformed the market over the long term, such as Warren Buffett and Seth Klarman—both of whom currently hold higher cash ratios than ever before.
Key Arguments and Data
| Argument | Data/Fact |
|---|---|
| “Explicit cost” of cash position | Cumulative return since inception is approximately 20%; would have been higher if fully invested |
| Cash strategy of top fund managers | Warren Buffett, Seth Klarman, Tweedy Browne, Southeastern Asset Management (all with 40-year records of outperforming the market) currently hold higher cash ratios than ever before |
| “Implicit advantage” of cash position | Provides the fund with flexibility to seize opportunities amid uncertainty; the fund has conducted in-depth research on a large number of companies and only needs to wait for stock prices to fall into the buying range before acting |
Companies/Assets Involved
- Azvalor (itself): Maintains a 15%-20% cash position, viewing it as a strategic advantage for active management.
- Warren Buffett, Seth Klarman, Tweedy Browne, Southeastern Asset Management: As benchmarks for long-term market outperformance, they currently hold higher cash ratios than in the past, supporting the rationale behind Azvalor’s strategy.
Investment Insights
- Investors should reassess the value of cash positions. In extreme market environments (such as bubbles or panics), funds holding cash are more flexible than fully invested funds, enabling them to buy high-quality assets at lower prices.
- Do not be misled by short-term return differences. A fully invested strategy may appear advantageous in a bull market, but the “margin of safety” and “opportunity cost” provided by cash positions may lead to better risk-adjusted returns over the long term.
- Focus on fund managers’ “implicit capabilities.” The ability to conduct in-depth research on companies and wait for the right entry price is the core of active management’s excess returns, and cash positions are a manifestation of this capability.