TCFD Report: Product-Level
Hosking Partners is a London boutique founded in 2013 by Jeremy Hosking, a portfolio manager at Marathon Asset Management for over 25 years. It runs a single global equity strategy built on the capital-cycle, supply-side approach — contrarian, long-term, and unusually diversified (350+ holdings) under a multi-counsellor model, managing around $5.5bn.
In plain words
This report from Hosking Partners shares their fund’s 2025 carbon data. They avoid complex climate models like CVaR (a risk measure) and temperature-alignment (predicting warming), preferring to analyze each company individually. Their data shows direct emissions (Scope 1 & 2) slightly down, but supply-chain emissions (Scope 3) up nearly 8%, with patchy coverage that may hide the real impact. They argue many climate models oversimplify reality. For ordinary investors, the takeaway: don’t blindly trust fancy models; instead, look at what companies actually do, and watch out for incomplete data.
Hosking Partners released its 2025–2026 TCFD report, covering carbon emission metrics for the Hosking Global Fund portfolio. The data show that in 2025, Scope 1 financed emissions amounted to 706,441 tons (YoY –1.34%), Scope 2 to 196,154 tons (–0.80%), and Scope 3 to 6,137,216 tons (+7.69%). The car
Theme and Background
This section discusses the carbon emissions data and climate risk analysis methodology for the Hosking Global Fund portfolio over the 2024-2025 period. The market context is increasingly stringent ESG data disclosure requirements, but Hosking Partners explicitly opposes the use of Climate Value-at-Risk (CVaR) and temperature alignment models, arguing that such top-down quantitative tools lack practical analytical value.
Core Argument
The author's core investment thesis is: Rejection of CVaR and temperature alignment models in favor of case-by-case qualitative analysis. The report argues that models applying a single carbon price fail to reflect real-world variations in valuation, geography, or industry, and also ignore the reflexive responses of management, regulators, and investors. This is a contrarian view relative to the market consensus — most peers provide CVaR and temperature alignment data to meet regulatory expectations, but Hosking believes this information is meaningless for investment decisions.
Key Arguments and Data
- Carbon emissions data (2024 vs 2025): Scope 1 financed emissions fell 1.34%, Scope 2 fell 0.80%, but Scope 3 rose 7.69%. Weighted average carbon intensity (Scope 1+2) increased 25.43% year-on-year to 217 tonnes/$M revenue, with data coverage rising from 83% to 91%.
- Data coverage changes: Scope 3 data coverage fell from 84% to 75%, which may explain the significant increase in Scope 3 emissions.
- Limitations of scenario analysis: 43.52% of the portfolio's holdings are classified by NGFS as "highly affected" sectors (e.g., cement), but the report stresses that scenario analysis can only capture a narrow range of possibilities and does not reflect the impact on future profits and returns on capital.
Comparative data presented in tables:
| Metric | 2024 | 2025 | YoY Change |
|---|---|---|---|
| Scope 1 Financed Emissions (tCO2e) | 716,064 | 706,441 | -1.34% |
| Scope 2 Financed Emissions (tCO2e) | 197,729 | 196,154 | -0.80% |
| Scope 3 Financed Emissions (tCO2e) | 5,698,930 | 6,137,216 | +7.69% |
| Carbon Footprint Scope 1+2 (tCO2e/$M) | 130 | 130 | 0.00% |
| Weighted Avg Carbon Intensity Scope 1+2 (tCO2e/$M Revenue) | 173 | 217 | +25.43% |
| Weighted Avg Carbon Intensity Scope 3 (tCO2e/$M Revenue) | 1,271 | 1,167 | -8.18% |
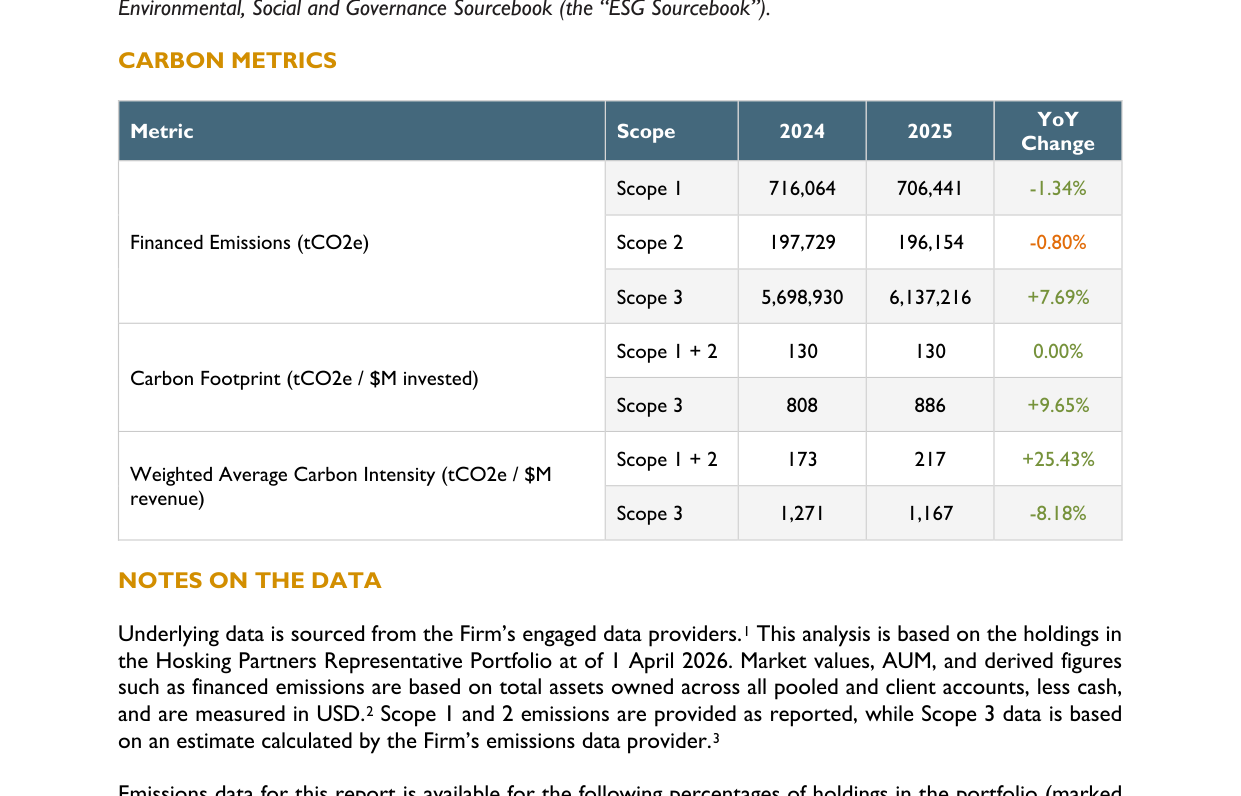
Scope 3 financed emissions increased 7.69% year-on-year to 6.137 million tonnes; weighted average carbon intensity Scope 1+2 rose 25.43% year-on-year to 217 tCO2e/$M revenue
| Data Type | 2024 Coverage | 2025 Coverage |
|---|---|---|
| Scope 1 | 83% | 91% |
| Scope 2 | 83% | 91% |
| Scope 3 | 84% | 75% |
Companies/Assets Involved
- Hosking Global Fund: The portfolio itself is the subject of analysis. The report does not name specific holdings, but notes that 43.52% of the portfolio is in sectors defined by NGFS as "highly affected" (e.g., cement, oil, etc.). The report uses "cement production" as an example to illustrate scenario analysis models — under the Below 2°C scenario, demand is projected to fall 25% by 2035; under Current Policies, demand grows 3%.
Investment Implications
- Reject reliance on quantitative climate risk models: Investors should not blindly follow CVaR or temperature alignment data; these metrics may mislead decisions. Hosking's approach implies that real climate risk should be assessed by understanding individual company management responses.
- Focus on Scope 3 data quality: Scope 3 coverage fell 7 percentage points (from 84% to 75%), while emissions grew 7.69%. This reminds investors to pay attention to data integrity issues — low coverage may lead to systematic underestimation of emissions.
- Limited usefulness of scenario analysis: Scenario analysis should only be used for transparency disclosure, not as a core basis for portfolio allocation. Investors should focus on company-level capital cycles and profit prospects, rather than macro-scenario demand changes.
Scenario Comparison of Quantified Demand Shifts
Based on the follow-up data, the demand changes for the carbon-exposed portion of the portfolio by 2050 relative to the NDC baseline are as follows:
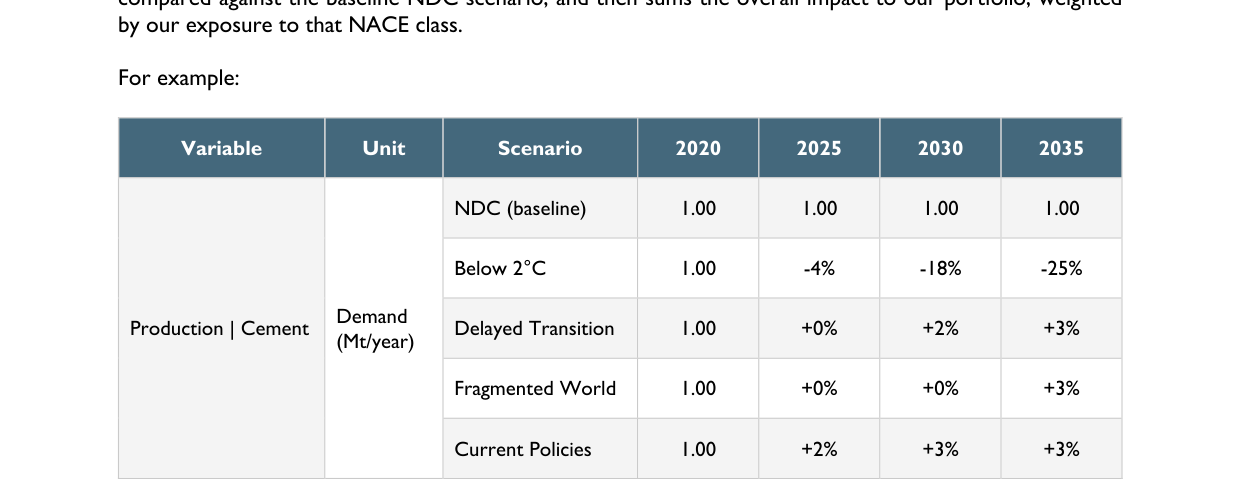
Under the Below 2°C scenario, cement demand is projected to fall 4% in 2025, 18% in 2030, and 25% in 2035, while under Current Policies demand remains broadly flat
| Scenario | Demand Change (vs NDC Baseline) | Implied Probability (Equal Weight Assumption) |
|---|---|---|
| Fragmented World | Approx. +4% | High (if portfolio "aligned") |
| Delayed Transition | Approx. +2% | Medium-High |
| Current Policies | Approx. 0% (flat) | Medium |
| Below 2°C | Approx. -5% | Low (weakest portfolio alignment) |
Key Observation: Although the magnitude of demand shifts is small (within ±5%), the direction divergence is clear. The positive pull from the Fragmented World and Delayed Transition scenarios implies that the current portfolio implicitly favors a "slow decarbonization" or "geopolitical fragmentation" path, which contradicts the global coordinated emissions reduction assumption underlying the NDC baseline. Meanwhile, the significant downside in the Below 2°C scenario (-5%) exposes the portfolio's vulnerability under aggressive climate policies — if the probability of this scenario rises, the portfolio would face roughly a 5% underlying demand shock, a magnitude sufficient to affect relative performance in long-term equity portfolios.
Structural Flaws in Scenario Analysis: Beyond Acknowledged Limitations
The follow-up explicitly acknowledges limitations (missing baseline probabilities, unequal scenario probabilities, fiduciary duty conflicts, coverage limited to 43.52% of holdings) which require further dissection:
1. Baseline Probability Black Hole: The NDC as the "priced-in" baseline assumes a probability of 100%, but the reliability of national commitments is questionable. For example, as of 2025, implementation progress of most major economies' NDCs lags behind their pledges (the UNFCCC 2024 progress report shows a global 2030 emissions reduction gap of approximately 23 Gt CO₂e). If the actual probability of NDC implementation is below 50%, then all "alignment" analyses relative to the NDC lose their benchmark meaning.
2. Asymmetry of Scenario Probabilities: NGFS scenarios are model-based but do not assign probability weights. If the portfolio is "aligned" with Fragmented World (+4%), but that scenario's true probability is only 20%, then the portfolio's actual expected demand change would be: 0.2×(+4%) + 0.3×(+2%) + 0.3×0% + 0.2×(-5%) = +0.3%, far below the optimistic level implied by simple alignment. Any unweighted scenario analysis can amplify cognitive biases.
3. Numerical Inconsistency in Coverage: The original text claims the modeling scope covers only 43.52% of holdings, but then states "the remaining approximately 70% is unmodeled" — these two figures sum over 100%, revealing confusion in the calculation logic. A possible explanation is that 43.52% is the share of positions by number of holdings (count of companies), while 70% is by market value (or vice versa). Regardless of definition, the unmodeled portion constitutes the absolute majority, making the overall portfolio's climate risk profile unknowable. If the unmodeled portion (e.g., financials, technology, healthcare) is as sensitive to the energy transition as carbon-intensive sectors, the reliability of scenario analysis conclusions is severely compromised.
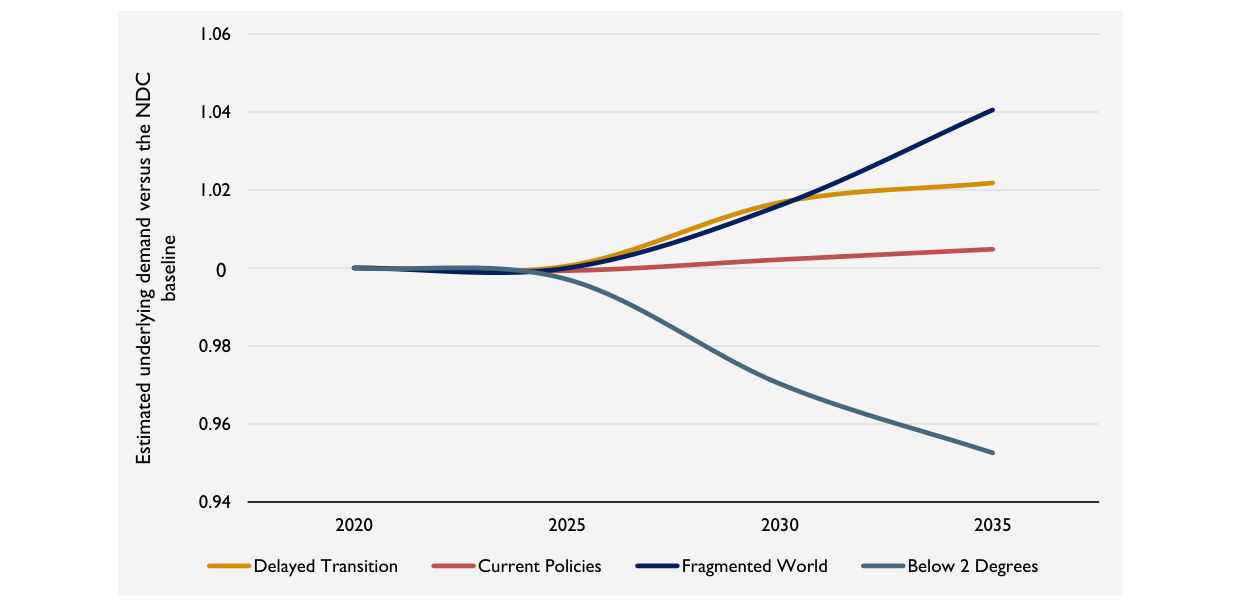
By 2035, demand in the Fragmented World scenario grows approximately 4%, Delayed Transition grows 2%, Current Policies is flat, and Below 2°C falls approximately 5%
Hidden Costs of the Qualitative Investment Approach
Hosking Partners emphasizes building a "multi-pathway to success" portfolio through bottom-up qualitative analysis, thereby avoiding the pitfalls of quantitative scenario analysis. However, this approach has three unaddressed shortcomings:
- Lack of Causal Inference: Qualitative analysis excels at identifying company-specific traits but struggles to probabilize tail risks from macro climate pathways. For example, an oil company may win due to "low-emission technology breakthroughs," but the probability of that breakthrough itself cannot be derived from qualitative judgment alone; it still requires quantitative scenario inputs.
- Portfolio Concentration Risk: "Multi-pathway to success" may mask sector-level concentration. The follow-up does not disclose the specific distribution within the NGFS "significant impact" sector (43.52%); if sectors such as energy and materials are overweight, even if individual companies are excellent, macro demand declines would systematically erode returns.
- Transparency and Verifiability: The output of the qualitative process is difficult to audit externally or backtest, whereas scenario analysis at least provides falsifiable assumptions. The follow-up offers no historical success cases or attribution data for qualitative stock selection, leaving the claim of "superiority to quantitative models" lacking empirical support.
Summary Data Comparison
| Dimension | Quantitative Scenario Analysis (This Text) | Qualitative Investment Approach (Hosking) |
|---|---|---|
| Coverage | 43.52% of holdings (with inconsistency) | 100% of portfolio |
| Risk Measurement | Demand shift ±5% (limited scenarios) | Implicit (unquantified) |
| Probability Treatment | Unweighted, baseline probability = 1 | Subjective probability (undisclosed) |
| Replicability | High (NGFS models public) | Low (proprietary judgment) |
| Fiduciary Duty Compatibility | Potentially conflicting | Claimed compatible |
This comparison shows that both methods have blind spots. For portfolios seeking long-term diversification, the greatest danger is not choosing between quantitative or qualitative, but unilateral reliance on either method while ignoring its limitations — and the follow-up precisely fails to provide such self-critical perspective.