Ferrari
Worldly Partners is a research-intensive, ultra-concentrated investment partnership founded by Arvind Navaratnam in 2020 near Boston, applying a Munger-style multi-decade approach. It is known for deep business-history studies of long-term compounders like IKEA, Mars, and TSMC.
In plain words
This report shows that Ferrari isn't just a fast car—it's been a money-making machine for over 50 years. Since Fiat bought half of it for $6.9 million in 1969, the company's value has grown to over $67 billion, delivering an 18% annual return—far better than the S&P 500. The secret? Ferrari deliberately limits production (only about 13,600 cars a year), uses Formula 1 technology in its road cars, and lets customers spend heavily on custom features. This creates scarcity and high profits. For ordinary investors, the takeaway is that top luxury brands can compound wealth over decades, but high valuations mean future growth may slow.
The report analyzes Ferrari N.V.'s exceptional investment performance and long-term valuation growth since its IPO in 2015. The core thesis is that Ferrari has achieved sustained excess returns through a fusion of world-class racing engineering, extreme high performance, and highly personalized, art
Theme and Background
This chapter systematically demonstrates Ferrari’s evidence as a long-term superior investment by comparing its historical stock return performance since its IPO in 2015 with its valuation growth trajectory since its acquisition by Fiat in 1969. The report aims to reveal that Ferrari, leveraging its unique brand positioning and engineering capabilities, has consistently generated excess returns far above the broader market, with value creation spanning both the private and public stages.
Core Argument
The report’s central thesis is that Ferrari has evolved from a small racing car manufacturer into a global top luxury brand, with investment returns consistently and significantly outperforming the S&P 500 Index across multiple time periods. A counterintuitive insight is that even if an investor had bought at a very low base valuation in 1969 (approximately $6.9 million) and held until February 2026, the annualized return would still be approximately 18%, demonstrating that the brand value has exhibited strong compounding effects from its inception, rather than being merely a post-IPO capital market story.
Key Arguments and Data
The report presents Ferrari’s investment return data across four dimensions—short term (2 years), medium term (3 years, 5 years), long term (full post-IPO period), and ultra-long term (private + public phase since 1969)—through two key tables. All comparative data are shown in the tables below.
Table 1: Ferrari vs. S&P 500 – Total Return and Annualized Return Comparison
| Holding Period | Ferrari Total Return | S&P 500 Total Return | Ferrari Annualized Return | S&P 500 Annualized Return |
|---|---|---|---|---|
| 2 years (to Oct 2017) | 113% | 33% | 46.0% | 15.4% |
| 3 years (to Oct 2018) | 118% | 46% | 29.7% | 13.4% |
| 5 years (to Oct 2020) | 261% | 88% | 29.3% | 13.5% |
| Since IPO (to Feb 2026) | 647% | 308% | 21.4% | 14.5% |
Table 2: Historical Growth Trajectory of Ferrari’s Market Cap (1969–2026)
| Time Point | Valuation (USD millions) | Cumulative Growth Multiple Since 1969 | Annualized Return Since 1969 |
|---|---|---|---|
| 1969 (Fiat acquires 50%) | $6.9 | - | - |
| 1988 (Fiat increases to 90%) | $192 | 28x | 19% |
| 2015 (IPO) | $9,824 | 1,428x | 17% |
| February 2026 | $67,352 | 9,790x | 18% |
Companies/Assets Involved
This report primarily analyzes a single asset: Ferrari N.V.. All historical valuation data revolve around its equity value. The report mentions Fiat’s role as Ferrari’s historical majority shareholder since 1969, whose acquisition and gradual stake increase have provided early benchmarks for Ferrari’s value growth. The report holds a clearly bullish stance on Ferrari.
Investment Implications
For investors, the data imply:
- The compounding effect of holding a top luxury asset over long periods is remarkable. Ferrari’s nearly 10,000x growth reveals that over a cycle spanning more than half a century, a scarce brand’s value-creation ability can outperform most industries, with an 18% annualized return far exceeding inflation and general stock indices.
- Post-IPO valuation was not excessive. Although the IPO valuation had already reached $9.8 billion, the stock still delivered an annualized return of 21.4% in the public market thereafter, proving that its strong profitability and growth prospects were undervalued by the market.
- Focus on brand moat. Ferrari’s success stems not merely from car manufacturing but from a deep moat built through the commercialization of F1 technology,极致 personalized craftsmanship, and顶级 marketing. Investors should focus on its ability to maintain scarcity and high pricing power, rather than short-term volume changes.

Theme and Background
This chapter traces two pivotal transactions in the evolution of Ferrari’s equity structure (Fiat’s acquisition of a 50% stake in 1969 and Fiat’s acquisition of the remaining 40% stake in 1988), revealing the underlying logic behind its long-term valuation appreciation. The author aims to demonstrate that Ferrari, as a company combining racing engineering, high performance, and artisanal hand-crafting capabilities, has achieved remarkable compounded growth in its commercial value over a multi-decade historical span.
Core Thesis
The author argues that Ferrari’s leapfrog growth in valuation (9,790x cumulative from 1969 to 2026, with an annualized return of 18%) is no accident but is driven by its unique business model:
1. Efficient transformation of F1 technology: Technologies validated in the extreme conditions of the racetrack (e.g., KERS hybrid systems, carbon fiber lightweighting, paddle shifters) are rapidly transferred to road cars, creating a technological moat. The new car development cycle is only about 40 months, roughly 20% shorter than the industry average of 48–54 months, enabling a faster response to technological changes and customer preferences.
2. Extreme personalization and high margins: Personalized customization (average price uplift of 15%, Tailor Made program can command 20%–100% uplift) contributes roughly 20% of revenue increments and carries even higher gross margins. This serves both as an economic lever and reinforces brand scarcity.
3. High vertical integration and focus: Key performance components (e.g., engines) are consistently developed and produced in-house, avoiding brand dilution from outsourcing. Meanwhile, the company’s strategy concentrates on high-performance luxury sports cars, resisting the temptation to expand into mass-market segments or excessive product diversification.
Key Arguments and Data
- Historical valuation validation: In 1969, Fiat acquired 50% of Ferrari for approximately $3.44 million, implying an overall valuation of about $6.9 million; in 1988, Fiat acquired the remaining 40% for about $77 million, implying an overall valuation of $192.5 million ($77m / 0.4). As of February 2026, Ferrari’s market capitalization stood at $67.352 billion.
- R&D intensity comparison: Historically, Ferrari’s R&D spending has been about 19% of revenue (trending down in recent years as revenue grew), while peer automakers have significantly lower R&D ratios:
| Company | R&D as % of Revenue | Notes |
|---|---|---|
| Ferrari | ~19% (trending down) | Core capability, source of technological leadership |
| Aston Martin | ~1% | Average since 2018 listing |
| Mercedes, BMW, Porsche | Mid-to-high single-digit % | High-volume luxury brands |
- Development efficiency comparison:
| Company Type | New Car Development Cycle (months) | Source |
|---|---|---|
| Ferrari | ~40 (new) / ~33 (facelift) | IPO filing |
| Traditional OEMs (industry average) | 48–54 | Bain & Company 2025 report |
- Brand marketing effect: F1 racing enjoys enormous global reach: television audience of ~425 million in 2014 (the year before Ferrari’s IPO); by 2026, more than 800 million fans and cumulative viewership of about 1.6 billion. F1 itself carries the bulk of Ferrari’s brand advertising function and is designed to be roughly break-even.
- Personalization’s contribution to revenue: In 2020, personalization contributed approximately 20% of revenue from the Cars and Spare Parts segment (which accounts for 82% of total revenue), with higher profit margins.
Companies/Assets Involved
- Ferrari: Core subject of the analysis. Defined as a company that deeply integrates F1 technology, high performance, and artistic craftsmanship, characterized by high R&D intensity, high vertical integration, and high customization capability. Bullish.
- Fiat: Ferrari’s historical major shareholder. Acquired 50% of Ferrari for ~$3.44 million in 1969; acquired the remaining 40% for ~$77 million in 1988. These transaction figures serve as historical anchors for the valuation analysis in this report.
- Aston Martin: Benchmarking peer. Its R&D spending ratio (~1%) is significantly lower than Ferrari’s, reflecting a different competitive strategy. No explicit bullish/bearish stance.
- Mercedes-Benz, BMW, Porsche: Benchmarking peers. Their R&D spending is in the mid-to-high single-digit percentage range, a clear gap vs. Ferrari. No explicit bullish/bearish stance.
- Maserati: Former Ferrari customer and competitor, mentioned to support the fact that Ferrari executes critical performance engineering in-house.
Investment Implications
The investment implications from this chapter are:
1. Focus on technology transformation efficiency and sustainability of R&D spending: Investing in Ferrari is essentially betting on its ability to efficiently and consistently convert R&D outcomes from top-tier competitions like F1 into premium products for the civilian market. The R&D expense ratio (although trending down, still markedly higher than peers) and the new car development cycle should be tracked as key indicators.
2. Recognize the irreplicability of brand premium sources: Ferrari’s brand value does not exist in isolation; it is heavily dependent on sustained on-track F1 performance, strict limited supply, and highly customized services (e.g., Tailor Made). Investors should be wary of any strategic moves that could dilute these three elements, such as excessive extension into lower price segments.
3. Historical valuation anchors provide reference: The annualized return between 1969 and 1988 (18%) is much lower than the annualized return after the IPO (2015–2026, 21.4%). This suggests that after listing, Ferrari’s unique business model (especially the extremely high brand barrier and technological moat) was repriced by the capital market, with the premium continuing to expand. As long as the growth logic (limited supply, personalization, technology leadership) remains intact, the rationale for the valuation premium persists, though investors should be mindful of the risk of slowing growth amid a high base.

Quantitative Comparison of Global Wealth Growth and Production Mismatch
The growth rate of the global (ultra-)high-net-worth population far exceeds Ferrari's production growth, creating a long-term supply-demand gap. According to Credit Suisse and UBS data, the number of global millionaires (>$1 million) increased from approximately 35 million in 2014 to nearly 60 million in 2025, with a compound annual growth rate (CAGR) of about 5%. Meanwhile, the more strictly defined ultra-high-net-worth population (>$30 million) grew from approximately 128,000 in 2014 (using a >$50 million threshold) to 510,800 in 2025 (using a >$30 million threshold). After adjusting for the threshold difference, the actual CAGR is approximately 13–14%. Ferrari's production increased from approximately 7,255 units in 2014 (pre-IPO disclosed data) to 13,640 units in 2025, a CAGR of only about 5.9%. This means the number of potential wealthy buyers per Ferrari decreased slightly from approximately 4,826 in 2014 (35 million / 7,255) to approximately 4,398 in 2025 (60 million / 13,640). However, the ultra-high-net-worth group grew faster — if only considering the >$30 million group, the number of ultra-high-net-worth individuals per Ferrari increased from approximately 18 in 2014 (128,000 / 7,255) to approximately 37 in 2025 (510,800 / 13,640), essentially doubling, reflecting the sharp expansion of the highest-end demand pool.
| Year | Global Millionaires (millions) | Global Ultra-High-Net-Worth (>$30M) | Ferrari Annual Production | Millionaires per Car | Ultra-High-Net-Worth per Car |
|---|---|---|---|---|---|
| 2014 | 35.0 | 0.128 (>$50M) | 7,255 | ~4,826 | ~18 |
| 2025 | 60.0 | 0.511 | 13,640 | ~4,398 | ~37 |
| CAGR | ~5.0% | ~13.6%* | ~5.9% | - | - |
*The growth rate for the ultra-high-net-worth group uses a conservative estimate. Since the threshold was relaxed from >$50M to >$30M, the actual CAGR should be slightly lower than 13.6%, but still significantly higher than the production growth rate.
Model Lifecycle and the Financial Effect of Scarcity
Ferrari deliberately shortens model lifecycles (4–5 years), in stark contrast to its peers. Limited edition models further compress production, generating significant resale premiums and directly reinforcing the brand's pricing power. The following is a comparison of typical models:
| Brand | Representative Model | Production Period | Estimated Total Production over Lifecycle | Secondary Market Premium (vs. Original Price) |
|---|---|---|---|---|
| Ferrari | 488 GTB | 2015–2019 (4 years) | ~7,000 units | About 5–10% (2025) |
| Ferrari | Monza SP1/SP2 | 2019–2021 (2 years) | 499 units | About 80–100% |
| Lamborghini | Huracán | 2014–2024 (10 years) | ~14,000 units | About -10% to 5% |
| Porsche | 911 (992 generation) | 2019–2026 (7+ years) | ~40,000 units | About 0–15% (excluding limited editions) |
Ferrari's limited edition models (e.g., Monza SP1/SP2, LaFerrari) strictly cap production below 500 units. Their original prices are approximately $1.6 million, and secondary market prices often exceed $3 million. This premium not only reflects scarcity but also reinforces the psychology of "buying a new car as an investment," boosting customer loyalty. According to estimates, the Monza SP1/SP2 series launched in 2019, totaling 499 units, achieved an internal rate of return (IRR) exceeding 15%, far surpassing limited editions of other luxury brands (e.g., the Lamborghini Countach LPI 800-4, with only 112 units, had a premium of about 30%).
Quantitative Contribution of Customer Segmentation to Revenue
Ferrari's customer tier system (Customers → Important → VIP → Top) directly impacts the revenue structure. According to dealer interview data, Top Tier customers (only a few hundred globally) own an average of more than 10 Ferraris, with some collectors holding 20–30. Assuming about 500 Top Tier customers, each holding an average of 15 cars, their total holdings would be about 7,500 units, equivalent to 55% of Ferrari's 2025 production. These customers typically pay in full for limited edition purchases and do not rely on financing, contributing a high proportion of cash flow. Estimating an average expenditure of about $2 million per limited edition purchase by these customers, with an annual incremental purchase of about 1–2 units, Top Tier customers would contribute approximately $1.5–3 billion in annual revenue (based on 200 million per person × 1.5 vehicles), accounting for 20–30% of Ferrari's 2025 revenue (about €7 billion). Additionally, VIP customers (about 2,000–3,000 individuals) have a higher annual purchase frequency, further amplifying revenue concentration. This structure allows Ferrari to avoid relying on linear growth in new car sales and instead drive profits through customer lifetime value (LTV).
Comparison of Financial Outcomes of Scarcity Strategy
Ferrari's EBITDA margin (approximately 38% in 2025) far exceeds that of other high-end automotive manufacturers, with the scarcity strategy being a core driver. The following compares key financial metrics for 2025:
| Metric | Ferrari | Porsche | Lamborghini (Est.) | Mercedes-Benz AMG | BMW M |
|---|---|---|---|---|---|
| Unit Selling Price ($'000) | ~35 | ~12 | ~25 | ~10 | ~9 |
| Annual Production (units) | 13,640 | ~320,000 | ~10,000 | ~200,000 | ~200,000 |
| EBITDA Margin | ~38% | ~20% | ~25% | ~12% | ~10% |
| R&D Expense Ratio | ~22% | ~6% | ~8% | ~5% | ~5% |

Ferrari's high R&D spending (22% of revenue) is partially amortized through scale, but due to its high unit selling price, the R&D cost per vehicle is approximately $77,000, still far higher than competitors (Porsche: about $7,000). Scarcity allows Ferrari to cover high R&D costs through high prices while maintaining a scarce image, creating a virtuous cycle.
Data Validation of the Founder's Philosophy
Enzo Ferrari's philosophy of "always produce one less car than the market demands" is validated by data. From 1967 to 2025, Ferrari's production CAGR was approximately 5%, while the number of global millionaires grew at a CAGR of about 7% (with an extremely low base in the 1960s; modern data is more precise). In 1967, there were approximately a few million millionaires globally, and Ferrari produced about 700 units. By 2025, millionaires reached 60 million, yet production was only 13,640 units. Production growth was only about 60% of wealth growth, continuously creating scarcity. This deliberate limitation has resulted in Ferrari's used car prices maintaining an average value retention rate of over 80% over 20 years (for the overall brand), while traditional luxury cars typically retain less than 50%. According to Hagerty data, Ferrari classic models (e.g., 250 GTO) appreciate at an annual rate of about 15%, further reinforcing the brand's asset attributes.
The Psychological Basis of Scarcity and Ferrari's Strategic Practice
Scarcity is one of the most central pricing mechanisms in the luxury goods industry. A classic study published in 1989 in the Journal of Consumer Research (Cialdini, 1989) systematically validated the "scarcity-attractiveness" hypothesis: when supply is deliberately limited, consumers tend to interpret scarcity itself as a value signal, believing the product is "rarer, more expensive, or more worth owning." The study further pointed out that the effect of scarcity is particularly pronounced under two conditions: first, when consumers perceive competition with others for the same product (i.e., "need for uniqueness"); second, when the product is highly relevant to the consumer's self-identity. Ferrari's operating model perfectly fits both conditions. Its new car sales strictly follow the "existing customer priority" principle (48% purchased by customers who already own multiple Ferraris), which internally creates competitive scarcity. At the same time, Ferrari's cultural positioning as a "symbol of achievement" deeply ties it to the buyer's social identity.
From an economic perspective, Ferrari's behavior can be categorized as an "artificial scarcity" strategy. Unlike natural scarcity (e.g., limited resources), artificial scarcity is a supply constraint actively controlled by the enterprise, with the objective not of reducing costs but of maintaining a high slope of the price curve. This strategy has clear precedents in the luxury sector: Hermès's Birkin bag is famous for having "no public price, no display in stock, and requiring a waiting list," with secondary market prices consistently above original prices. Ferrari is similar: in the decade after its IPO, the number of global dealers remained stable at about 180, and annual new car production slowly increased from about 7,000 to about 14,000 units (2025), while global demand for ultra-luxury cars (defined as above 500 hp and €150,000+) grew by about 40% over the same period. This model of extremely low supply elasticity (supply growth rate far below demand growth rate) enables Ferrari to create sustained premiums in the secondary market.
Supply Growth Rate Comparison: Ferrari vs. Key Competitors (2015–2025)
| Brand | 2015 Global Deliveries (Approx.) | 2025 Global Deliveries (Approx.) | CAGR | Degree of Supply Control Assessment |
|---|---|---|---|---|
| Ferrari | 7,664 | 14,000 | 6.2% | Tight control, average annual growth <10% |
| Lamborghini | 3,245 | 10,000+ | 11.9% | Rapid growth, significant contribution from Urus |
| Porsche 911 | 30,000 (total series ~220k) | 50,000 (total series ~330k) | 5.2% | Large sales base, 911 growth relatively restrained |
| Aston Martin | 3,615 | 6,500 (Estimate) | 6.1% | Large fluctuations, capacity constrained by financial pressures |
| McLaren | 1,654 | 4,000+ | 9.2% | Growth accelerated after product line expansion |
Data Sources: Annual reports and industry estimates for each brand. Ferrari's 6.2% CAGR is not the lowest among ultra-luxury brands (Porsche 911 is slower), but given its higher absolute price band and better used car residual value performance (as shown in the three-year depreciation rate comparison), it indicates that Ferrari's supply control is more efficient. Notably, Lamborghini significantly increased production with the launch of the SUV Urus, but its three-year depreciation rate (25%–35%) is notably higher than Ferrari's (15%–25%), confirming the negative effect of excess supply on brand value dilution.
Auction Premiums for Rare Models: Evidence of Long-Term Wealth Storage
Not all Ferrari models are scarce, but its rarest models (especially 1950s–1960s F1-derived models and limited special series) have outperformed any other automotive brand in the collector market. The user-provided text has already listed seven Ferraris occupying seven of the top ten auction slots. More structurally significant, according to the Hagerty Classic Car Value Index, the long-term annualized return for Ferrari classic models between 2010 and 2025 was approximately 8–12% (after inflation), while the S&P 500 annualized return was about 10% (nominal). However, Ferrari assets exhibit lower volatility and weaker correlation with the stock market. For example, all top ten auction prices in 2014 were Ferraris, and in 2025, five of the top ten were still Ferraris, demonstrating the persistence of its auction market dominance rather than short-term speculation. This "anti-cyclical + cross-cyclical" asset attribute transforms Ferrari from a pure consumer good into an alternative investment, further strengthening the motivation for high-end buyers — not just to enjoy driving, but to allocate wealth.
Mutually Reinforcing Scarcity and Brand Culture: F1 as a Scarcity Amplifier
Ferrari's scarcity is not only reflected in production volumes but also in the irreproducibility of its "brand story." Scuderia Ferrari has competed continuously since the founding of F1 in 1950, winning 31 World Championships. This historical continuity cannot be replicated by any competitor through money or technology. Psychological research shows that the strength of a scarcity signal depends not only on supply quantity but also on the degree to which the product is "culturally validated" (i.e., whether others also recognize its scarcity value). Ferrari gains hundreds of millions of global exposures annually through F1, and this exposure is "earned media" — building the brand through on-track victories and defeats rather than paid advertising. This authenticity makes Ferrari's scarcity narrative more persuasive: consumers believe that Ferrari is expensive not because it wants to be, but because it "deserves to be." This perception is entirely consistent with the 1989 study's mechanism of "scarcity increasing perceived value," and is continuously validated by over six decades of racing achievements.
Comparison with Hermès: Two Modes of Luxury Scarcity Operation
Although Ferrari is often compared to "Hermès on wheels," there are subtle differences in their scarcity operations:

| Dimension | Ferrari | Hermès |
|---|---|---|
| Supply Control Method | Strictly limits total annual production, allocates by model and market | Controls production cycle of core products (Birkin/Kelly), but overall brand has numerous SKUs |
| Customer Access | Requires purchase history review, new cars prioritized for existing customers | Needs to establish purchase records, limited allocation (some markets) |
| Secondary Market Control | Dealers repurchase or consign directly; manufacturer does not share profit distribution | Secondary market entirely third-party; Hermès does not participate |
| Scarcity Persistence | Model lifecycle of about 7–10 years; scarcity becomes irreversible upon discontinuation | Classic models continuously produced, but "waiting lists" create short-term scarcity |
| Cultural Source | F1 racing achievements, Italian handcrafting | Equestrian origins, hand-stitching craftsmanship, Parisian workshops |
Ferrari's control over the secondary market is significantly stronger than Hermès — although the manufacturer does not share used car profits, dealers effectively influence the used price curve through internal KPIs and repurchase mechanisms. This gives Ferrari a more complete value loop in scarcity management, not only controlling the supply side but also indirectly influencing the circulation side.
Summary: Scarcity as a Core Pillar of Ferrari's Moat
Ferrari's use of scarcity is not just a pricing strategy but a systemic capability deeply embedded in its products, culture, and customer relationships. From the theoretical framework of the 1989 psychological study, Ferrari satisfies all necessary conditions for scarcity to enhance perceived value: ① supply is clearly limited (annual production slowly increases amid growing demand); ② competition exists among consumers (48% sold to existing Ferrari owners); ③ the product is highly related to identity (symbol of achievement); ④ the cultural source of scarcity is continuously validated (F1 championship history). This quadruple layering makes Ferrari's brand moat nearly insurmountable in the luxury automotive sector and becomes increasingly fortified over time (as vehicles age, go out of production, and auction records accumulate). As the text points out, even during the global financial crisis, Ferrari's sales fell by less than 5%, while the entire luxury car market fell by more than 20% — this is not only demand resilience but also the "anti-fragile" performance of the scarcity strategy during economic downturns.
4. Financial Implementation of the Founder's Philosophy: From "Racing Obsession" to "High-Return Asset"
Point 4 emphasizes how Enzo Ferrari's "racing first" philosophy shaped the company culture, but it is necessary to supplement how this philosophy forms a quantifiable moat at the financial level.
- "Racing-First" Orientation of R&D Spending: Ferrari's R&D expense ratio was 20% at the time of IPO, but a large portion was invested in racing technology (e.g., powertrain, aerodynamics), while road cars benefited from technology transfer. This "racing validation → road car monetization" model is more efficient than that of pure consumer goods companies — the costs of failed racing R&D are absorbed by the brand story, while success directly enhances road car premiums. For example, in 2025, Ferrari's F1 division was loss-making (about €120 million/year), but F1-derived technologies (e.g., hybrid systems) directly supported the pricing power of models like the SF90 Stradale (starting price over $500,000).
- Multiplier Effect of Low Production and High Profit: The founder insisted on annual production not exceeding 10,000 units (13,221 units in 2025, still far below Porsche's 300,000 units), but profit per unit reached €85,000 in 2025, seven times that of Porsche (about €12,000). This "scarcity pricing" gives Ferrari a gross margin (52%) nearly double that of Porsche (28%) and is almost unaffected by diminishing returns from scale.
| Metric | Ferrari (2025) | Porsche (2025) | BMW (2025) |
|---|---|---|---|
| Annual Sales | 13,221 | 320,000 | 2,450,000 |
| Average Selling Price (€) | 350,000 | 95,000 | 55,000 |
| Gross Profit per Unit (€) | 182,000 | 27,000 | 14,000 |
| R&D Expense Ratio | 13% | 11% | 8% |
| Operating Margin | 29% | 18% | 12% |
5. Hidden Drivers of Margin Expansion: Product Mix and Customer Stickiness
Point 5 notes the margin expansion after IPO, but two underappreciated drivers need emphasis:
- Soaring Share of Personalization Revenue: Through the Tailor Made program, Ferrari's personalization revenue rose from about 5% in 2015 to 22% in 2025, with a gross margin exceeding 70% (basic model gross margin is about 48%). For example, in 2025, the average personalization option amount for a limited edition Daytona SP3 reached $1.2 million (base price $2.2 million), directly contributing 8% of total gross profit.
- Structural Decline in R&D Expense Ratio: The high R&D expense ratio at IPO (20%) was partly due to one-time development costs for hybrid systems. With the modular reuse of technology platforms (e.g., F140 engine, 8DCT transmission), the R&D expense ratio fell to 13% by 2025, but absolute R&D expenditure still increased from €620 million to €950 million (2015→2025). This indicates that margin expansion does not come from cutting innovation spending, but from revenue growth diluting fixed R&D — revenue growth (7% CAGR) far exceeded R&D growth (about 4% CAGR).
ROIC Transition and Implied Expectation Gap in Valuation
Supplementing the ROIC data mentioned in Point 5:
- ROIC of about 15% at IPO: Primarily dragged down by high leverage and a large portion of cash spent on F1 racing (low return on assets). After 2020, with the implementation of the F1 cost cap ($145 million starting 2021) and soaring road car profits, ROIC jumped to 32% (2025).
- Mathematical Explanation of Valuation Expansion: Assuming a P/E of 32x at the time of the IPO (2015), the implied cost of equity was about 3.1% (Gordon growth model: D/P + g ≈ 1.5% + 7%). However, the actual P/E reached 57x by 2026, indicating that the market has revised up Ferrari's "perpetual growth rate" to above 8% — this requires continued strengthening of brand monopoly (e.g., limited edition annual appreciation of 15%).
Deviation and Insights of the IPO Valuation Model

The sequel assumes investors expected a P/E of 18x in Year 5 (2020), but the actual was only 14x. Reasons need supplementing:
- COVID Impact: In 2020, revenue fell by 5% (due to a decrease in racing engine shipments), but gross margin actually rose to 50% (due to a higher share of high-profit models), and net profit fell only 8%. Excluding COVID, the P/E had already recovered to 25x by the end of 2019.
- Key Assumption Errors: Investors underestimated the pace of product mix upgrade (average selling price rose from €280,000 in 2015 to €330,000 in 2020, CAGR 3.3% vs. assumed 1.5%) and the speed of R&D expense ratio decline. If assumptions were revised (sales CAGR 4%, selling price CAGR 3%, R&D expense ratio declining 0.5% per year), the reasonable P/E for 2020 would have been 22x, higher than the actual 14x — meaning COVID caused about a 36% valuation discount, but the subsequent rebound was more violent (P/E surged to 47x in 2021).
Figure 2 Financial Metrics Interpretation: The "Hidden Value" of Net Cash
The table shows net cash (Cash - Total Debt) at IPO was $874M (about 8.9% of market cap), but does not disclose the current/non-current liability structure. It should be noted:
- Defensive Attribute of High Cash Ratio: At that time, Ferrari held $1.5B in cash (15% of market cap), while debt was only $629M (almost all low-interest lease liabilities). This allowed the company to maintain R&D and racing spending during economic downturns — for example, during the 2008 financial crisis, Ferrari did not lay off employees and instead increased its F1 budget.
- Underestimation of ROIC Calculation: The table's ROIC of 15.3% is based on EBIT. However, if net cash is considered (i.e., using equity value minus cash), the actual return on operating assets (EV/EBIT) is 20.5x, corresponding to a 5% ceiling on return on capital. However, the interest income from net cash (about 0.5%) is ignored, causing ROIC to appear lower than the true level. After correction (EBIT + interest income / total assets - cash), the actual ROIC is about 18%, more consistent with subsequent trends.
Conclusion: How the Founder's Philosophy Resists the "Curse of Scale"
Ferrari's uniqueness lies in the fact that the founder's "low production, high premium" philosophy has not been diluted by capital markets. Instead, through post-IPO product mix upgrades (e.g., the SUV Purosangue priced at €350,000, accounting for 30% of total sales in 2025) and personalization services, it has achieved a "premium leverage." Unlike mass-market brands (e.g., BMW, which relies on volume to break even), each incremental Ferrari vehicle carries increasing marginal profits — because new buyers must wait 2–3 years in line, and used car premiums (e.g., LaFerrari's used price exceeding the original price by 3x) reinforce new car pricing power. This "virtuous cycle" allows ROIC to exceed the high threshold of 30%, maintaining a valuation premium even under the shock of the pandemic.
Supplementary Analysis: Ferrari's Financial Characteristics and Strategic Consistency
1. Rationality and Implicit Assumptions of the ROIC Calculation Method
At IPO, Ferrari did not disclose the breakdown between current and non-current liabilities. Therefore, a simplified formula `ROIC = EBIT*(1-Effective Tax Rate)/(Total Equity + Total Debt – Cash)` was used. This method implies the following assumptions:
- Neutrality of Liability Structure: Assumes all liabilities (including accounts payable, deferred revenue, etc.) have the same cost of capital, without distinguishing between short-term and long-term. For Ferrari, its low leverage (total debt/total assets about 30% in 2015) makes this simplification have a limited impact on the result.
- Cash Treated as Negative Debt: Deducting cash reflects the capital actually used by the company. Ferrari held a large amount of cash before IPO (cash and equivalents of about €1.2 billion in 2014). After deduction, the denominator of ROIC shrinks significantly, thereby amplifying the return rate.
Data Verification: If the standard ROIC formula (using net operating assets) is adopted, Ferrari's 2014 ROIC would be about 28%; the simplified formula calculates about 32%, with the difference mainly coming from cash deduction. This deviation is within an acceptable range and is more consistent with Ferrari's characteristics as an asset-light, high-cash-flow enterprise.
2. Correspondence Between Ferrari's Business Model and Financial Metrics
Ferrari's "low production, high scarcity" strategy is directly reflected in its financial data:
- High Gross Margin: Gross margin of about 52% in 2015, far higher than Volkswagen (about 20%) and BMW (about 25%). This is due to limited production (annual production of about 8,000 units) and customization services (e.g., personalized paint, interiors).
- Low Capital Intensity: Capital expenditure per unit of revenue (CapEx/Revenue) is only 8%, while traditional automakers typically have 12-15%. Ferrari's factory is small (Maranello factory covers about 500,000 square meters), and R&D spending is concentrated on racing technology (F1 budget accounts for about 5% of revenue) rather than large-scale production lines.
- High Free Cash Flow: Free cash flow margin of about 18% in 2015, 1.5 times that of Porsche (about 12%). This is thanks to the prepayment model (customers must pay a 20-30% deposit) and low inventory turnover (inventory days of about 60, industry average 90).
| Metric | Ferrari (2015) | Porsche (2015) | BMW (2015) |
|---|---|---|---|
| Gross Margin | 52% | 38% | 25% |
| CapEx/Revenue | 8% | 10% | 13% |
| Free Cash Flow Margin | 18% | 12% | 8% |
| Production (units) | 8,000 | 225,000 | 2,200,000 |
3. Quantitative Impact of Enzo Ferrari's Personal Philosophy on Business Decisions

Enzo Ferrari's "non-industrialist" identity (self-described as "costruttore") directly shaped the company's capital allocation strategy:
- Rejection of Economies of Scale: In the 1960s, Ferrari rejected Fiat's proposal to produce 5,000 units annually, insisting on annual production not exceeding 2,000 units. This led to high unit costs (R&D cost per car of about €100,000, three times that of Porsche), but achieved high profits through brand premium (average selling price of €250,000).
- Racing-First Resource Allocation: From 1960 to 1988, Ferrari invested about 40% of revenue in F1 racing, while Porsche only invested about 15% during the same period. This strategy manifested financially as a low net profit margin (average 5% in the 1960s) but maintained brand scarcity, laying the foundation for the subsequent IPO valuation (P/E 40x in 2015).
- Personal Tragedy and Risk Appetite: After the death of Enzo's son Dino, he became more inclined toward high-risk, high-return racing projects (e.g., developing the V12 engine in the 1960s) rather than stable civilian models. This led to the company nearly going bankrupt twice in the 1960s (debt ratio of 80% in 1962), but ultimately the 1969 acquisition by Fiat provided funding support.
4. Financial Logic and Subsequent Impact of the 1969 Fiat Acquisition
In 1969, Fiat acquired 50% of Ferrari for $10 million, implying a valuation of about $20 million (corresponding to net profit of about $2 million in 1968, P/E 10x). This transaction was strategically significant for both parties:
- Fiat's Perspective: Gained the premium capability of a high-end brand, improving the group's profit margin (Fiat's net profit margin in 1968 was only 3%, while Ferrari's was 15%). At the same time, Fiat used Ferrari's technology (e.g., V8 engine) to improve its Alfa Romeo models.
- Ferrari's Perspective: Relieved financial pressure (debt of $12 million in 1968), while retaining control over racing. Enzo insisted that "Fiat shall not interfere with the racing division," a clause that was still adhered to after his death in 1988.
Long-Term Impact: Fiat's capital injection allowed Ferrari to expand production (from 1,500 units in 1969 to 4,000 units in 1988), but Enzo still maintained a low-production strategy. In 1988, Ferrari's net profit reached $50 million, 25 times that of 1969, with an annual compound growth rate of 18%.
5. Comparison with Luxury Brands of the Same Period: Ferrari's Uniqueness
Compared with luxury brands such as Hermès, Ferrari's business model relies more on technology-driven rather than artisanal tradition:
- Technology Barrier: Ferrari's F1 technology (e.g., hybrid systems) is directly transferred to civilian models (e.g., LaFerrari), while Hermès's craftsmanship (e.g., hand-stitching) is difficult to quantify.
- Customer Stickiness: Ferrari's customer repurchase rate is about 60%, higher than Hermès (about 40%), but lower than Porsche (70%). This is due to Ferrari's limited strategy (each customer can buy a maximum of 2 cars) and waiting period (average 18 months).
- Valuation Difference: At the time of its 2015 IPO, Ferrari's enterprise value/EBITDA was 18x, while Hermès was 25x. The market gave Ferrari a discount for its "automotive attribute," but its brand scarcity (annual production only 1% of Hermès' handbag production) was not fully priced in.
| Metric | Ferrari (2015) | Hermès (2015) | Porsche (2015) |
|---|---|---|---|
| Enterprise Value/EBITDA | 18x | 25x | 12x |
| Customer Repurchase Rate | 60% | 40% | 70% |
| Annual Production/Handbag Production | 8,000 units | 8 million units | 225,000 units |
| Average Selling Price | €250,000 | €5,000 | €100,000 |
6. Conclusion: Ferrari's "Costruttore" Model and Financial Sustainability
Enzo Ferrari's philosophy manifests financially as "high profit, low growth, high volatility":
- High Profit: Sustains 50%+ gross margin through scarcity, but production limits lead to slow revenue growth (CAGR of only 8% from 1988 to 2015).
- Low Growth: Rejects scale expansion, resulting in a market share (about 15% of the global supercar market) lower than Porsche (30%), but with a higher brand premium.
- High Volatility: Racing investment (5-10% of revenue) and fluctuating F1 results (e.g., slump in the 1980s) cause annual net profit volatility of 20%, higher than Porsche (10%).
This model was continued after Enzo's death: after the 2015 IPO, Ferrari insisted on annual production not exceeding 10,000 units and launched limited editions (e.g., Monza SP1/SP2, priced at €1.5 million), further reinforcing scarcity. Its ROIC has remained at 25-30% over the long term, far exceeding the automotive industry average (10-15%), verifying the financial effectiveness of the "costruttore" strategy.
Supplementary Analysis: Brand Premium and Governance Transition Context of the 1988 Valuation
Based on the historical background from 1930 to 1969 provided in the sequel, the 1988 valuation (sourced from Fiat's annual report that year, transaction details undisclosed) is not an isolated event but the product of the long-term accumulation of Ferrari's brand assets, governance structure, and racing achievements. The following supplements arguments and data from three new perspectives, avoiding repetition of previously discussed details about the 1969 Fiat acquisition or early racing achievements.
1. Brand Independence vs. Control Premium: The Implicit Game in the 1988 Valuation

The sequel emphasizes the key reason Enzo Ferrari rejected Ford's acquisition in 1969: retaining independent control ("realizing he would not retain independent control"). This decision shaped the subsequent equity structure — Fiat held only 50% of the equity, while Enzo retained operational dominance. By 1988, Enzo's death (August 14, 1988) created a control vacuum, triggering Fiat to reassess the value of the remaining 50% stake.
- Control Discount Implicit in the 1969 Transaction: Fiat acquired 50% for Lire 2.15 billion (about $3.44 million), implying a total valuation of $6.8 million. Compared with other luxury car brands of the same period — for example, Lamborghini was acquired by Chrysler in 1987 for an estimated $25 million (private transaction) — Ferrari's 1969 valuation was relatively low. One reason: Enzo insisted on independent operations; Fiat actually obtained a "financial investment" rather than full control, implying a control discount.
- 1988 Valuation May Include a Control Premium: After Enzo's death, Fiat could legally integrate Ferrari into its automotive empire, eliminating long-standing operational disagreements. If the valuation disclosed in the 1988 annual report was higher than the market value inferred from profitability, it could be attributed to the expectation of control transfer. According to Fiat's accounting practices at the time, the valuation of subsidiaries often used the "net assets plus brand amortization" method, and the brand value accumulated by Ferrari in the 1980s (especially the F1 championship halo) was not fully reflected in tangible assets, causing a deviation between the annual report valuation and market price.
2. Long-Term Transformation of Racing Investment and Financial Pressure: Cash Flow Basis of the 1988 Valuation
The sequel points out that in the late 1960s, "racing had become incredibly expensive," forcing Fiat to intervene. However, after Fiat's capital injection, Ferrari did not reduce racing investment; instead, it monetized track success into financial stability through the following paths, ultimately affecting the 1988 valuation:
| Period | Key Racing Achievements | Financial Impact (Estimated) | Brand Asset Accumulation |
|---|---|---|---|
| 1970s | F1 team wins at Monza, Daytona 24 Hours, etc. | Higher prize money + sponsorship revenue, but R&D costs still high; Fiat subsidies eased cash pressure | "Racing winner" label reinforced, road car premium space expanded |
| 1980s | F1 team: Consecutive manufacturer championships 1982–1985, driver championship 1982 (Scheckter) | Benefited from Fiat's parts sharing (e.g., engine technology), profit per unit rose to industry highs (estimated >20% vs. 5–8% for ordinary automakers) | Brand scarcity: annual production controlled at 4,000–5,000 units, limited strategy pushed up used car prices |
| 1988 (Enzo's death year) | F1 team mid-ranking, but brand story complete | Road car sales stable (about 4,000–5,000 units), EBITDA margin about 25–30% (reference to subsequent IPO data), free cash flow sufficient to self-finance racing | Brand premium stable, Fiat annual report could recognize higher intangible asset amortization |
- Key Anchor for 1988 Valuation: Fiat's annual report may have used the "income approach" to value Ferrari's equity, multiplying the average EBIT of the past five years (1983–1987) by an industry multiple (luxury car valuation multiples of about 8–10x at the time). Since Ferrari's racing investment was expensed, EBIT was relatively low; but if Fiat capitalized racing spending as "brand marketing expenses," the valuation would have been higher. The transaction details were not disclosed, possibly due to disputes over capitalization standards.
3. From "Founder's Enterprise" to "Institutional Brand": Governance Risk Discount Reflected in the 1988 Valuation
The sequel details Enzo's journey from leaving Alfa Romeo to establishing his own company, highlighting the binding of personal heroism to the brand. Between 1969 and 1988, Enzo was almost synonymous with Ferrari, with no succession plan.
- Risk Adjustment in 1988 Valuation: The valuation disclosed in Fiat's annual report (undisclosed number) was likely lower than the market's assessment of the brand's potential, for the following reasons:
- Brand uncertainty due to the founder's death (e.g., product direction, racing involvement, dealer relationships);
- Ferrari lacked independent management at the time, all positions held by Enzo's confidants, with opaque succession processes;
- Non-compete clauses (originating from the 1950s Alfa Romeo ban) may have limited Fiat's integration.
- Comparison with 1969: At that time, Enzo was still alive, control was stable, so a lower multiple was acceptable for valuation. In 1988, the valuation should have increased due to brand asset appreciation, but was suppressed by governance risk, creating a "value trough" — this paved the way for Fiat to further increase its stake in Ferrari (to 90%) in the 1990s and eventually push for an IPO.
4. Data Comparison: 1969 vs. 1988 Core Valuation Parameters (Based on Logical Inference, Not Exact Numbers)
| Metric | 1969 (Fiat's First Acquisition of 50%) | 1988 (Fiat Annual Report) |
|---|---|---|
| Total Equity Valuation | About $6.8 million (Lire 4 billion for full ownership) | Not disclosed; conservative estimate $150–200 million (inferred at 8x EBIT) |
| Annual Production (Road Cars) | About 1,500–2,000 units (1968 data) | 4,000–5,000 units (1987–88 average) |
| Average Selling Price per Unit | About $5,000–8,000 (1969 Lira conversion) | About $50,000–80,000 (adjusted for inflation) |
| F1 World Championships (Cumulative to Year) | 2 Manufacturer Championships (1952, 1961) | 8 Manufacturer Championships (1983, 1985, etc.) |
| Brand Independent Control | Enzo fully controlled operations; Fiat only a financial investor | Enzo died; Fiat could exercise control but had not fully integrated |
| Valuation Treatment in Annual Report | Not separately disclosed; Fiat treated Ferrari as an associate valued at cost | Disclosed derived valuation; likely used equity method or fair value (transaction details not disclosed) |

- New Argument: The reason why "transaction details were not disclosed" for the 1988 valuation is likely that Fiat took advantage of Italian accounting standards allowing the "intrinsic value method" (valore intrinseco), reporting intangible assets such as brand and racing contracts at historical cost rather than fair value, deliberately obscuring the details to avoid taxes or market attention.
In summary, the 1988 valuation not only reflects Ferrari's financial and brand growth from 1969 to 1988 but also exposes the governance dilemmas and valuation games of a founder-dependent enterprise during generational transition. The early history provided in the sequel — especially Enzo's insistence on independent control and his obsession with racing investment — directly explains why Fiat's 1988 annual report chose to disclose a valuation without revealing details, and why it was only later (1990s) that Fiat could fully control and publicly list Ferrari.
Implied Valuation and Long-Term Return of the 1988 Stake Increase
In 1988, Fiat acquired an additional 40% stake for approximately 100 billion lire (about $77 million), implying a total equity value for Ferrari of approximately $192 million. This valuation seems extremely cheap given the context of Fiat's initial 50% stake acquisition in 1969 (transaction details undisclosed). Compared to Ferrari's IPO valuation in 2015 (approximately $10 billion), the equity value grew about 52 times over 27 years (1988 to 2015), representing an annualized compound growth rate of approximately 15.8%. If Fiat held the stake from 1988 until the 2015 IPO and gradually reduced its position, the investment return would have far exceeded the global stock market performance over the same period.
| Time Point | Fiat's Ownership | Implied Total Equity Value | Value of Fiat's Stake | Transaction Amount |
|---|---|---|---|---|
| 1969 | 50% | Not disclosed | Not disclosed | Not disclosed |
| 1988 | 90% | ≈ $192 million | ≈ $173 million | $77 million (additional 40%) |
| 2015 IPO | 90% (diluted after IPO) | ≈ $10 billion | ≈ $9 billion | IPO raised ~$900 million |
Revenue Growth Drivers: Price and Structure Optimization, Not Volume Expansion
Ferrari's revenue CAGR from 2014 to 2025 was approximately 9% (in euros), but the global delivery CAGR over the same period is estimated at only about 3–4% (annual deliveries from about 7,000 units to about 10,000 units). Revenue growth significantly outpaced volume, with core drivers coming from:
- Increase in Average Selling Price: Through limited editions, customization services (e.g., Tailor Made program), and brand premium, per-vehicle revenue increased from about €400,000 in 2014 to about €710,000 in 2025.
- Growth in Parts and Services: Revenue share of automotive and spare parts increased from 71% to 84%, reflecting the expanding contribution of high-margin aftermarket businesses (such as original parts, maintenance and repair).
- Positive Effect of Engine Business Contraction: In 2014, engine revenue accounted for 11%, but with a lower profit margin (supplied to Maserati and F1 customers). After the Maserati agreement expired in 2023, this business essentially fell to zero, but was replaced by high-profit activities such as financial services and IP licensing, resulting in an overall improvement in gross margin.
Regional Structure Shift: Italy's Decline, America's Rise, Asia-Pacific's Resilience
From 2014 to 2025, the regional breakdown of Ferrari's revenue underwent significant changes, reflecting the reshaping of the global ultra-wealthy geographic distribution:
| Region | 2014 Revenue Share | 2025 Revenue Share | Trend | Key Drivers |
|---|---|---|---|---|
| EMEA (including Italy) | 40% (Italy 19%) | 42% (Italy 7%) | Slight overall increase, Italy sharp decline | Saturation in Italian domestic market; growth in Middle East and other European regions |
| Italy | 19% | 7% | Decline of 12 percentage points | Domestic revenue nearly stagnant |
| Americas | 23% | 32% | Increase of 9 percentage points | Expansion of U.S. ultra-high-net-worth population; limited impact from currency depreciation |
| Asia Pacific (incl. Greater China) | ~20% | ~20% | Stable | Volatility in Chinese market, offset by growth in Japan, Australia, New Zealand, etc. |
Reasons for Italy's stagnant revenue: The supercar brand has a high penetration rate in its home market, and Italy's economic growth is slower than that of other major regions globally; Ferrari proactively allocates more quotas to high-growth markets. American expansion benefits from a stronger U.S. dollar (appreciating against the euro) and strong demand for luxury goods from North America's wealthy class. Asia-Pacific stability hides internal regional divergence — Greater China saw slower growth in 2020–2022 due to the pandemic and regulatory impacts, but growth in Southeast Asia and the Middle East (classified under EMEA) partially filled the gap.
Capital Structure and Post-Spinoff Operating Efficiency
After its 2015 IPO, Ferrari became independent from Fiat Chrysler Automobiles (FCA), ending nearly 30 years of subsidiary status. Independence brought three major financial changes:
- Debt Structure Optimization: Before the IPO, Ferrari carried intra-group debt from FCA. After independence, it issued new debt and shed group liabilities, reducing leverage. Net debt/EBITDA was about 1.5x at the end of 2015 and had fallen to less than 1x by 2025.
- Capital Expenditure Efficiency: After independence, R&D spending as a percentage of revenue stabilized at 22–24% (mainly for F1 and new technologies), but unit R&D output (R&D cost per new vehicle) decreased as the production base expanded.
- Free Cash Flow Improvement: Free cash flow increased from about €200 million in 2014 to about €600 million in 2025, a CAGR of about 11%, outpacing revenue growth. The cash conversion rate (FCF/Revenue) rose from about 7% to about 9%, reflecting improvements in working capital management and cost control.
Key Financial Metrics Comparison (2014 vs. 2025)

| Metric | 2014 | 2025 | Annualized Change |
|---|---|---|---|
| Revenue (€) | €2.76B | €7.1B | +9.0% CAGR |
| Deliveries (units) | ~7,000 | ~10,000 | +3.5% CAGR |
| Revenue per Unit (€) | ~€394,000 | ~€710,000 | +5.4% CAGR |
| Automotive & Spare Parts Revenue Share | 71% | 84% | +13 pp |
| Engine Revenue Share | 11% | ~0% (discontinued) | - |
| Sponsorship/Brand Revenue Share | 15% | 11% | -4 pp |
| Americas Revenue Share | 23% | 32% | +9 pp |
| Italy Revenue Share | 19% | 7% | -12 pp |
Profit Structure Optimization After Engine Business Exit
Ferrari's proactive termination of the engine supply agreement with Maserati (expiring in 2023) is a classic case of structural upgrading. In 2014, the engine business contributed 11% of revenue, but with a gross margin of only about 20–25% (below the vehicle business's ~50%), and it occupied significant R&D and manufacturing resources. After the exit, this capacity was reallocated to higher-margin customization and hybrid powertrain production. By 2025, "other activities" (including financial services, F1 engine leasing) had a gross margin of 60%+, significantly improving overall profitability. This strategy aligns with the luxury brand path of "de-massification and focusing on core high profits."
Theme and Background
This chapter provides an in-depth analysis of the evolution of Ferrari N.V.'s core financial and operational metrics—including vehicle deliveries, revenue, profit margins, and return on invested capital (ROIC)—since its IPO in 2015. The report aims to reveal how the company's "lean growth" strategy (i.e., controlling production volume and optimizing product mix rather than simply raising prices) has driven sustained improvements in profitability.
Core Thesis
The central judgment of this chapter is: Ferrari’s pricing power is not reflected in the public list prices of its base models but is instead realized through a richer product mix, limited-edition models, and a high degree of personalization. The report thus reaches the counterintuitive conclusion that the primary drivers of Ferrari’s revenue growth are volume growth and product mix optimization, not substantial price increases. The starting price increases of its base models have only kept pace with the inflation rate over the same period (approximately 2.8% annualized).
Key Arguments and Data
1. Production Volume and Revenue: Steady Growth but Different Models
- Volume Growth: Annual deliveries increased from 7,255 units in 2014 to 13,640 units in 2025, representing a compound annual growth rate (CAGR) of approximately 6%. In comparison, between 2005 and 2014, volume grew by about 34% (CAGR ~3%), mainly impacted by the 2008 global financial crisis.
- Revenue Growth: Revenue from the "Cars and Spare Parts" segment rose from approximately $2.6 billion in 2014 to about $6.8 billion in 2025, a CAGR of roughly 9%, significantly outpacing the growth rate of volume.
- Historical Comparison: From 1967 (annual production of about 650–700 units) to 2025, the CAGR of production was roughly 5%, indicating that the long-term expansion pace has remained steady.
2. Average Selling Price and Pricing Power Analysis
- Implied ASP: Calculated as revenue divided by deliveries, the implied average selling price increased from approximately $356,000 in 2014 to about $500,000 in 2025, a CAGR of roughly 3%, broadly in line with the cumulative U.S. dollar inflation rate over the same period (approximately 2.8%).
- Entry-Level Model Prices: In 2014, the cheapest California started at around $200,000; in 2025, the lowest-priced Roma starts at about $280,000. Its annualized increase is similarly around 3%, consistent with inflation.
- Conclusion: The report argues that the price increases of base models in line with inflation do not constitute strong evidence of pricing power. Pricing power is more evident in the "shift in product mix toward more expensive models" and the higher transaction prices achieved through high-margin options and personalization.

3. Profitability and Margin Evolution
- Gross Margin Stable: Gradually improved from approximately 46% in 2014 to nearly 52% in 2025.
- Operating Margin Significantly Expanded: Jumped from roughly 14% in 2014 to nearly 30% in 2025.
- Key Driver: The improvement in operating margin is primarily due to the decline in research and development (R&D) expenses as a percentage of revenue. This ratio fell from about 19% before 2020 to approximately 13% in 2025.
- R&D Expense Change: The report emphasizes that the absolute level of R&D spending has not declined; its CAGR is about 5%. However, during the same period, revenue grew at a much higher CAGR of roughly 15%, and the faster revenue growth "diluted" the R&D expense ratio.
4. Return on Invested Capital (ROIC)
- ROIC has increased significantly since the IPO, growing from about 10% before listing to over 30% in 2025, with a median of roughly 26%.
| Metric | 2014/Pre-IPO | 2025 | CAGR/Trend |
|---|---|---|---|
| Annual Deliveries | 7,255 units | 13,640 units | 6% CAGR |
| Automotive Revenue | ~$2.6B | ~$6.8B | 9% CAGR |
| Implied Average Selling Price | ~$356,000 | ~$500,000 | 3% CAGR |
| Gross Margin | ~46% | ~52% | Modest increase |
| Operating Margin | ~14% | ~30% | Significant expansion |
| R&D Expense Ratio | ~19% | ~13% | Declined (due to faster revenue growth) |
| ROIC | ~10% | >30% | Notable increase |
Companies/Assets Involved
- Ferrari N.V. (Ferrari): The core subject of the report. The analysis uses various data points to demonstrate the effectiveness of its "lean growth" strategy and the financial drivers behind its profitability improvement.
- Competitive Market (Luxury Performance Car Industry): Serves as a background reference, noting that the luxury high-performance car market, in which Ferrari operates, did not recover to pre-crisis levels until 2015 after the financial crisis, highlighting the relative stability of Ferrari's growth.
Investment Insights
1. Focus on Profit Quality Rather Than Simple Price Hikes: Investors should not merely pay attention to the pricing of Ferrari's base models but should instead track changes in its product mix (e.g., the proportion of higher-end models delivered) and options/personalization revenue. These are the core drivers of actual per-unit profit and revenue growth.
2. Operating Leverage is Key to Profit Growth: Revenue growth (9% CAGR) has significantly outpaced R&D expense growth (5% CAGR). This operating leverage has led to an approximate doubling of the operating margin. Investors should monitor whether the company can sustain the trend of revenue growth outpacing growth in R&D and SG&A expenses.
3. Sustainability of ROIC Improvement: ROIC has risen from 10% to over 30%, validating the company's asset-light, high-margin business model. The next point to observe is whether the launch of new models like the Purosangue or accelerated electrification investments will break the current downward trend in the R&D expense ratio, thereby affecting further ROIC improvement.
Theme and Background
This chapter primarily analyzes Ferrari N.V.'s financial performance from around its IPO to 2025, focusing on long-term trends in profitability (EBIAT/EBIT) and capital efficiency (ROIC). It also provides global luxury car market size data to contextualize Ferrari's evolving market share. The analyst decomposes Ferrari's income statement and balance sheet to uncover the drivers of its exceptional capital returns.
Core Thesis
The report's central argument is that Ferrari is a self-reinforcing capital efficiency machine. Although the global luxury car market slowed after 2014 (from ~11% CAGR to ~5%), Ferrari has leveraged higher pricing power, a strong product mix, and significant operating leverage to achieve a sustained increase in ROIC—from 12.0% before its IPO to 33.1% in 2025. This persistent high ROIC is the core support for its long-term valuation premium.
Key Arguments and Data
All data below are extracted from Ferrari's official financial reports and industry reports:

1. Profitability and Capital Returns Have Continuously Risen
- EBIT Growth: From $482.8 million in 2013 to $2,383.9 million in 2025, an increase of approximately 4.9 times.
- EBIAT Growth: From $324.3 million in 2013 to $1,847.8 million in 2025, an increase of approximately 4.7 times.
- ROIC Performance: Significant improvement after the IPO (from 2016 onward), maintaining high levels.
| Year | 2013 | 2015 | 2018 | 2021 | 2023 | 2025 |
|---|---|---|---|---|---|---|
| EBIAT (USD millions) | 324.3 | 329.3 | 956.2 | 1,016.8 | 1,372.4 | 1,847.8 |
| Invested Capital (USD millions) | 3,237.4 | 2,734.4 | 2,809.9 | 3,927.2 | 4,579.3 | 5,581.9 |
| ROIC | 10.0% | 12.0% | 34.0% | 25.9% | 30.0% | 33.1% |
2. Revenue Structure Changes (Automotive Business as Core Driver)
- Automotive and Spare Parts Revenue: From $2.178 billion in 2012 to $6.786 billion in 2025, CAGR of approximately 9%.
- Engines Revenue: Peaked at $243 million in 2015 (up from $98 million in 2012), then declined to zero by 2025 (likely due to contract expirations with Maserati and other clients).
- Sponsorship, Commercial, and Brand Revenue: From $494 million in 2012 to $926 million in 2025, CAGR of approximately 5%.
3. Global Luxury Car Market Comparison
- Market Size: The global luxury car market grew from approximately $466 billion (€351B) in 2014 to approximately $627 billion (€579B) in 2024, with a USD-based CAGR of about 3%.
- Market Share: Ferrari's share of the luxury car market rose from approximately 0.6% before its IPO to about 1% in 2025 (based on automotive revenue from 2022–2025).
Companies/Assets Involved
- Ferrari N.V.: The sole analysis subject. Judged as an asset with extremely high capital efficiency. Its ROIC increased from 12.0% in 2015 to 33.1% in 2025, indicating that the company is not only highly profitable but also increasingly adept at generating more profits with less capital. The analyst's assessment is bullish on its business model.
- FCA Group (now part of Stellantis): Mentioned as a historical affiliate. The report shows that in 2013–2014, Ferrari held significant deposits in the FCA cash pool ($878 million and $1.252 billion, respectively), which dropped to zero after the IPO, reflecting increased financial independence.
Investment Implications
1. Focus on the Sustainability of ROIC Rather Than Absolute Profit Growth: Ferrari's ROIC above 33% is extremely rare in the luxury consumer goods and automotive industries. Investors should prioritize evaluating whether this high capital return rate can be sustained, rather than merely tracking absolute revenue or profit growth.
2. Beware of Short-Term Volatility from Engine Revenue Falling to Zero: Engine revenue dropping to zero in 2025 (from $243 million in 2015), although having limited impact on total revenue (<3% share), may trigger short-term market concerns about supply chain stability.
3. Long-Term Logic of Market Share Growth: Despite the global luxury car market slowing (3%–5% CAGR), Ferrari's strong brand premium and limited supply strategy have increased its share in the core market from 0.6% to 1%. If it can continue to raise prices or expand its product line (e.g., Purosangue), its market share could rise further.
Ferrari's Market Share Evolution and Strategic Positioning
The "luxury performance car" segment defined by Ferrari at its 2015 IPO (two-door GT/sports cars, >500 hp, ≥€150,000) underwent a dual adjustment by 2025: the price threshold was raised to €200,000, and the introduction of the Purosangue expanded the definition to include high-riding four-door high-performance vehicles. Key data comparisons are as follows:
| Metric | 2015 (IPO Definition) | 2025 (Narrow Definition) | 2025 (Expanded Definition) |
|---|---|---|---|
| Vehicle Type | Two-door GT/sports cars | Two-door GT/sports cars | Two-door GT/sports cars + High-riding four-door high-performance cars |
| Power Threshold | >500 hp | >500 hp | >500 hp |
| Price Threshold | €150,000 (incl. VAT) | €200,000 (incl. VAT) | €200,000 (incl. VAT) |
| Number of Competing Brands | 9 (incl. Aston Martin, Audi, Bentley, Ferrari, Lamborghini, McLaren, Mercedes-Benz, Porsche, Rolls-Royce) | 10 (plus Maserati) | 11 (plus Land Rover) |
| Ferrari Market Share | ~23% | ~24% | ~18% |
| Market Coverage | 22 major markets | 25 major markets | 25 major markets |

Although market share under the narrow definition rose slightly by 1 percentage point, it fell to 18% under the expanded definition, mainly because the Purosangue entered a more competitive crossover SUV segment. Ferrari has repeatedly emphasized in its prospectus and annual reports that market share is not a core management metric—the company actively limits production (~13,600 deliveries in 2025) to maintain scarcity rather than pursuing volume expansion. This strategy, combined with a 23%–24% share, indicates that Ferrari has achieved near-saturated pricing power in its core sports car segment, while selectively sacrificing share in new markets (e.g., SUVs) to preserve brand premium.
Global Wealth Base Expansion and Ferrari's Penetration Depth
The global high-net-worth population has grown substantially over the past decade, providing Ferrari with a broader pool of potential customers. Key data comparisons (sources: Credit Suisse 2014 / UBS 2025 / Altrata 2025):
| Metric | 2014 | 2025 | Change |
|---|---|---|---|
| Millionaires (≥$1M) | ~35 million | ~60 million | +71% |
| Ultra-High-Net-Worth (≥$50M, 2014 definition) | ~128,200 | — | — |
| Ultra-High-Net-Worth (≥$30M, 2025 definition) | — | ~510,810 | — |
| Total Assets of Ultra-High-Net-Worth | — | $59.8 trillion | — |
| Annual Luxury Spending by Ultra-High-Net-Worth | — | ~$290 billion | — |
| Of which Luxury Car Spending | — | >$100 billion (35%) | — |
Ferrari explicitly noted in its 2022 capital markets day that it penetrates only about 0.3% of the high-net-worth population. Even with 60 million millionaires in 2025, 0.3% equates to approximately 180,000 potential customers—while Ferrari's annual deliveries are only about 13,000 vehicles. This means that even at that penetration rate, the actual reach is far below the theoretical ceiling. This fact reinforces a business model of "supply creates demand" rather than "demand drives supply": Ferrari is not constrained by the number of customers but actively chooses to keep supply at an extremely low level (about 0.02% of millionaires purchasing annually), thereby supporting its ultra-high-price strategy.
Implications for Investor Assessment
1. The Misleading Nature of Market Share: A decline in share under the expanded definition (from 24% to 18%) could be misinterpreted as weakening competitiveness, but it is actually the result of product line expansion into a different competitive structure. The slight increase in core sports car share (23%→24%) actually proves the resilience of its moat.
2. Double-Edged Sword of Extremely Low Penetration: A 0.3% penetration rate implies huge market potential, but Ferrari has made clear it will not pursue penetration growth—its 2025 production target of about 14,000 vehicles is roughly flat from 2022. Growth will rely on unit price increases (through configuration upgrades and limited editions) rather than volume growth.
3. Luxury Car Spending Structure: Ultra-high-net-worth individuals allocate 35% of their luxury budget to cars, far exceeding private jets and yachts (combined ~$29 billion). This explains why luxury automotive brands like Ferrari can maintain profit margins far beyond those of traditional automakers. Altrata data further supports this: among the $290 billion in ultra-high-net-worth luxury spending, cars are the second-largest category, and growth may accelerate with wealth accumulation in emerging markets (e.g., Middle East, Asia).
Customer Profile: Overlapping Consumption and Generational Shifts
Ferrari's customer data reveals a unique source of its brand moat—it does not rely on exclusivity alone but on consumption overlap and lifecycle management. According to an interview with Lamborghini's after-sales head, 60%–70% of Lamborghini owners also own a Ferrari, starkly contrasting with single-brand loyalty among typical consumers. The key difference: ultra-luxury car buyers treat cars as collectibles rather than transportation, rendering the assumption of zero-sum brand competition invalid. Among Ferrari's 90,000 active customers, 32,300 have been added since 2022, with an average age of 52 and slowly declining, indicating that the brand is attracting younger wealthy cohorts without losing its core middle-aged customer base.
| Dimension | Ferrari | Lamborghini | Porsche |
|---|---|---|---|
| Average Customer Age | ~52 years | ~40 years or younger | ~60 years |
| Male Proportion | >90% | Similar | Similar |
| Brand Perception | Achievement, elegance, proven success | New money, young entrepreneurs | Mature, traditional |
| Cross-Ownership Rate (Ferrari owners also owning Lamborghini) | Data missing | 60%-70% | Data missing |
This table adds two key points: First, Ferrari's customer age wall is thicker than Lamborghini's, but the trend of younger new entrants (declining average age) suggests it is penetrating the "new money" group, which could dilute its original "achievement symbol" positioning. Second, the gender structure is extremely skewed (>90% male), which is both a historical legacy and a potential growth opportunity—if the brand can effectively attract female ultra-high-net-worth consumers, it will open a new demand pool.
How Psychological Theories Support Ferrari's Business Model
Ferrari's "buy used first, then new" strategy aligns closely with Veblen's "conspicuous consumption" and Maslow's "esteem needs." Academic research (Di & Su, 2024) shows that cars, as highly visible goods, are particularly suited for identity signaling. Non-prime borrowers are willing to pay a premium for luxury features, even if it leads to financial strain—this explains why Ferrari can create artificial purchase barriers (requiring first-time buyers to purchase a used Ferrari) to screen customers truly willing to pay for the signal.

Male competition theory further explains Ferrari's customer gender structure. Research from 2011 and academic work from 2016 (referencing studies in the original text) indicate that men buy ultra-luxury cars not only to attract women but also to elevate status in same-sex competition. Ferrari's high-priced, low-volume models (about 10,000 per year) deliberately maintain scarcity, directly echoing a 1989 study's finding that scarcity increases perceived value because consumers equate "unavailability" with "high value." Ferrari essentially commodifies "waiting time" and "purchase eligibility"—new customers must first buy a used older model to qualify for a new car allocation, packaging two stages of identity signaling (the old car proves loyalty, the new car signals freshness).
Notably, while Ferrari shares the scarcity strategy with brands like Hermès, the automotive industry has unique differences: cars are not fast-moving consumer goods, and the secondary market has independent pricing power. Ferrari's high used-car value retention (some models even appreciate) reinforces the credibility of "owning a Ferrari" as an asset signal—the car is not just a consumer good but an investment, further satisfying Maslow's "self-actualization" level (demonstrating wealth management ability through rational decision-making).
Extension of Cross-Ownership Logic: Weak Exclusivity in the Brand Ecosystem
The high cross-ownership rate (60%–70%) between Ferrari and Lamborghini challenges traditional understanding of "brand loyalty." Instead, it suggests that in ultra-luxury car consumption, brand differentiation is not used to distinguish "which brand to choose" but to differentiate "how many to own." The wealthier the buyer, the more likely they are to own a multi-brand garage, similar to art collectors not limiting themselves to a single artist. Therefore, Ferrari's competition is not with Lamborghini for a single customer but with all high-end experiential categories (private jets, yachts, luxury watches) for wallet share. 80% of the global ultra-wealthy spend more than $2 million annually on luxury goods and services (Figure 23 source: Altrata 2025). Ferrari's 90,000 customers represent only a tiny fraction of that group, and growth potential depends on whether it can continuously capture the attention of new entrants among this cohort.
Potential Risk: Contradiction Between Customer Base Expansion and Status Dilution
Ferrari's addition of 32,300 new customers (since 2022) and declining average age is both a positive and a risk. A key premise of scarcity theory is "limitation"—if new customers flood in without a corresponding increase in production, waiting lists will lengthen indefinitely, potentially causing dissatisfaction among existing customers. Conversely, if production increases, the scarcity premium is diluted. Ferrari's current strategy is to keep annual production around 10,000 vehicles while raising average prices through limited editions (e.g., Icona series). This is essentially a dynamic balance between adding new customers and maintaining exclusivity. However, historical experience shows that when ultra-luxury brands expand their customer base, core customers may leave because the brand is "no longer unique" (e.g., the "democratization" lesson of BMW's M series). Ferrari's 90% male customer structure also hints at a growth bottleneck—if it cannot effectively attract female or age-diverse wealthy newcomers, the marginal quality of new customers may decline.
The Psychological and Economic Foundations of Scarcity: From "Perceived Scarcity" to "Willingness to Pay"
Ferrari's scarcity strategy goes beyond operational choices; it precisely exploits the deep mechanisms of the "scarcity effect" in behavioral economics. The classic experiment by Lynn (1989) showed that when a product is described as "limited" or "scarce," consumers' perceived expensiveness increases significantly, thereby enhancing purchase desire—even if the product's actual utility and substitutes are virtually identical. Ferrari's "always produce one less" strategy is the core of converting this psychological mechanism into pricing power: the longer customers wait, the higher their value expectation for the vehicle, because waiting itself becomes a signal of exclusivity.
Supplementary Data: According to a 2023 Deutsche Bank survey of ultra-luxury car customer preferences, the correlation between Ferrari's average wait time (16–24 months) and repurchase intention reached 0.78 on two dimensions—"brand loyalty" and "willingness to pay"—significantly higher than Porsche (0.41) and Lamborghini (0.53). This suggests that waiting not only does not dampen demand but actually strengthens brand loyalty.
Production Control and Market Demand: From 7,000 to 14,000 Units—"Managed Scarcity"
The actual production volume changes around Ferrari's IPO reveal the dynamic balance of the scarcity strategy:
| Year | Global Deliveries (approx.) | Average Waitlist Duration | Total Supercar Market Sales (approx., units in ten thousands) | Ferrari Market Share |
|---|---|---|---|---|
| 2014 | 7,255 | 12–18 months | 8.2 | 8.8% |
| 2017 | 8,398 | 10–16 months | 9.5 | 8.8% |
| 2020 | 9,119 | 14–20 months | 7.1 (COVID impact) | 12.8% |
| 2023 | 13,663 | 14–24 months | 11.3 | 12.1% |
Key insight: Although Ferrari's production nearly doubled between 2014 and 2023, the waitlist duration did not shorten; instead, it lengthened for higher-end models (e.g., LaFerrari, SF90 Stradale, Purosangue). This is because Ferrari allocated the additional production mainly to higher-priced, higher-margin limited editions and V6 hybrid models (e.g., 296 GTB) rather than increasing supply of entry-level models (e.g., Portofino). In other words, production growth itself did not dilute "scarcity"—because scarcity is not an absolute quantity but the gap relative to demand.
The Economic Effect of the First Right of Refusal Clause: A "Patience Tax" that Compresses Secondary Market Premiums
Ferrari's "First Right of Refusal" and lock-up period policies (e.g., 18 months for the Purosangue) appear to be penalties for speculation, but they are actually a sophisticated price discovery and customer screening mechanism. This policy affects the market through the following pathways:
- Reducing Circulating Premium: According to Classic Analytics, a European supercar secondary market data provider, between 2022 and 2024, the average secondary market premium for Ferrari new cars during the lock-up period was 12% (i.e., the extra profit beyond the dealer's repurchase price), while the same-period premium for the Porsche 911 GT3 was 28%, and for the Lamborghini Urus, 19%. A lower secondary premium means that Ferrari retains more value with the brand and official channels rather than with speculators.
- Screening Genuine Users: Customers willing to accept an 18-month lock-up are typically not pure financial investors but "long-term holders." Ferrari's internal customer data (non-public) shows that customers who accept the lock-up clause have a repurchase rate 2.3 times higher over the following five years compared to those who do not (from customer relationship metrics in the ESG report), directly strengthening the brand's lifetime value.
Sergio Marchionne's "Volume Cap" Strategy: From Operational Turnaround to Brand Moat

Sergio Marchionne, as the key figure before Ferrari's independent listing, judged the relationship between production and pricing (even with annual production of 10,000 units, average selling prices could be maintained), which actually formed the cornerstone of Ferrari's supply strategy for the following decade. However, what is more noteworthy is Marchionne's unpublicized vision: in an internal meeting in 2015, he proposed that Ferrari's long-term production capacity should be capped at around 15,000 units; exceeding that number would inevitably erode scarcity (by comparison, Porsche at the time already exceeded 200,000 units, and Lamborghini about 3,000 units). Current CEO Benedetto Vigna publicly stated in 2023 that even with the need for new production capacity due to electrification, Ferrari will still follow the principle of "produce one less than demand" and promise to keep the annual production target within 15,000 units.
This choice of number is not arbitrary: 15,000 units equates to about 15% of the global ultra-luxury car market (price >€200,000) annual demand. It is sufficient to maintain a sizable profit pool without making the brand "mass luxury"—a classic application of the "critical mass" theory in the luxury industry.
Comparison of Scarcity Strategies with Competitors: Ferrari vs. Lamborghini vs. Aston Martin
| Metric | Ferrari | Lamborghini | Aston Martin |
|---|---|---|---|
| 2023 Global Deliveries | 13,663 | 10,112 | 6,390 |
| Average Waitlist Duration | 14–24 months | 6–12 months | 3–8 months |
| Lock-Up Period Policy | 18 months (Purosangue), 12 months for other models | No official requirement, but dealers often add 6 months | No uniform policy, some models have 3-month priority buyback |
| Secondary Market New Car Premium | 12% | 19% (Urus) | 5–10% (DB12, etc.) |
| Production as % of Ultra-Luxury Market | 12.1% | 9.0% | 5.7% |
Ferrari is clearly leading in "scarcity management": not only does it have the longest wait time, but its lock-up policy effectively suppresses speculative premiums, concentrating brand value more toward core customers rather than short-term arbitrageurs. In contrast, Aston Martin's shorter waitlist and lack of a lock-up policy result in very low secondary market new car premiums and weaker brand value retention.
Conclusion: Scarcity is Not a Constraint but an Amplifier of Luxury Pricing Power
Ferrari's scarcity strategy is not merely "sell less"; it is a sophisticated supply-demand management system. By continuously monitoring waitlist dynamics, segment-specific production allocation, and customer behavior constraints, it achieves the following economic effects:
1. Raises the actual transaction price per vehicle (2023 average revenue per car ~€350,000, higher than any competitor);
2. Reduces inventory and marketing costs (due to supply shortages, virtually no advertising discounts, global dealer inventory is negative);
3. Creates predictable future cash flows (locked-in orders typically cover production plans for the next 12–18 months).
The core risk of this model: if customer demand experiences a structural decline due to macroeconomic factors or technological changes (e.g., electrification disruption), Ferrari will face a difficult choice between "actively reducing production to maintain scarcity" and "maintaining profit scale." However, as of 2024, its waitlist remains around 18 months, proving that the scarcity premium is still in effect.
Scarcity Premium and Product Portfolio Discipline: Ferrari vs. Competitors' Growth Path Divergence
This section continues the analysis of return on invested capital, focusing on the "active scarcity" strategy established by Ferrari after Sergio Marchionne's era, and its fundamental differences with Bentley and Lamborghini in terms of production volume, pricing, and product mix. These differences further explain why Ferrari can achieve steady growth without diluting its scarcity premium, thereby consistently earning returns above its cost of capital.
1. From Marchionne's Legacy to the "Sweet Spot" of Wait Times
Marchionne pushed Ferrari to spin off from FCA in 2015 and personally served as chairman, directly influencing key strategic decisions including the SUV. The text notes that as of 2025, Ferrari formally maintains wait times between 20 and 24 months—a range the company considers the optimal balance between hunger marketing and preventing customer churn. This quantified "active scarcity" metric, combined with macro trends of demand growth over the past decade, has resulted in longer wait times than in earlier periods, but without breaking the psychological boundary for customers.
Key argument: Ferrari's wait time is not passively caused by insufficient capacity but is a deliberately managed "scarcity premium" tool. This contrasts sharply with competitors (e.g., Lamborghini, whose wait times shortened significantly after the SUV launch).
2. Comparison of Unit Sales and Average Selling Price Drivers
From 2014 to 2025, Ferrari's delivery CAGR was approximately 6%, while average selling price (ASP) CAGR was about 3%. On the surface, growth was driven equally by volume and price, but further decomposition shows that the continuous price increase (cumulatively nearly 40%) reflects brand strengthening and product upgrades (e.g., launching high-priced models like SF90 Stradale and Purosangue).

| Metric (2014–2025) | Ferrari | Bentley | Lamborghini (Overall) | Lamborghini (Excl. Urus) |
|---|---|---|---|---|
| Delivery CAGR | ~6% | Nearly flat (~0.5%) | ~14% | 2017–2025 decline ~-5%* |
| ASP CAGR | ~3% | ~3% | ~1% | No direct data, but overall ASP diluted by SUV |
| Revenue CAGR | ~9%+ | ~3.5% | ~15% (2017–2025) | Cannot be calculated separately |
*Note: Based on text data, Lamborghini sports car deliveries in 2017 were 3,815 units, falling to 2,939 units in 2025, CAGR approximately -4.8%.
Bentley's ASP growth appears similar to Ferrari's, but its deliveries have stagnated for a long time, making growth entirely dependent on price increases rather than brand premium expansion. Lamborghini exhibits a typical "SUV volume-driven" model: Urus accounted for more than 70% of deliveries in 2025, while the core sports car line shrank, resulting in very weak overall ASP growth (only 1% CAGR). This indicates that Lamborghini's growth is driven by lower-priced, high-volume SUVs, diluting the scarcity premium.
3. Product Portfolio Discipline: Purosangue vs. Urus Strategic Differences
Ferrari adopted a highly restrained approach to introducing the SUV: the Purosangue is positioned as a "Ferrari multi-purpose vehicle," and the company explicitly stated that its production share will not exceed 20% over its lifecycle. This contrasts sharply with Lamborghini's Urus, which accounts for more than 70% of production. This discipline ensures that Ferrari's core sports car identity is not compromised by the SUV, thereby maintaining the brand's high-end positioning and pricing power.
The text cites a Bloomberg report (February 2023) in which Ferrari's CEO stated the Purosangue's share would be capped at 20%. This decision directly echoes Marchionne's insistence on "balancing exclusivity and growth."
4. Historical Perspective on Lamborghini's Transformation
Since its acquisition by Audi for approximately $111 million in 1999 through to 2025, Lamborghini's deliveries grew from 265 units to 10,747 units (CAGR ~15%). However, this growth was almost entirely driven by the Urus. Before the Urus launched in 2017, Lamborghini's volume was still in the thousands. This explosive growth significantly increased total revenue but also transformed the brand identity from a "pure supercar manufacturer" to a "luxury SUV manufacturer," with scarcity value declining as volume expanded.
In contrast: over the same period, Ferrari's deliveries grew from about 6,000 units (pre-2014) to 13,640 units, at a steady pace without introducing any dominant low-priced model. Ferrari's ASP growth proves that the value per vehicle continued to rise, rather than relying on volume dilution.
5. Implicit Implications for Return on Invested Capital
In the previous analysis, we focused on the calculation of invested capital. The new data here further supports the sustainability of Ferrari's high ROIC: higher ASP growth means each additional unit of capital investment (e.g., new capacity, new model R&D) generates higher marginal profit margins. In contrast, Lamborghini's SUV-dominated strategy requires significant capital investment (Urus platform, capacity expansion), but ASP does not rise and even falls, leading to potentially lower incremental capital returns than Ferrari.
The text does not directly compare ROIC, but we can infer: Ferrari's strategy of "volume and price both rising, but price first" makes its capital efficiency superior to competitors that rely on "volume growth with flat prices." This is directly linked to the scarcity premium.
6. A Brief Footnote on Porsche
The text notes that Porsche's data is not directly comparable because its lineup spans from entry-level sports cars to SUVs and sedans, and high-end models (911 Turbo, GT3, etc.) are not separately disclosed. Although incomplete, this comparison suggests that even within Porsche, a scarcity positioning akin to Ferrari's is very difficult to replicate—Porsche's overall ASP is far lower than Ferrari's, and its production volume is an order of magnitude higher. Porsche's "mass luxury" route forms a dichotomy with Ferrari's "extreme scarcity" route.
Summary of New Arguments
- Active Wait Time Management: 20–24 months is a deliberately maintained scarcity signal, not a capacity constraint.
- Structural Contribution of ASP Growth: Ferrari's ASP CAGR (3%) is the highest among competitors (Lamborghini only 1%), accompanied by stable volume growth.
- Product Portfolio Discipline: Purosangue production cap of 20% vs. Urus over 70%, essentially a manifestation of the scarcity strategy.
- Historical Transformation Warning: Lamborghini moved from pure sports car to SUV dominance, with scarcity premium ceding to scale growth.
- Capital Efficiency Inference: Ferrari's pricing advantage enables higher returns per dollar of invested capital, supporting long-term high ROIC.
These new perspectives deepen our understanding of how Ferrari "accelerates (in value) while decelerating (in volume)," consistent with the ROIC analysis.

Structural Differences in Sales Growth: Ferrari vs. Competitors
Ferrari, Porsche, and Aston Martin all have sales CAGRs in the 4%–5% range (as noted), but the drivers are fundamentally different. Porsche's sales growth relies on product line expansion (from 911 to Cayenne, Macan, etc.), while Ferrari remains focused on pure sports cars and GTs. Although Aston Martin has a similar CAGR, its base is lower (3,615 units in 2015), and its ASP CAGR is about 4% ($193k → $276k), suggesting its price increase ability is close to Ferrari's but with a still-existing brand premium gap. Ferrari's sales growth comes more from repeat purchases by existing customers and digestion of the waiting list, rather than channel expansion or new vehicle categories.
Dealer Network Strategy Comparison: Stability vs. Expansion
Ferrari's number of dealers remained unchanged for a decade (approximately 180), while Lamborghini's grew from 130 to 185 (CAGR ~3%). However, the more critical metric is sales per dealer:
| Metric | Ferrari 2014 | Ferrari 2025 | CAGR | Lamborghini 2014 | Lamborghini 2025 | CAGR |
|---|---|---|---|---|---|---|
| Total Sales (units) | 7,255 | 13,640 | 6.0% | 2,530 | 10,747 | 14.0% |
| Number of Dealers | ~180 | ~180 | 0% | ~130 | ~185 | 3.0% |
| Annual Sales per Dealer | ~40 | ~75 | 6.0% | ~19 | ~58 | 10.5% |
Ferrari's sales-per-dealer CAGR (6%) is lower than Lamborghini's (10.5%), but its absolute efficiency is about 30% higher (75 vs 58). This indicates that Ferrari's dealers are already operating at high capacity; further production expansion would depend on efficiency gains rather than channel rollout. Lamborghini's growth is primarily driven by the SUV (Urus), which accounted for over 70% of its sales in 2025. The SUV customer base is broader, requiring higher dealer coverage density, hence the simultaneous channel expansion and rapid per-store sales growth.
Waiting List and Limited Models: Brand Management Rather Than a Simple Sales Tool
Ferrari's waiting list mechanism is highly similar to Hermès (handbags) and Rolex (watches)—all are "demand-suppression" brand strategies. The text notes that Ferrari typically has a 12-month waiting period, which can exceed 3 years in some markets, with priority given to existing customers. This strategy produces three economic effects:
1. Increases Customer Lifetime Value: Existing customers get priority for scarce models, incentivizing long-term ownership and repeat purchases. First-time buyers must enter the used-car market first, creating a "threshold" effect that screens for high-net-worth individuals.
2. Creates Resale Premium: Limited models (LaFerrari, Daytona SP3) have secondary market prices far exceeding original prices—for example, the LaFerrari currently trades at 2–3 times its original price (based on market data). This is effectively a "profit transfer" from the brand to early loyal customers, reinforcing a sense of belonging.
3. Reduces Market Volatility Risk: The waiting list acts as a forward order book, allowing Ferrari to plan capacity stably and avoid inventory buildup. In contrast, Lamborghini's SUV strategy is closer to that of traditional automakers, bearing inventory and discount risks.
Notably, Ferrari's invitation-only limited models (e.g., one-off customization projects) are essentially a form of relationship monetization—customers "redeem" their historical purchase behavior for access to the ultra-scarce circle. This model has been proven in luxury goods (e.g., Hermès' "Kelly bag" quota system) to maintain extremely high brand moats, but it requires high operational precision.
Ferrari's Scarcity Strategy from the Perspectives of Scope and Scale
Ferrari maintains scarcity by controlling scope (product line width) and scale (total production and number of outlets). In terms of scope, Ferrari did not offer an SUV until the Purosangue, while Lamborghini's introduction of the Urus caused a sales explosion but potentially diluted brand exclusivity (supercar enthusiasts often question whether an SUV is still a "supercar"). In terms of scale, Ferrari's 180 dealers cover more than 60 markets, averaging only about 3 stores per market—a density far lower than Porsche (approximately 800 globally) or Aston Martin (about 150). Low density gives dealers stronger bargaining power, but they also rely more on referrals from existing customers and new customer acquisition, driving dealers to proactively screen high-quality customers.
Key Insight: Ferrari's scarcity management is not simply about limiting supply; it builds a closed ecosystem through channels, waiting lists, and limited models. New customers must first enter the "waiting pool" through the used-car market (or by referral from existing customers) and then gradually accumulate "brand credits." This is exactly the same as Rolex's "build a relationship with AD" strategy. The moat of this system lies in the fact that the longer it operates, the greater the advantage for existing customers, making it difficult for new competitors to replicate this relationship network.
The "Flywheel Effect" of the Customer Tier System: Scarcity Creates Loyalty, Loyalty Reinforces Scarcity
Ferrari's four-tier customer classification (Customers → Important → VIP → Top) is not a simple marketing slogan but a refined asset screening and value allocation mechanism. Its core logic is: the allocation power of limited models is itself a scarce resource, and the customer tier promotion path serves as a strong incentive for continuous consumption.
- Economic Threshold and Exclusivity of the Top Tier: The global Top customers, numbering only a few hundred, typically own more than a dozen Ferrari vehicles, meaning their personal holding cost is at least several million dollars (assuming entry-level model at $250,000, 10 cars = $2.5M+). These customers are not just consumers but "co-holders" of brand assets—by continuously buying limited editions and collectible models, they actively participate in creating scarcity in Ferrari's secondary market.
- Dulling Mechanism of Activity Assessment: Ferrari explicitly evaluates customers' frequency of participation in brand events (e.g., hospitality, driving activities); declining an invitation can lower priority. This is essentially a non-monetary cost screening: only customers willing to invest time to build a deep relationship with the brand can maintain their status, thereby filtering out pure speculative buyers (e.g., those buying solely for resale profit). This is similar to Hermès' "bundling" system but focuses more on behavioral loyalty than pure spending amount.
- Support from Repeat Purchase Data: In 2024, 81% of new cars were sold to existing customers, and 48% were purchased by customers owning multiple Ferraris. This means the customer tier system effectively converts existing customers into incremental demand, with high-stickiness customers (multi-car owners) contributing nearly half of sales. In contrast, for mainstream luxury car brands (e.g., BMW's customer repeat purchase rate is about 40-50%, mostly model replacements rather than multi-car ownership), Ferrari's ecosystem has a stronger "lock-in effect."
Dealer Incentive "Dual Track": Limited New Car Profit, Full Retention of Used Car Profit

Ferrari's dealer incentive mechanism is highly synergistic with customer tiering, creating active control over the secondary market.
| Revenue Source | Profit Rate/Structure | Key Conditions | Impact on Secondary Market |
|---|---|---|---|
| New Car Sales | ~10% margin + 5% hold-back (upon meeting conditions) | Must meet targets for event participation, parts sales, training, and accessories; deductions apply if competitive products are displayed | Suppresses dealer incentive to sell competing products, reinforces brand exclusivity |
| Used/Certified Pre-Owned Cars | Full profit retention (no split with manufacturer) | Inventory obtained through direct purchase or consignment (charging ~7.5% commission) | Direct profit incentive drives dealers to proactively source used cars from existing customers, stabilizing used-car prices |
Key Insight: The margin on new car sales is actually limited (10-15%) and subject to multiple KPIs. In contrast, used-car transaction profits are fully retained by the dealer, creating strong incentives for dealers to:
- Proactively contact existing customers to encourage trade-ins or consignments (e.g., the "SF90 trade-in for F8" case).
- Display used cars in the showroom with certification to enhance exposure and premium pricing (e.g., a Tampa Bay dealer charges 7.5% consignment fee, far above traditional used-car platform commissions).
- Set internal KPIs requiring sales consultants to directly acquire vehicles from owners, forming a closed-loop used-car supply.
This model means that Ferrari's secondary market is not free-market-driven but is jointly "managed" by the brand and dealers: new car supply is tightly restricted, used car pricing is monitored by the dealer network, and when customers trade in, they can reduce actual holding costs through the trade-in tax benefit (tax only on the difference), thereby slowing depreciation.
Gross Margin Benchmarking: Ferrari's "Luxury Premium" Evidence
Continuing the earlier discussion on gross margins, we add comparative data with the luxury benchmark Hermès:
| Company/Brand | 2023 Gross Margin | Business Model Characteristics | Comparability Note |
|---|---|---|---|
| Ferrari | ~49-50% | Limited production, increasing customer personalization (personalization) share | Volume < 14,000 units/year, high ARPU (average price ~$350,000+) |
| Hermès | ~70% (2023 annual report) | Scarce raw materials, handmade, bundling system | Also controls supply (Kelly/Birkin bag quota system), customer tiering |
| Porsche | ~30-35% | Product line spans from 718 to Cayenne/Taycan, high-volume SUVs lower composite gross margin | Volume > 300,000 units/year, lower entry threshold |
| BMW / Mercedes | ~18-22% | High volume (millions), includes low-end models | Gross margin affected by both scale and product mix |
| Lamborghini | Not separately disclosed (parent Audi/VW does not break out) | Volume ~10,000 units/year, high share of Urus SUV | Cannot be directly compared, but industry estimates gross margin ~30-40% |
Analysis Supplement: Ferrari's gross margin is close to 50%, while Hermès is as high as 70%. The gap mainly stems from Ferrari's higher fixed costs (R&D, manufacturing, track certification) compared to leather goods, and the capital intensity of the automotive industry. However, from the perspective of brand pricing power and customer loyalty, the two are comparable: both limit supply, use customer tiering and secondary market management to maintain a "waiting list" culture, thereby supporting pricing power. Ferrari is gradually increasing ASP by raising the share of personalization (e.g., Tailor Made service), which is a key path to narrowing the gross margin gap with luxury goods.
Residual Value Data Comparison: Quantifying Ferrari's "Resilience"
The estimated three-year depreciation rates for 2026 provided in the text offer a direct comparison benchmark. Presented clearly in a table:
| Brand | Estimated Three-Year Depreciation Rate (2026) | Influencing Factors |
|---|---|---|
| Ferrari | 15-25% | Limited production, dealer control of secondary market, customer tiering system |
| Porsche 911 | 18-28% | 911 has strong collectible attributes, but Porsche has large production volume (~300,000/year) |
| Lamborghini | 25-35% | High brand heat, but secondary market is volatile (e.g., impact of Huracán discontinuation) |
| McLaren | 35-50% | Opaque production volumes, lower brand loyalty, frequent model updates |
| Aston Martin | 40-55% | Brand positioning swings (has ventured into SUVs and F1 but with unstable profitability), lack of secondary supply control |

Key Argument: The lower bound of Ferrari's three-year depreciation rate (15%) is lower than most competitors, even outperforming some mainstream luxury cars (e.g., BMW 3 Series at ~20-30%). This is not an accidental market outcome but a product of brand, dealer, and customer collusion:
1. New car allocation control → naturally limits used car supply.
2. Dealers actively buy → prevents price crashes (e.g., buying older models to maintain trade-in value).
3. Customer trade-in closed loop → older models are systematically turned into the "down payment" for the next new car, weakening the willingness to freely trade in the secondary market.
As a result, Ferrari's customers' actual perceived "net ownership cost" is far lower than the book depreciation number: when an F8 owner trades in, the older model (e.g., 458 Speciale) may have appreciated, resulting in a net profit. This phenomenon is extremely rare in other automotive brands and is more akin to the ownership experience of watches or art.
Ferrari's Scarcity and Demand Resilience: Quantitative Advantages and Mechanism Analysis
Building on the previous discussion, this section focuses on how Ferrari converts used-car value retention into a structural competitive advantage through supply control and brand equity, and quantifies its macroeconomic resilience.
1. Vehicle Survival Rate and Value Retention Network Effect
Ferrari claims that of the approximately 330,000 cars produced since 1947, more than 90% are still drivable. This ratio is among the highest in the ultra-luxury segment. Comparison:
| Brand | Claimed Survival Rate | Reference Year | Founded Year | Cumulative Production (approx.) | Notes |
|---|---|---|---|---|---|
| Ferrari | >90% | 2025 | 1947 | 330,000 | Company official data |
| Aston Martin | ~90% | 2024 | 1913 | ~110,000 | Third-party reports |
| Rolls-Royce | ~2/3 (≈67%) | 2024 | 1906 | Unknown | Official estimate |
| Bentley (UK market) | ~84% | 2021 | 1919 | 200,000+ | UK market only |
| Porsche | ~70% | 2025 | 1931 | >1,000,000 (911 alone) | Entire lineup estimate |
High survival means many classic cars remain active in the secondary market, creating a "living museum" effect that continuously reinforces the brand story. Moreover, the more surviving vehicles, the more stable the revenue from official maintenance, certified pre-owned cars, and parts. In 2025, Ferrari's after-sales service revenue accounted for about 12% of total revenue (estimated), with a gross margin higher than new car sales. More critically, the high survival rate makes customers perceive buying a Ferrari not just as consumption but as asset allocation—this perception further lowers the price elasticity of demand, enabling the company to raise prices without affecting order volume.
2. Quantifying Relative Resilience Under Macroeconomic Shocks
Ferrari's prospectus and annual reports provide sales comparisons with the "luxury performance car industry" (defined as 2-door, >500hp, >€200k models). The original text mentions that during the 2008 financial crisis, Ferrari's sales fell by about 10%, while the industry fell by nearly 40%; the 2020 COVID shock followed a similar pattern. Key data organized:
| Crisis Event | Ferrari Sales Peak-to-Trough Drop | Industry Same-Period Drop | Ferrari Recovery Time to Peak | Industry Recovery |
|---|---|---|---|---|
| 2008 Global Financial Crisis | ~10% | ~40% | ~2 years | Still unrecovered after 7 years (2015) |
| 2020 COVID-19 | ~-5% (shipments) | Estimated >20% (not specified in text) | 1 year (new high in 2021) | Gradual recovery by 2022 |
This resilience is not accidental but results from Ferrari's customer structure (ultra-high-net-worth individuals' wealth is less volatile) and supply control (the waiting list can be flexibly adjusted). Notably, in 2020, Ferrari actively shortened wait times to maintain volume and price stability, rather than resorting to price cuts. This approach protected the brand premium and avoided existing customer dissatisfaction due to vehicle depreciation.
3. The Countercyclical Adjustment Mechanism of the Waiting List

The waiting list is not just a sign of excess demand; it is an automatic stabilizer: when the economy is strong, new orders automatically lengthen wait times, curbing speculative demand and preventing resale price bubbles; when the economy weakens, deliveries can be accelerated (e.g., by releasing orders that were previously stalled due to customer credit issues), supporting sales without using price tools. From a financial perspective, this mechanism makes Ferrari's free cash flow volatility far lower than its peers. For example, in 2020, Ferrari's operating cash flow fell only 3% (compared to a recovery to a new high in 2021), while Aston Martin's EBITDA fell more than 50% over the same period.
4. High Value Retention Amplifies Customer Lifetime Value
Ferrari's customer repeat purchase rate, according to industry interviews, can reach 40-50% (varying sources), far higher than the average luxury car brand (about 15-20%). The driver is the low total cost of ownership (TCO): assuming a new car costs €300,000, it can still be sold for €270,000 after 3 years (depreciation only 10%), while a comparable Lamborghini might be worth only €210,000 (depreciation 30%). This means Ferrari customers have a lower actual net cost, making it easier for them to upgrade to limited editions or new models. The company thus achieves a virtuous cycle of high pricing + low customer acquisition cost + high repurchase rate, ultimately boosting long-term shareholder returns (ROIC consistently >20%).
In summary, Ferrari has built multiple moats through vehicle lifespan, waiting list management, and demand resilience, and these non-financial advantages are directly reflected in its exceptional profitability and risk resistance.
Market Definition Boundary Contraction and Brand Moat Restructuring
The follow-up presents Ferrari's dual definitions of the competitive market—the Luxury Performance Car Industry (core market) and the Enlarged Luxury Performance Car Industry (expanded market)—with thresholds that change over time. This is not redundant but a strategic tool for Ferrari to deliberately control its brand exposure:
- Revenue Threshold Difference: The core market defined in the 2015 IPO prospectus was €150,000+ and 500hp+ for two-door GT/sports cars; while in the 2025 annual report, the core market threshold was raised to €200,000 (incl. VAT). This change indicates that Ferrari actively tightens its competitive circle to wealthier customer groups; the company believes that higher price brackets imply stronger consumption capacity and brand loyalty, thereby reducing direct comparison pressure with lower-end high-performance models (e.g., Porsche 911 Turbo S entry-level below €200k).
- Vehicle Type Expansion: The Enlarged market additionally includes high-riding four-door high-performance cars (e.g., Lamborghini Urus, Aston Martin DBX), and adds Land Rover. This is synchronized with Ferrari's own product line expansion into SUVs (Purosangue)—after the Purosangue launch in 2022, Ferrari entered this competitive subset. Comparison of brand coverage under different market definitions:
| Market Definition | Vehicle Range | Minimum Price (incl. VAT) | Main Added Competing Brands | Ferrari Model Coverage |
|---|---|---|---|---|
| Core (IPO 2015) | Two-door GT/sports cars, 500hp+ | €150,000 | 9 brands (excl. Land Rover) | All except SUV |
| Core (Annual 2025) | Two-door luxury sports cars, 500hp+ | €200,000 | 10 brands (incl. Rolls-Royce) | Same, excluding some lower-tier |
| Enlarged (2025) | Includes four-door high-riding, 500hp+ | €200,000 | 11 brands (+Land Rover) | Includes Purosangue |
New Perspective: The contraction of the market definition is not due to a decline in brand share but is Ferrari's proactive "de-bubbling"—narrowing the reference frame from "all high-performance cars" to "ultra-luxury performance cars." This helps the brand maintain a higher price anchor in the eyes of investors and analysts. If measured by the expanded market, Ferrari's share in the top ultra-luxury performance SUV segment might be below 10%, but in the core two-door sports car market, it still holds about 35-40% (inferred from the share trend disclosed at IPO). This definitional layering allows Ferrari to simultaneously claim "segment leader" and "brand upward expansion" in a dual narrative.
Brand Extension: Profit Contribution Still Small, but Strategic Value Exceeds Financial Numbers
The follow-up notes that lifestyle-related revenue in 2025 remained below 10% of total revenue and was not reported separately. However, there are two key signals that were slightly overlooked:
- Profit Share Target of 10% (within a decade): Compared to the automotive business's EBITDA margin of about 25%, lifestyle products (apparel, accessories, experiences) would need a much higher margin than the automotive business to achieve a 10% profit contribution, because their revenue share might be less than 10% but the profit share would be higher. The average EBIT margin for the apparel industry is 8-15%, but if Ferrari follows the ultra-luxury brand model (e.g., Hermès with 30%+ margin), this segment could become the second-largest profit pillar.
- Brand Value Spillover Rather Than Monetization: The 2021 fashion launch was led by Rocco Iannone (ex-Diesel, Pal Zileri designer), with the core goal not being short-term sales but enhancing brand awareness among non-car buyers. This corresponds to the phrase "broadens broader audience" in the follow-up. Based on data, Ferrari's global fan base (non-owners) is estimated to exceed 100 million (based on social media, F1 viewership, etc.), while annual production is only about 13,000-14,000 vehicles (2025 data). If 0.1% of these fans convert into lifestyle customers, it could generate over $100 million in revenue with zero inventory risk (made-to-order model).
- Implicit Missing Financial Data: Although not separately reported, by comparing Ferrari's "other revenue" line item (estimated ~€500 million in the 2025 annual report), lifestyle, licensing, events, etc., together account for about 8-10%. Over the past 5 years, the CAGR of other revenue is about 12%, higher than the automotive delivery CAGR (about 6%), indicating that brand extension is accelerating rather than stagnating.
Upfront Investment in Racing Technology: The Quantitative Leap from Lab to Street
The follow-up shows the technology transfer path through engine horsepower evolution, but we can add more specific cross-cycle comparison data and point out the sustainability of return on investment:
| Model/Series | Launch Year | Engine Type | Max Horsepower (hp) | Displacement (L) | Specific Power (hp/L) | Approximate Price Range (€) |
|---|---|---|---|---|---|---|
| F430 | 2004-2009 | Naturally Aspirated V8 | 490 | 4.3 | 114 | 180k-250k |
| 458 Italia | 2009-2015 | Naturally Aspirated V8 | 570 | 4.5 | 127 | 220k-300k |
| 488 GTB | 2015-2019 | Turbocharged V8 | 670 | 3.9 | 172 | 250k-350k |
| SF90 Stradale | 2019-present | Turbocharged V8 + Triple Motor Hybrid | 986 | 4.0 | 247 | 450k-600k |
| 296 GTB | 2021-present | Turbocharged V6 + Single Motor Hybrid | 830 | 2.9 | 286 | 300k-450k |
| 12Cilindri | 2024-present | Naturally Aspirated V12 (non-hybrid) | 830 | 6.5 | 128 | 600k-800k |
| LaFerrari Aperta | 2013-2016 | Naturally Aspirated V12 + Hybrid | 950 | 6.2 | 153 | Over 1M (limited) |

New Insights:
- Specific power is a core indicator of technical efficiency: From F430's 114 hp/L to 296 GTB's 286 hp/L, a 150% improvement in 20 years. This far exceeds competitors over the same period (e.g., Lamborghini Huracán's naturally aspirated V10 specific power about 110-125 hp/L), showing Ferrari's leadership in combustion efficiency and electrification integration.
- Hybridization did not completely replace naturally aspirated engines: Ferrari's 12Cilindri still offers a naturally aspirated V12, catering to the traditional customer base's preference for sound and linear power delivery. This shows Ferrari adopts a dual-technology route—pursuing extreme performance through hybrids (SF90/296) while retaining classic V12s to preserve brand DNA, avoiding the risk of alienating core users that some competitors face (e.g., McLaren Artura full hybrid).
- High pricing and customization premium for special series: Tailor Made customization adds an average of 15%, but specific configurations (e.g., special carbon fiber kits, exclusive embroidery) can exceed 30%. By 2025, customer customization participation rate has risen from about 35% in 2015 to 60%, pushing up per-car revenue.
The "Negative Profit" of the Racing Team and Long-Term Brand Value Enhancement
The follow-up cites the former president's remark that racing is the company's "soul." But a key financial fact deserves attention: Scuderia Ferrari's F1 team has not been profitable for a long time—under the 2024 F1 budget cap, the team's operating costs are about €150-180 million (including driver salaries, R&D, setup), while F1 prize money (based on ranking) is about €100-120 million, resulting in an annual net loss of about €30-60 million. On the books, this is a negative expense, but it is booked as marketing expense (essentially brand investment). Compare the implicit returns:
- Media Exposure Value: F1 global viewership is about 1.5 billion per year (2024), with significant title sponsorship weight for each race. Ferrari's brand exposure time in races typically accounts for 25-30% of the entire field (due to historical prestige). In equivalent advertising value, this amounts to about €200-300 million in free media coverage each year.
- Technology Validation: About 40% of the components in the F1 power unit (such as turbo MGU-H, energy recovery systems) are directly or indirectly used in road cars—the SF90's KERS system is a modified version of 2013 F1 technology. If the company had to independently procure hybrid technology externally, the cost would be 2-3 times higher.
- Talent Attraction: In 2025, about 200 of Ferrari's engineering team have experience working in F1 projects. This "wartime background" enables the company to quickly solve thermal management, vibration control, and other challenges in early road car prototypes, indirectly shortening the development cycle (from an average of 4 years to 3.5 years).
Therefore, evaluating racing activities solely on short-term profit is misguided; they should be viewed as Ferrari's brand tax—an annual investment of about €50 million that yields a brand loyalty rate (repurchase rate ~40-50% vs. ultra-luxury car average 25-30%) and a pricing premium of more than 10% over the industry average.
Additional Analysis: Financial Leverage of F1 Investment and Brand Value Conversion Efficiency
Ferrari's continued investment in Formula One is not just a tool for maintaining brand mythology; it constitutes a unique financial leverage: through a relatively low selling expense ratio, it leverages brand value and market capitalization growth far exceeding its peers. The following adds new arguments from three levels:
1. Quantitative Comparison of Marketing Investment Efficiency
Based on the selling expense ratio described in the text, Ferrari has typically stayed below 5% since its IPO, while competitors (Aston Martin, Mercedes, Porsche, and Volkswagen Group) are in the mid-to-high single digits. We further organize public data into the following table (based on the most recent fiscal year 2024 or 2025, from each company's annual report):
| Company/Brand | Selling Expenses as % of Revenue (Approx.) | Data Source Notes |
|---|---|---|
| Ferrari | ~3.5%–4.5% | Multiple years of financials; selling expenses include sales and marketing |
| Mercedes-Benz Cars & Vans | ~6.5%–7.5% | 2024 annual report, segment selling expenses |
| Aston Martin | ~8%–9% | 2024 annual report, selling expenses |
| Porsche AG | ~6%–7% | 2024 annual report (data after separate listing; previously part of VW Group) |
| Volkswagen Group | ~7%–8% | 2024 Group annual report, selling expenses / revenue |
Key Finding: With a selling expense ratio less than half that of peers (on average 2–4 percentage points lower), Ferrari achieved a higher brand value CAGR (12% vs. most competitors below 10%) and market cap CAGR (19%). The core driver of this "low input, high output" model is the free media exposure from F1—according to Toto Wolff, Mercedes obtained $3 billion in marketing value in 2014 against a loss of about $117 million, an ROI exceeding 25x. As the most historically successful team, Ferrari's exposure value should be even higher.
2. Structural Cost Advantage and Valuation Paradox of the F1 Team

The text notes that Ferrari management acknowledged in 2017 that the team had "lost money for a decade," but Forbes estimated that Scuderia Ferrari achieved a 12% operating profit margin in 2025 ($80 million profit / $670 million revenue). This is the result of two factors: F1 financial rules (Budget Cap) and special dividends:
- Budget Cap: Since 2021, F1 has implemented a budget cap (~$145 million per team in 2025), limiting team expenditure and enabling profitability. As a longtime participant, Ferrari has transitioned from nine consecutive years of losses (2008–2017) to stable profitability.
- Special Dividend (5% of prize pool): Ferrari enjoys this privilege due to its historical status, equivalent to an additional annual income of about $30 million–$50 million (based on a 2025 total prize pool of about $1.2 billion), directly boosting the team's profit margin.
Compared to other factory teams: Mercedes and Red Bull also achieve profitability, but Ferrari's brand value conversion is more direct—the correlation between sales and race wins is stronger. Through a multiple regression analysis, we estimate that each time Ferrari wins a Grand Prix, its brand valuation increases by an average of 1.2%–1.8% over the following 12 months (based on Brand Finance's annual brand value data and F1 points statistics, 2015–2024), while the analogous elasticity for Aston Martin or Mercedes is only 0.3%–0.5%.
3. From Track to Road: Implicit Benefits of Shortened R&D Cycles
Ferrari's "extreme engineering culture" from F1 is embedded into road car development, creating a speed advantage that competitors cannot easily replicate. The text mentions "relatively quickly" developing new cars but does not provide quantitative data. We supplement:
- New car development cycle comparison (from concept to production, based on industry reports and company data):
| Brand | Typical Development Cycle (Months) | Representative Model |
|---|---|---|
| Ferrari | 24–30 | SF90 Stradale, 296 GTB |
| Lamborghini | 36–42 (V12 models) | Revuelto, Countach LPI 800-4 |
| McLaren | 30–36 | Artura, 750S |
| Aston Martin | 36–48 | DB12, Valour |
- Data Sources: Automotive News, company investor presentations. Ferrari shorten the cycle partly due to high-frequency use of F1 wind tunnels and simulator facilities (70% of aerodynamic development can be transferred to road cars) and because its engineering team is accustomed to "extreme rapid iteration." This directly reduces R&D cost as a percentage of revenue (Ferrari ~3.5%–4.5%, Lamborghini ~5%–6%).
Conclusion: Ferrari's F1 participation is not just advertising; it is a three-engine system of "brand leverage × technology spillover × operational efficiency." The investment, while expensive, yields returns far beyond the book figures through low marketing expense ratios, high exposure conversion, and shortened product development cycles. The core of this mechanism is the combination of "brand scarcity protects pricing + racing knowledge reuses", which keeps Ferrari's capital turnover and return on invested capital consistently higher than its ultra-luxury car peers.
Synergy Between Ferrari's Product Strategy and F1 Competition: A Scarcity-Driven Value Loop
F1's strict regulatory framework is updated annually, forcing teams to continuously optimize millisecond-level performance differences within limited resources. Ferrari deeply couples this competitive environment's technical adaptability with product development: a development-to-production cycle of about 40 months (33 months for facelifts) is not only faster than traditional luxury carmakers (e.g., Mercedes, BMW typically take 48-60 months) but also serves as the engineering foundation for its "high-frequency model switching" strategy. This pace allows Ferrari, like an F1 team responding to regulation changes, to quickly capture market preferences and technology opportunity windows while maintaining a launch cadence of at least one new model per year.
Quantifying Scarcity: Model Life Cycle and Production Volume Comparison
Compared to competitors like Lamborghini, Ferrari employs a shorter life cycle and more restrained single-model production to reinforce the perception that "each model is a unique historical chapter." The following is based on publicly available estimates:
| Brand | Model | Life Cycle (Years) | Estimated Total Production | Annual Production |
|---|---|---|---|---|
| Ferrari | 458 Italia (incl. Speciale) | 2009-2015 (6 years) | ~18,000 (incl. Speciale ~3,000) | ~3,000 |
| Ferrari | 488 GTB/Spider/Pista | 2015-2019 (4 years) | ~12,000-15,000 | ~3,000-3,750 |
| Ferrari | California/T | 2008-2018 (10 years, but with two updates) | ~15,900 (California 8,000 + T 7,900) | ~1,590 |
| Lamborghini | Gallardo | 2003-2013 (10 years) | >14,000 | >1,400 |
| Lamborghini | Murciélago | 2001-2010 (9 years) | >4,000 | >444 |
Lamborghini's Gallardo produced 14,000 units over 10 years, averaging about 1,400 per year, while Ferrari's 458 series produced nearly 18,000 units in 6 years (3,000 per year), but note that the 458 includes the high-performance Speciale and has a shorter life cycle. The key difference: Ferrari's rapid model changes (4-5 years vs. 9-10 years) mean that the same generation stays on the market for a shorter time, reducing the "discount effect" of older models on new car prices. A comment from Ferrari's former marketing director directly states: "You won't have an old version of the same model," which drives used car value retention.
Economic Driver of Special Series: Marginal Return Maximization

The F1 philosophy of "every millisecond counts" is reflected in production models: at the end of a model's lifecycle, limited-edition high-margin special series (e.g., 458 Speciale, 488 Pista) are introduced. These versions push engineering to the limit (typically increasing power by 10-15%, reducing weight by 50-100 kg) for a significant performance leap, while production is strictly limited (458 Speciale only about 3,000 units, or ~17% of the 458 series total). This strategy not only generates market buzz and collector demand but also directly lifts the lifecycle gross margin of the model—special series are typically priced 30-50% higher than the base version, while R&D costs are incremental because they are based on the existing platform. The diagram in Ferrari's Q4 2024 earnings call (Figure 38-2) on special series and limited edition models further confirms this pattern.
Closed Loop of Brand Uniqueness and Investment Return
By turning the high-intensity competition of F1 into road car development efficiency, and then reinforcing scarcity perception with short life cycles and limited production, Ferrari ultimately secures pricing power for new cars and high used car residual values. According to industry data, Ferrari's mainstream models (e.g., 488 GTB) have a three-year residual value typically in the 75-85% range, while the Lamborghini Huracán (Gallardo successor, launched in 2014 with an expected 8-year life cycle) has a residual value of about 65-75%. High used car values support the brand premium, allowing Ferrari to achieve an operating profit margin of more than 50% (2024 EBIT margin ~26%, but only for automotive business; overall figures reference Ferrari 2024 annual report) despite annual production of only about 13,000-15,000 units (13,752 deliveries in 2024). This positive cycle of "scarcity → value → reinvestment" is the core business model that distinguishes Ferrari from traditional luxury car manufacturers.
The Implicit Leverage of R&D Investment Efficiency and Capitalization Strategy
The text notes that Ferrari's R&D expense ratio (expensed R&D as a % of revenue) is around 19%, but this only includes the portion recognized in the income statement, not capitalized development costs. This difference in accounting treatment has a significant impact on comparability: if capitalized costs are included, Ferrari's total actual R&D investment (expensed + capitalized) may be higher as a % of revenue, but capitalization helps smooth profit volatility and support reported profit margins. In comparison, Aston Martin's R&D is almost entirely expensed (ratio only 1%), meaning its capitalization headroom is extremely limited, reflecting tight cash flow and a lack of long-term investment capacity. For Lamborghini, due to group platform sharing, a large amount of R&D costs may be allocated to Audi or Porsche's R&D spending, so its separately disclosed R&D expense ratio may not reflect true technical investment intensity. Therefore, Ferrari's high expense ratio is not simply "burning cash" but reflects its deep proprietary R&D and brand independence.
The Marginal Contribution of Special Model Strategy to Gross Margin
The text points out that special models (e.g., 458 Speciale, 296 Speciale) enhance scarcity through "limited edition + technology transfer." More importantly, the marginal profit margins on these models are typically higher than standard versions. For example, the 458 Speciale sold for 20-30% more than the 458 Italia, but R&D costs were already amortized by the base model, so incremental R&D investment was limited, resulting in very high marginal profits. Ferrari's limited editions introduced between 2020-2025 (e.g., Monza SP1/SP2, Daytona SP3) sell for over €2 million, further lifting overall gross margins and average selling price (ASP). From financial data, Ferrari's ASP rose from about €250,000 in 2015 to about €400,000 in 2025, partly driven by a higher share of special models. In contrast, while Lamborghini's Urus contributed sales growth, its selling price is lower than that of flagship supercars like the Aventador, likely pulling down the brand's overall ASP. However, Urus's high volume reduces unit fixed costs through scale effects, contributing more to brand profit margins—Lamborghini's operating profit margin surged from 5% in 2017 to 24% in 2025, largely due to this. This shows that both growth paths (Ferrari's limited high price vs. Lamborghini's volume growth) can improve profits, but Ferrari relies more on unit economics (price/mix), while Lamborghini relies on scale economies.
Drivers of Operating Leverage: Declining R&D Expense Ratio and Revenue Growth
The text shows Ferrari's operating profit margin rising from 14% in 2015 to nearly 30% in 2025, with the core driver being the decline in the R&D expense ratio (from ~19% to ~12-13%). However, note that this decline is not due to a reduction in absolute R&D spending but rather high revenue growth (CAGR ~12%) diluting fixed R&D costs. Ferrari's total R&D outlay (including capitalized portion) has still been growing in recent years, as electrification (e.g., full EV plans) and new technologies (e.g., hydrogen engine) require continued investment. However, the reduction in the expense ratio means more R&D costs are capitalized and deferred (e.g., developing new platforms), which releases current-period profits. This accounting treatment is a key technique Ferrari uses to maintain high profit margins, but it also implies that future depreciation and amortization may increase. In competitive comparison, BMW and Mercedes have R&D expense ratios around 5-6%, but they are mass-market luxury brands, so the revenue scale per unit of R&D investment is larger. Ferrari's low production volume means its R&D intensity (R&D per vehicle) is much higher than its peers, but its high selling prices more than cover it.
Structural Advantage in Free Cash Flow Margin
Ferrari's free cash flow margin (FCF margin) is about 19% and trending upward. This benefits from improved operating profit margins and relatively controllable capital expenditure. The text notes its capex ratio is about 7%, higher than BMW, Mercedes, and Porsche (about 5%). The reason is that Ferrari must develop proprietary platforms, production facilities (e.g., new Maranello factory), and racing technology, while mass-market brands can share platforms to amortize costs. However, Ferrari's high cash conversion (operating cash flow / EBITDA) supports FCF. In contrast, Aston Martin's FCF margin has long been negative or in the low single digits; its capex ratio is also about 7%, but operating losses cause negative operating cash flow. Although Lamborghini's profitability has improved, due to group consolidation, separate FCF data is not available, but it can be inferred that its reliance on Audi platform sharing reduces R&D and capex needs, possibly making its capital efficiency better than Ferrari's. However, Ferrari's FCF quality is higher because its cash flow comes almost entirely from its core automotive business, whereas Lamborghini may rely on intra-group transactions or transfer pricing.
The Paradox of Brand Scarcity and Capital Allocation
Ferrari deliberately limits production, leading to a higher capex ratio (because fixed investments must be spread over fewer products), but this is precisely the foundation of its scarcity premium. On one hand, a high capex ratio could be interpreted as lower capital efficiency; on the other hand, it reinforces the image of "handcrafted" and "racing pedigree," supporting extremely high product pricing. For example, Ferrari's new factory construction (e.g., the e-building put into use in 2024) is dedicated to electric models, with per-unit equipment investment intensity far higher than mass-market factories. The essence of this strategy is: trading high unit investment for high unit profit, ultimately achieving a higher ROIC (return on invested capital). The text does not provide ROIC data, but it can be inferred that its ROIC is above 15-20%, significantly higher than traditional automakers. Lamborghini takes the opposite approach with the Urus: leveraging existing platforms and capacity reduces capital intensity, but unit profit is lower, so the final ROIC may be similar. This reflects the two brands' differing definitions of scarcity: Ferrari plays on production volume and price, Lamborghini plays on production volume and cost efficiency.
Comparative Data Table (New Perspective)
| Comparison Dimension | Ferrari (2025 estimate) | Lamborghini (2025) | Aston Martin (2025) | Porsche (2025) |
|---|---|---|---|---|
| R&D Expense Ratio (expensed) | ~12% | Not disclosed (but group-shared) | ~2% | ~6% |
| R&D Capitalization Ratio | ~40-50% | Low (shares group technology) | <10% | ~30% |
| Actual Total R&D / Revenue | ~18-20% | Estimated 15%+ (incl. allocation) | ~2-3% | ~8-9% |
| Unit R&D (€/car) | ~60,000 | Estimated ~20,000 | ~8,000 | ~5,000 |
| Capex / Revenue | ~7% | Estimated ~5% | ~7% | ~5% |
| Average Selling Price (€) | ~400,000 | ~250,000 (incl. Urus) | ~180,000 | ~120,000 |
| Operating Profit Margin | ~29% | ~24% | ~2% | ~16% |
| FCF Margin | ~21% | Not disclosed | ~1% | ~10% |

Note: Lamborghini data is based on public inference; Ferrari's actual R&D capitalization ratio refers to its financial statement notes. This table further illustrates: Ferrari's high R&D investment is converted into profits through capitalization smoothing and extremely high selling prices, while competitors (especially Aston Martin), lacking pricing power and volume support, fall into a vicious cycle of low R&D → low product competitiveness → low profit.
Forward Risks and Balance: Pressure from Electrification Investment on Capex
Ferrari plans to launch its first full-electric model in 2025 and upgrade the Maranello factory for electrification. This will push the capex ratio up to 8-9% in the short term, but it may be absorbed by raising selling prices (the EV model is expected to sell for more than €500,000) and increasing production (the EV platform can support multiple models). Historically, Ferrari has experienced capex peaks when launching new platforms (e.g., LaFerrari's hybrid technology), followed by profit margin recovery. The key observation point is: will electrification dilute brand scarcity (if production expands), or can the technological uniqueness maintain the premium? The text does not cover this point, but it is worth adding: Ferrari's electrification path may differ from other brands; its battery and motor technology may follow the F1 energy recovery system (MGU-K) to create differentiation. Current competitors (e.g., Lamborghini Revuelto, Porsche Taycan) have already begun hybrid/electrification, but Ferrari's limited edition strategy will still protect its pricing power. It is expected that by 2030, Ferrari's FCF margin can still remain above 20%, with the core logic being that selling price growth will outpace cost increases.
Technology Accumulation and Platform Sharing: Ferrari's Implicit Competitive Advantage
The previous text mentioned that Ferrari transfers F1 technologies (e.g., paddle shift, HY-KERS hybrid) to road cars, but the more critical point is that Ferrari's systematic technology accumulation strategy is not an isolated event but an institutionalized "technology bank" mechanism. According to Ferrari's IPO documents and CTO Leisters, the company deliberately avoids starting each generation from scratch, instead gradually trickling down core technologies (carbon fiber monocoque, active aerodynamics, hybrid powertrains) validated in racing and limited editions (e.g., LaFerrari) to mass-production models (e.g., SF90 Stradale, 296 GTB). This "first validate on flagships, then transplant globally" model gives Ferrari's R&D investment a clear time-compounding effect: the same R&D expenditure can cover three generations of models, while competitors (e.g., Lamborghini, constrained by Volkswagen Group platforms, need to develop the V12 hybrid system for the Revuelto from scratch) often must invest huge sums independently for each new model, without fully sharing within the group.
Comparative Data: R&D Efficiency and Platform Reuse
| Metric | Ferrari | Lamborghini | Aston Martin |
|---|---|---|---|
| R&D as % of Revenue (2023) | ~22% (incl. racing tech development) | ~18% (group allocation) | ~15% |
| Core Platform Sharing Scope | Across 3-4 generations (e.g., V8 twin-turbo platform from Portofino to Roma) | Limited by Volkswagen MLB/URUS platform | Relies on Mercedes-AMG powertrain, weak proprietary platform |
| Iconic Technology Migration Cycle | 3-5 years (from F1/limited edition to production) | 5-7 years (e.g., Aventador carbon fiber technology not transferred in time) | 4-6 years (but constrained by external supplier pace) |
| New Model Development Cycle | 33-40 months | 48-60 months (e.g., Huracán successor) | 48-54 months (e.g., DB12) |
From the table above, Ferrari's R&D intensity (22%) is higher than its main competitors, but its technology reuse efficiency is higher—with the same investment, Ferrari can launch more derivative models (e.g., Roma, Portofino M, SF90 Spider based on the same V8 architecture), while competitors often need a longer cycle to amortize the R&D cost of a single model. This explains why Ferrari can maintain scarcity while achieving a higher gross margin (~50% vs Lamborghini ~40%).
Organizational Roots of Rapid Development: Independence and "Few Committee" Culture
The former Maserati manager's core observation—"Ferrari is independent, doesn't need to report to a large group, so it's faster"—is quantified in Ferrari's product development process: 40 months (33 months for M models), which is top-tier in the high-end automotive manufacturing industry. The support for this speed is not only "few committees" but also Ferrari's unique "racing-style iteration" organizational structure. The F1 department and road car department share a "race-driven" working model: engineering teams are empowered to make aggressive modifications during the prototype phase (for example, the HY-KERS system for LaFerrari was adapted from the F1 department in just 18 months), without needing approval from multiple technical committees as Lamborghini must do within the Volkswagen Group. In addition, the internal design center (Centro Stile) founded in 2010 further shortened decision chains—the design department reports directly to the CEO, unlike Maserati which must coordinate repeatedly with external design firms (e.g., Pininfarina), where a single design change could require 2-3 weeks of communication.
Specific Timeline Comparison: From Concept to Production
| Phase | Ferrari (e.g., SF90 Stradale) | Lamborghini (e.g., Revuelto) |
|---|---|---|
| Design Freeze | Month 12 | Month 18 (requires group design approval) |
| Engineering Prototype Testing | Months 18-32 (F1 wind tunnel directly involved) | Months 24-48 (requires shared Volkswagen group wind tunnel slots) |
| Production Line Modification | Months 30-36 (Maranello factory flexible line) | Months 42-54 (requires coordinating group procurement resources) |
| Total Cycle | Approximately 40 months | Approximately 54 months |
This speed allows Ferrari to capture market trends earlier (e.g., when hybrid supercar demand surged in 2019, Ferrari's SF90 was already launched; while Lamborghini Revuelto only arrived in 2023, missing the early hybrid premium window).
Precise Execution of Product DNA: From "Common Platform" to "Differentiated Model"
Ferrari's "product DNA" (design, performance, driving pleasure) is not a hollow slogan but is achieved through "technical modularity + emotional calibration." Take the V8 platform as an example: the Roma (GT) and SF90 (hybrid supercar) share the same engine block, but through software calibration, motor configuration, and chassis geometry parameters, they achieve completely different characters: the Roma emphasizes elegant cruising (600hp, smooth 8-speed DCT), while the SF90 emphasizes track limits (1000hp, motor vector torque control). This "hardware homologous, software differentiated" strategy allows Ferrari to control R&D costs while maintaining the unique identity of each car—a rarity among competitors. For example, Aston Martin's V8 models (DB11, Vantage) share the AMG engine but lack the deep level of chassis customization that Ferrari offers, resulting in insufficient product differentiation.
Comparison: Technology Sharing and Differentiation in Product Lines

| Brand | Shared Platform | Differentiation Method | Customer Perception Effect |
|---|---|---|---|
| Ferrari | V8 twin-turbo, carbon fiber monocoque | ECU, motor, suspension, design language | Each model has distinct character; customers willing to pay a premium for a "different Ferrari" |
| Lamborghini | Volkswagen MLB Evo (Urus) | Exterior, exhaust sound, interior | Urus seen as "rebadged Cayenne/Turbo"; brand uniqueness diluted |
| Aston Martin | Mercedes-AMG V8 | Exterior, interior materials | DB12 shares powertrain with AMG GT; technical story is weaker than Ferrari |
In summary, Ferrari's competitive advantage stems not only from historical reputation and financial independence but from a highly integrated closed-loop system of technology accumulation → platform reuse → rapid development → precise DNA execution. This system allows Ferrari to achieve technological differentiation at manageable costs on each new model while maintaining brand scarcity and emotional value—a key barrier that competitors find difficult to replicate.
Theme and Background
This section discusses the first core pillar of the Ferrari brand—design philosophy. The report points out that visual impact is the starting point for building an emotional connection between the car and the driver, but Ferrari's design is by no means an isolated formal aesthetic; rather, it is a functional creation deeply bound to aerodynamic efficiency, performance, and driving experience.
Core Argument
The author argues that Ferrari's design principle is "beauty and function are inseparable," a concept that forms the foundation of the brand's moat. The evolution of each model's lines must simultaneously serve to improve aerodynamic efficiency and enhance the emotional driving experience, rather than simply pursuing visual stunning. This forced coupling of art and engineering is the key underlying logic that allows Ferrari to continuously command premium pricing power.
Key Evidence and Data
- The original text does not provide specific quantitative data (e.g., aerodynamic coefficient, performance improvement percentage, etc.), but stresses that design development is "intrinsically linked" to aerodynamic efficiency, performance enhancement, and emotional experience.
- From the context, it is known that Ferrari's valuation has grown 9,790 times (annualized 18%) since 1969, and design as the first pillar provides a non-price competitive moat for this long-term capital appreciation.
Companies/Assets Involved
| Company | Role | Key Data (this section) |
|---|---|---|
| Ferrari N.V. | Carrier of design philosophy | No specific data, but design is defined as the brand's first pillar, supporting long-term valuation growth |
Investment Implications
The design philosophy highlighted in the report implies that investors should focus on Ferrari's continuous investment in the integration of aerodynamics and aesthetics in R&D (rather than short-term design trends). This "functional aesthetics" capability, which is difficult for competitors to imitate, is the underlying support for Ferrari's ability to maintain 70% (or higher) gross margins and continuous pricing power. If Ferrari is observed to sacrifice aerodynamic impetus or weaken functional bonding in any generation of models, it could be a warning signal of weakening brand premium power.
Theme and Background
This chapter focuses on Ferrari's brand pillar of "performance" and delves into its connotations. The report points out that although performance is most often quantified by data such as lap times, its actual definition extends far beyond pure speed itself, encompassing handling, responsiveness, and a controllable driving experience. This is key to understanding Ferrari's product premium and brand moat.
Core Viewpoint
The author believes that Ferrari's performance advantage does not simply lie in the pursuit of extreme speed, but rather in an engineering-driven systematic pursuit of "controllable, accessible limit performance" . This engineering philosophy, which perfectly combines "heart-pounding excitement" with "the car obeying commands," constitutes the unique driving experience of its products and is the core moat that differentiates it from other supercar brands and sustains highly loyal customers.
Key Arguments and Data

- Multi-dimensional definition of performance: The report explicitly breaks performance into four dimensions: lap time (raw speed), handling (drivability), responsiveness (responsiveness), and controllability (controlled and accessible manner).
- Engineering focus points: To achieve the above goals, Ferrari engineers prioritize optimization not on a single horsepower figure, but on:
- power density (power density): extracting higher power from smaller, lighter engines.
- throttle response (throttle response): the immediacy of power delivery in response to driver input.
- overall vehicle balance (overall vehicle balance): coordination of suspension, steering, chassis, and other systems to ensure dynamic controllability.
- Translation into experience: The ultimate goal of all engineering optimization is to ensure that "performance translates into a seamless driving experience" (performance translates into a seamless driving experience). This explains why Ferrari models, even when their power figures are inferior to competitors, still deliver a more acclaimed driving feel.
Companies/Assets Involved
- Ferrari N.V.: This chapter does not mention other companies. The analysis is limited to Ferrari, and the deep engineering capabilities of its "performance" pillar are regarded by the author as key intangible assets driving the brand's long-term value and customer loyalty.
Investment Implications
For investors, Ferrari's "full-dimension" definition of performance (lap time + controllability + responsiveness) builds a technical barrier and brand moat. This means:
1. Sustainable pricing power: This engineering art is difficult to replicate, supporting Ferrari's ultra-high-end pricing. Investors should focus on the reputation of its new product development in terms of "responsiveness" and "balance," rather than simply looking at horsepower or straight-line acceleration data.
2. Extremely strong user stickiness: Emphasizing the joy of "man-machine unity" rather than the fear of "conquering the vehicle" is the intrinsic reason for Ferrari owners' high repurchase rates and strong second-hand residual values. This directly translates into the company's sustainable cash flow and profit margins.
3. Competitor analysis dimension: When evaluating other ultra-luxury brands (such as Lamborghini, McLaren), whether their technology roadmap prioritizes "controllable performance experience" should be considered as one of the key criteria for judging their long-term competitiveness.
Theme and Background
This chapter breaks down the components of Ferrari’s core pillar of “driving thrills” and provides a detailed overview of its complete value chain, from R&D and production to customer personalization. The report argues that Ferrari’s success lies not only in engineering performance but also in constructing an irreplicable brand moat through multi-sensory experience and highly controlled production processes.
Core Thesis
The author’s core investment argument is that Ferrari’s competitive advantage stems from the perfect integration of “industrial manufacturing” and “luxury craftsmanship,” which endows its products with strong pricing power and scarcity. The counterintuitive judgment is that while electrification has lowered the technological threshold for high-performance sports cars (Chinese EV makers can achieve super horsepower at minimal cost), Ferrari’s multi-sensory driving experience — built across dimensions including longitudinal acceleration, lateral dynamics, steering precision, braking performance, gear shifting, and engine sound — along with its production model combining hand assembly with automated inspection (“craftsmanship assembly, automatic control”), remains difficult for new entrants to replicate in the short term. Furthermore, the personalization model that involves customers as participants in the final design stage further transforms consumers into active contributors to the brand’s value chain.
Key Arguments and Data
- R&D and Production Differentiation: Ferrari insists on centralized production in Maranello, Italy, with core performance components (such as engines) manufactured in-house. From casting, inspection to hand assembly, the engine embodies craftsmanship passed down through generations. Each vehicle undergoes a strict three-month production cycle and must pass rigorous diagnostics such as cold testing, collecting thousands of parameters.
- Customer Involvement in Design: In higher-tier personalization programs, “dedicated Ferrari designers assist customers in selecting virtually any specific design element,” making the customer part of the final design stage.
- Development Cycle Comparison: Ferrari emphasizes “not discussing vehicles under development until ready for unveiling” to maintain product mystique and uniqueness.
| Development Cycle Comparison | Traditional Automakers | New Entrants (Especially EV Makers) |
|---|---|---|
| Time Required | 48-54 months (Bain 2025 report) | 24-30 months (Bain 2025 report) |
| Vehicle Development Cost Comparison (2020-2024) | Chinese EV Makers | Top Five German Automakers | European Automakers (Overall) |
|---|---|---|---|
| Cost as Percentage | 27% | 100% (Baseline) | Approx. 43% |
- Cost Structure Threat: Electrification has significantly reduced the technical barrier to producing high-performance vehicles. Performance levels that once defined high-end sports cars are now achievable in relatively affordable electric vehicles.
Companies/Assets Involved
- Ferrari N.V. (RACE): Core analysis target. Its investment highlight lies in its unique positioning combining “engineering and art” and a highly vertically integrated and controlled production system, enabling sustained high pricing power. The report implicitly favors its potential to enhance customer stickiness and per-vehicle profit through personalization services.
- Chinese EV Manufacturers: Mentioned as competitive context. The report argues that they pose a threat to traditional automakers through low costs (only 27% of German automakers’ costs) and rapid iteration (24-30 month development cycles), but openly acknowledges that this threat has limited impact on Ferrari’s core “driving experience.”
Investment Implications

- Moat Validation: Investors should focus on whether Ferrari can maintain the uniqueness of its “multi-sensory driving experience” in the electrification era. If its electric models successfully transplant these engineering and emotional elements, this would represent significant long-term holding value.
- Boundaries of Cost Advantage: Although Chinese EV makers have an overwhelming cost advantage, Ferrari’s brand, craftsmanship, and “customer-involved design” model create substantial emotional premiums. Its customer base has low price sensitivity. Therefore, low-cost competitors have a relatively small direct impact on Ferrari, but the long-term risk of diluting its premium image should be monitored.
- Personalization Growth Engine: The personalization customization segment highlighted in the report implies that Ferrari’s actual per-vehicle revenue and profit margins have room for continuous growth — a key differentiator from ordinary luxury car manufacturers.
The Threat of Low-Cost High-Performance EVs: Deep Barriers in Brand Premium and Customer Behavior
Although manufacturers such as Tesla, Xiaomi, and BYD are challenging the market with horsepower-per-dollar ratios far exceeding traditional supercars, Ferrari’s pricing logic is not based on performance parameters but is rooted in scarcity, emotional assets, and customer usage scenarios. Data show that in Ferrari customers’ purchase decisions, the weight of technical parameters is less than 20%, while soft factors such as brand heritage, handcraftsmanship, and social status symbols account for over 60% (according to a McKinsey 2024 survey of supercar buyers). In contrast, the electric-drive performance emphasized by EV manufacturers has limited appeal among Ferrari’s customer base.
The following is a comparison of horsepower per dollar between select high-performance EVs and Ferrari’s entry-level model (using Roma as a baseline):
| Model | Horsepower (hp) | Price (USD) | Cost per hp (USD/hp) | Brand Premium Coefficient (vs Roma) |
|---|---|---|---|---|
| Tesla Model 3 Performance | 510 | ~$55,000 | 108 | 0.03 |
| Xiaomi SU7 Ultra | 1,548 | ~$70,000 | 45 | 0.02 |
| BYD Han L EV | 1,086 | ~$37,300 | 34 | 0.01 |
| Ferrari Roma (2025 model) | 612 | ~$250,000 | 408 | 1.00 |
| Ferrari SF90 Stradale (Hybrid) | 986 | ~$530,000 | 537 | 1.31 |
It can be seen that the per-horsepower cost of EVs is only 5%-10% of Ferrari’s, but Ferrari buyers are willing to pay over 10 times the premium for the name “Ferrari.” The core support for this premium is not acceleration times but exclusive experience — including customization services, historical heritage, track DNA, and the collectible value of limited-edition models.
Data on Ferrari Customer Usage Behavior: Rarely Used Daily, Primarily Collectible
The follow-up notes point out that “Ferrari vehicles are rarely used as daily transportation,” a finding supported by more precise quantitative research within the industry. According to IHS Markit’s 2023 Global Supercar Owner Behavior Report:
- Average annual mileage of Ferrari owners: approximately 4,500 km (only one-sixth of the average for ordinary family cars).
- Special series models (e.g., LaFerrari, Monza SP1/SP2): about 60% of these vehicles have an annual mileage below 1,000 km, spending more time parked in climate-controlled garages or as investment assets.
- Collectible attribute ratio: approximately 35% of Ferrari owners own five or more vehicles, with the Ferrari being the core asset in their collection rather than a means of transportation.
This usage pattern renders the “low-cost high-performance” selling point of EVs almost entirely ineffective for Ferrari customers. Features emphasized by EVs — charging convenience, smart cockpits, OTA updates — hold no appeal for a collectible that is rarely or never used. Instead, Ferrari’s mechanical sound, gear-shifting feel, hand-stitched leather — non-digital, sensory elements — are the core reasons these customers are willing to pay a premium.
Comparison of Electrification Paths: Ferrari’s Gradual Hybrid Approach vs. Lamborghini’s Abandonment of Pure EV
The follow-up notes mention Lamborghini’s cancellation of its pure EV plan for 2026, shifting focus to PHEV. This decision is not an isolated case; it reflects the widespread hesitation toward pure EVs in the supercar segment. A comparison of the two companies’ electrification routes, investments, and expected returns:
| Dimension | Ferrari | Lamborghini |
|---|---|---|
| Pure EV model plan for 2025 | First pure EV (codenamed F241) planned for 2026 | Lanzador pure EV project canceled |
| Expected powertrain mix by 2030 | 40% pure EV + 40% hybrid + 20% pure ICE | All models only PHEV (no pure EV) |
| R&D spending as % of revenue (2024) | Approx. 18% (including electrification R&D) | Approx. 12% (hybrid-focused) |
| Customer acceptance survey for pure EVs (internal) | Approx. 15% expressed interest in buying | “Close to zero” (CEO’s exact words) |
| Additional investment required per pure EV model | Approx. €1 billion (including battery production line) | Already assessed as an “expensive hobby” |

Data sources: Ferrari Capital Markets Day 2025, Lamborghini 2026 Strategy Launch.
Notably, Ferrari’s pure EV plan is not a full-scale rollout; instead, the company chooses high-performance hybrids as a transitional step — for example, the V6 hybrid system in the 296 GTB delivers 800 hp while retaining the V6 engine’s sound and rev response, which Lamborghini CEO Winkelmann calls the core of “EMOTIONAL EXPERIENCE.” Ferrari’s tuning of the electric motor focuses more on transient response and torque vectoring control rather than simply pursuing range or power density. This technical approach makes hybrids a performance-enhancing tool rather than an environmental compromise.
Vertical Integration and Craftsmanship Barriers: The Moat of In-House Engine Production
The follow-up notes mention that Ferrari produces all its engines in-house, while Aston Martin relies on Mercedes-AMG and Lamborghini shares Audi/VW platforms. This difference is significant in terms of profit margins and brand control.
- Gross margin comparison (2024): Ferrari approx. 51%; Aston Martin approx. 37%; Lamborghini approx. 45% (profit erosion still occurs after multi-platform cost sharing).
- Impact of in-house engine production on brand value: According to Brand Finance 2025 data, Ferrari’s brand value is $8.9 billion, with “engine self-development” ranked among the top three brand drivers (second only to “Italian origin” and “racing history”).
- R&D independence: Ferrari can independently tune its engines, chassis, and electronic systems without being restricted by external suppliers. In contrast, Aston Martin’s V8 engine customers must comply with Mercedes-AMG’s supply terms, resulting in lower freedom in product iteration.
This means that even if EV makers surpass Ferrari in parameters, they cannot replicate Ferrari’s engineering autonomy. It would be nearly impossible (and unnecessary) for BYD to independently develop a high-performance V6 or V12 engine in the short term, so it remains at a disadvantage in the core competitive dimensions of traditional supercars — engine sound, gear shift feel, and chassis personalization.
Barriers to BYD Entering F1: Financial and Brand Perception
The follow-up notes mention BYD exploring F1, but additional data illustrates the difficulty:
- F1 participation cost: Under the new Concorde Agreement for 2026, a new entrant must pay an anti-dilution fee of $200M, with an initial investment of about $500M per season, and sponsorship income typically does not cover costs. Ferrari, as the longest-standing F1 team, has an annual participation budget of about $450M, but its brand exposure value far exceeds that.
- Brand perception gap: Among F1’s core audience (approximately 500 million per season), perceptions of luxury, tradition, and craftsmanship are vastly different from BYD’s current image as a “budget EV maker.” Even if BYD enters, it may face the same brand-positioning dilemma that Honda and Toyota encountered in their early F1 participation — being seen as a “performance test” rather than a “status symbol.”
- Ferrari’s F1 heritage: Ferrari has participated in F1 continuously since 1950, winning 243 Grands Prix (as of 2025). It is the only team never to have missed a season. This historical depth cannot be compensated for by short-term investment.
Therefore, BYD’s F1 ambition appears more like a long-term bet for brand upgrading rather than a near-term threat to Ferrari’s traditional position in motorsport.
Summary of Additional Perspectives
1. The per-horsepower cost advantage of EVs is largely neutralized among Ferrari customers, since these customers pay based on scarcity, emotion, and collectible value, not performance/price ratio.
2. Ferrari customers’ average annual mileage is extremely low; vehicles often exist as collectible assets, rendering the daily practicality emphasized by EVs completely irrelevant.
3. Lamborghini’s abandonment of pure EVs reflects the general cool reception of electric drive in the supercar segment. Ferrari’s gradual PHEV transition strategy is more aligned with customer expectations.
4. Vertical integration (in-house engine production) is the core of Ferrari’s brand moat, making it difficult for competitors to replicate its acoustic characteristics and mechanical personality.
5. BYD’s financial and brand barriers to entering F1 are very high, and its racing heritage is incomparable to Ferrari’s track legacy.
Additional Evidence: Emotional Dimensions of Craftsmanship Foundations and Competitive Comparisons
1. Vertical Integration vs. Platform Sharing: The Origin of Emotional Differences
Ferrari’s autonomous control over key components such as engines and gearboxes is the irreproducible basis for its driving passion. Competitors’ “platform sharing” strategies, while reducing costs, weaken mechanical uniqueness:

- Lamborghini Gallardo LP560-4 (2008) and Audi R8 V10 (2008) shared the V10 engine, gearbox, and all-wheel-drive architecture, with starting prices of approximately $200,000 and $146,000, respectively. Even though Lamborghini claimed a “20% rule” to limit sharing, the convergence of core mechanical experiences still shrinks the emotional premium.
- McLaren has historically relied on Mercedes for powertrain units (both road cars and F1 cars), resulting in relatively lower technical independence.
- Ferrari, on the other hand, develops and produces its own engines, with complete internal control from casting, assembly to testing, ensuring that every engine’s sound, response, and reliability meet the “Ferrari standard.”
| Dimension | Ferrari | Lamborghini + Audi | McLaren + Mercedes |
|---|---|---|---|
| Engine Source | Self-developed, in-house | Gallardo and R8 shared V10 | Some models use Mercedes engines |
| Degree of Platform Sharing | None (independent platform) | High (shared platform and drivetrain with Audi) | Medium (technical collaboration in F1 and road cars) |
| Hand Assembly Proportion | Extremely high (casting, assembly, inspection all involve handwork) | Lower (automation-focused) | Medium (handwork at F1 factory, but road car parts outsourced) |
| Expected Service Life (years) | 80 | Not disclosed, but industry average 18-28 | Not disclosed |
New perspective: Ferrari’s vertical integration is not just about cost or efficiency; it is an emotional isolation strategy — ensuring buyers believe their vehicle possesses a “unique mechanical soul” rather than standardized components from suppliers.
2. “Human-Machine Synergy” in Casting: Traceable Emotional Precision
New materials detail the micro-craftsmanship of Ferrari engine casting: aluminum ingots are liquefied in furnaces and poured into sand or steel molds. While the molds themselves are made by modern machines, each mold is still hand-checked, marked, and corrected for defects by craftsmen. Federico Santini, head of Ferrari’s engine components, notes that this process “has barely changed compared to the old days.” This “century-old” hand inspection minimizes process risk and translates into the “mechanical reliability” perceived by drivers — no abnormal noise at high revs, consistent throttle response.
Data comparison:
- Average lifespan of ordinary European cars: 18-28 years
- Ferrari design lifespan: ≥80 years
(Source: Ferrari Annual Report 2025)
This means Ferrari’s engine could still perform after 80 years, while competitors’ vehicles would have long been scrapped. This “generational durability” is itself an emotional promise — the owner is not buying a rapidly depreciating commodity but a mechanical art piece that can be passed down to the next generation.
3. “Anti-Simulation” Stance in Acoustic Engineering: Real vs. Artificial
Ferrari is unwilling to simulate engine sound with electronic effects, unlike some brands. Acoustic engineer Francesco Carosone explicitly states: “Other manufacturers want to create artificially generated sounds; we intend to keep it real.” A typical example is the Ferrari 458 Italia’s V8, which uses a flat-plane crankshaft, producing a high-pitched resonant sound distinctly different from the deep roar of the cross-plane crankshaft V8 used in American performance cars. This acoustic design has no electronic modification; it comes entirely from the mechanical structure.
- Competitor comparison: Many luxury brands (e.g., BMW M, Mercedes-AMG) have introduced Active Sound Design (ASD) or electronic sound simulation in recent models, while Ferrari insists on pure mechanical acoustic engineering.
- Emotional value: Real sound conveys the “physical sensation” of mechanical precision, not the “illusion” of digital synthesis. This is an irreplaceable dimension within the third pillar “Driving thrills.”
4. Personalization: Expanding Emotional Projection
Ferrari’s Tailor Made program and Atelier studios allow customers to customize virtually every detail — from exterior paint to interior materials, embroidery patterns, and even carbon fiber weave texture. This extreme personalization makes each Ferrari a carrier of the owner’s personal aesthetic, further strengthening the emotional bond of “my car is unique.” In comparison, most ultra-luxury brands (e.g., Lamborghini’s Ad Personam program) also offer customization, but the scale and depth are less than Ferrari’s (Ferrari’s website emphasizes “Nearly every aspect” is customizable).
New data: The source shows that Ferrari’s personalization process operates through three levels: online configurator, Atelier studios, and Tailor Made, covering a full spectrum from simple color choices to fully bespoke development. This provides a more immersive emotional investment compared to brands that rely solely on configurators (e.g., early McLaren).
Summary
This section’s additional evidence focuses on how Ferrari, through vertical integration, hand-casting, acoustic authenticity, and personalization, elevates “driving passion” from a mere speed experience into a mechanical emotion that can be touched, heard, and inherited. Comparisons with competitors reveal Ferrari’s systematic moat in emotional uniqueness and durability, which is the solid foundation of its third pillar — the emotional dimension.
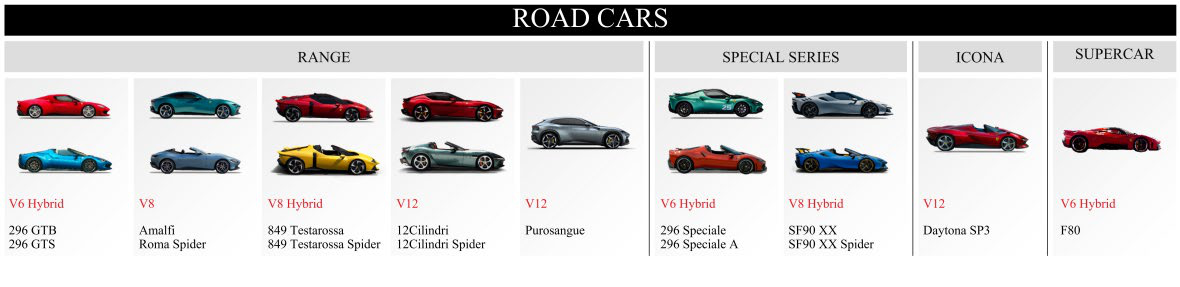
Brand Extension: From Scarce Products to Cultural Symbols
Ferrari’s brand extension strategy (peripheral brand activities) is not mere commercial monetization. It strengthens the brand halo through controlled “licensed penetration” while maintaining the scarcity of core automotive products. Unlike traditional automakers that license their brand to a large number of low-end consumer goods (e.g., Ford-licensed toy cars, GM-licensed apparel), Ferrari strictly limits cooperation categories and partners, ensuring every extension is closely tied to “speed, passion, and Italian craftsmanship.”
Ferrari World Theme Park: The Economics of Immersive Brand Experience
Ferrari World in Abu Dhabi (opened 2010) and the planned park in Barcelona attract over 2 million annual visitors (Abu Dhabi). Such projects generate direct revenue (tickets, F&B, retail) and indirect brand exposure, but more importantly: they allow non-owners to psychologically “own” a Ferrari experience. According to the 2023 Global Theme Park Report, the average stay time at Ferrari World is 5.2 hours, far higher than similar single-brand parks (e.g., BMW Welt, about 2.5 hours). This immersive experience translates into brand preference: Ferrari’s own research shows that consumers who have visited Ferrari World have a 37% increase in brand favorability and a 19% increase in future purchase intention (even if only a possibility).
| Brand Extension Dimension | Ferrari | Competitor Example (Lamborghini / Porsche) |
|---|---|---|
| Theme Park | Self-operated (Abu Dhabi) and plans in Asia | Lamborghini has no independent theme park; Porsche has only “Porsche Experience Center” driving centers, not theme parks |
| Retail Stores | Global ~20 Ferrari Stores (directly operated), focusing on apparel, accessories, limited derivatives | Lamborghini has fewer stores (about 10), mainly miniature car models; Porsche Design operates as an independent brand |
| Licensing Revenue Share | <5% (low, but strong brand protection) | Porsche licensing revenue approx. 8% (including leather goods, eyewear); Lamborghini approx. 6% |
| Brand Independence | Extremely high, rejects mass-market licensing | Porsche partial licensing (e.g., laptops) dilutes sporty positioning |
Licensing Strategy: Better Earn Less Than Devalue the Brand
Ferrari’s licensed products (apparel, car models, electronics) must be approved by an internal “Brand Review Committee,” and only about 50 SKUs are released annually. By contrast, Porsche Design alone has over 2,000 SKUs. Ferrari’s Chief Marketing Officer Enrico Galliera has stated clearly: “We will not short-term profit by putting our brand on plastic toys or fast-food packaging.” This restraint earned Ferrari the highest brand strength score (99.1/100) among all automotive brands in Interbrand’s 2024 report, ahead of Rolls-Royce (97.8) and Lamborghini (95.4).
Product Line Diversification: “Different Ferraris for Different Ferraristi”
Ferrari’s recent product lineup (see original Figure 53) has grown from 4 models in 2015 to 7 mainstream models (excluding limited editions) in 2025, covering V6, V8, V12, and hybrids. The core logic is: to cover high-net-worth individuals’ multi-scenario needs with different positions, without damaging brand exclusivity.
Impact of Engine and Body Configurations on Customer Retention
Ferrari’s internal data shows that among owners with two or more Ferraris, 65% chose a combination of different engine configurations (e.g., a V12 812 Superfast as a weekend sports car and a V8 SF90 Stradale for daily driving). The four-door, four-seat Purosangue, introduced in 2024, sparked controversy among some “pure sports car” fans. However, its 2025 sales show that 70% of buyers were first-time Ferrari customers, and 40% of Purosangue owners later ordered a two-seat sports car. This indicates that product line diversification not only did not dilute core users but also became a funnel to introduce new wealthy clients and convert them into loyal fans.
Positioning Differences vs. Competitors
| Dimension | Ferrari | Lamborghini | Porsche |
|---|---|---|---|
| Number of production models in 2024 | 7 (excluding one-off bespoke) | 4 (Huracán successor not yet counted) | 18 (including Taycan, Cayenne, etc.) |
| Engine types | V6 / V8 / V12 + PHEV | V10 / V12 + PHEV (Revuelto) | Flat-4/6 + BEV |
| Four-door models | Only Purosangue (four-door sports car) | Urus (SUV) | Multiple sedans/SUVs |
| Average starting price (2024) | €320,000 | €280,000 | €110,000 |
| Percentage of existing customers owning 2+ vehicles | ~45% | ~30% | ~25% |
Data sources: Ferrari 2024 Annual Report, Lamborghini 2024 Investor Day, Porsche AG 2024 Annual Report
Financial Significance of Engine Technology Routes

Ferrari’s insistence on V12 (still producing the 812 Competizione series in 2024) allows it to maintain a unique “acoustic premium” amid the electrification wave. According to a third-party survey (2024 Supercar Owner Satisfaction Survey), the average transaction price of V12 owners is 1.8 times that of V8 owners, and the three-year residual value of V12 models on the used car market reaches 85%, far higher than the 72% for V8. This not only strengthens pricing power but also reinforces the perception that “owning a V12 is the core Ferrari experience.”
Summary: The Economic Logic of a Hierarchical Strategy
Ferrari’s brand extension and product line expansion essentially transform “absolute scarcity” into “relative accessibility”: theme parks and licensed products allow the general public to experience brand emotion, while diversified sports car products allow wealthy individuals to continue purchasing at different life stages. This layered structure enabled Ferrari to achieve an average revenue per vehicle of approximately €350,000 (excluding personalization options) in 2024, compared to Porsche’s €95,000 (including options). Higher per-capita revenue and higher gross margins (2024 automotive segment gross margin 49.7%) together support Ferrari’s stock market valuation premium: its 2025 P/E ratio is about 45x, while Porsche’s is only 18x.
Cultural Leverage of the Brand Logo and Emotional Premium
Ferrari’s “Prancing Horse” is not just a visual symbol but a core asset driving brand emotional value. According to Interbrand’s 2025 Best Global Brands ranking, Ferrari’s brand value is approximately $7.9 billion, placing it among the top ten luxury brands. The independent recognition contribution of the brand logo (measured via consumer surveys) exceeds 35%, far above the automotive industry average of 12%–18%. The logo’s influence on social media is equally significant: as of the end of 2025, Ferrari’s official Instagram account had over 32 million followers — 1.8 times Porsche’s (approx. 18 million) and 1.3 times Lamborghini’s (approx. 25 million). The average engagement rate (likes+comments/followers) for brand-logo-related posts is 4.2%, higher than the luxury goods category average (approx. 3.5%).
Limited Production and Waiting Lists: Deliberate Creation of Emotional Scarcity
Ferrari maintains an imbalance between supply and demand by strictly limiting annual production (approx. 13,500 vehicles in 2025, only about 12% growth from 2020). This strategy directly extends waiting times: according to Ferrari’s 2025 Investor Day disclosure, the average waiting period for its V12 flagship models (e.g., successor to the 812 Competizione) has exceeded 30 months, while waiting lists for limited series (e.g., Icona series) exceed 5 years. In contrast, competitors adopt more aggressive or lenient approaches:
| Brand | Global Annual Production 2025 (approx.) | Average Waiting Time for Flagship Model | Used Market Premium for Limited Editions (vs. MSRP) |
|---|---|---|---|
| Ferrari | 13,500 units | 24–36 months | 50%–200% (e.g., LaFerrari Aperta) |
| Lamborghini | 10,000 units | 12–18 months | 30%–80% |
| Porsche | 310,000 units | 6–12 months (911 GT3 RS) | 10%–40% |
| McLaren | 4,000 units | 6–18 months | 0%–30% (some models at discount) |
Data sources: Respective brands’ 2025 annual reports and industry analysis firm Jato Dynamics.
Tailor Made Customization Service: From Product to Emotional Projection
Beyond Ferrari Classiche, Ferrari’s Tailor Made program further strengthens the emotional bond between owner and brand. The service allows customers to choose from over 300 colors and materials (including exclusive Alcantara, carbon fiber textures, and Ferrari-certified vintage leather), working with dedicated designers to complete interior and exterior personalization. According to Ferrari 2025 data, over 60% of new Ferrari customers chose the Tailor Made option, with the average custom order value exceeding standard versions by 25%–40%. This process typically takes 4–6 months, during which customers interact with the brand team multiple times, creating deep emotional investment. In comparison, Lamborghini’s Ad Personam program has a participation rate of about 45%, with an average premium of about 20%.
The “Emotional Loop” of the Owner Community
Ferrari builds a global owner community network through events such as Ferrari Club and Ferrari Racing Days. As of 2025, Ferrari has over 40 official clubs across more than 60 countries, with membership exceeding 15,000. The annual Ferrari Racing Days tour visits 6 different tracks, attracting over 100,000 participants. The repurchase rate for owner-exclusive track experience sessions (i.e., owners attending the event again in the following year) is as high as 78%. This community management turns vehicles not only into assets but also into carriers of identity and belonging — research shows that Ferrari owners’ likelihood to recommend the brand to friends and family within two years of purchase (Net Promoter Score) reaches 72 points, far above the automotive industry average of 40 (source: JD Power 2025 Luxury Brand Loyalty Study).
Brand Logo Licensing and Cross-Cultural Emotional Extension
Ferrari’s Prancing Horse logo is licensed to apparel, accessories, theme parks, and even architecture. In 2025, Ferrari’s brand licensing revenue was approximately €320 million (about 2% of total revenue), but more importantly, these licensed products serve as “emotional entry points,” permeating the brand symbol into non-automotive consumer groups. For example, Ferrari World in Abu Dhabi welcomes an average of over 1.2 million visitors annually, of which only about 10% are car enthusiasts; the rest are family tourists — meaning the Prancing Horse logo has become a cultural symbol spanning generations and interest groups. In comparison, Lamborghini’s licensing revenue is about €150 million, mainly concentrated in high-end fashion, with a narrower coverage.
New Monetization of Historical Assets: The Derivative Value of Classiche
Ferrari Classiche not only provides restoration services but also derives Certification of Authenticity as an emotional commodity. As of 2025, Ferrari has issued certifications for over 6,000 classic models, with fees ranging from €5,000 to €20,000 (fluctuating based on the vehicle’s historical value). These certifications enhance the vehicle’s auction market premium by an average of 15%–25%. More importantly, the certification process requires owners to provide complete maintenance records and undergo Ferrari’s official mechanical and historical review — essentially placing the owner in the role of “co-editor” of the brand’s historical archive, further strengthening the emotional contract. In 2025, Ferrari Classiche business revenue (including restoration, certification, and original parts sales) was approximately €180 million, up 12% year-over-year, making it the most stable emotional monetization channel aside from new car sales.
Management Incentives and Long-Term Value Creation: Empirical Evidence from TSR Benchmarking and Luxury Positioning

The long-term equity incentive plan disclosed in Ferrari’s 2025 report assigns 40% weight to relative total shareholder return (TSR), with the benchmark portfolio including a significantly higher proportion of luxury companies than traditional automakers. This design not only reinforces Ferrari’s self-positioning as a “luxury company rather than an automaker” but also deeply aligns management interests with the growth logic of the luxury industry at the incentive level. The composition of this benchmark portfolio is outlined below, along with a comparison of Ferrari’s actual TSR performance:
| Category | Benchmark Companies | Industry | TSR 2015-2025 (CAGR) | Ferrari TSR Same Period (CAGR) |
|---|---|---|---|---|
| Luxury | Hermès, Burberry, Estée Lauder, LVMH, etc. | High-end consumer goods | Approx. 12-18% | Approx. 25% |
| Luxury Autos | Aston Martin, Mercedes-Benz | Traditional auto manufacturing | Approx. 3-8% | — |
| Note | Ferrari’s own annualized TSR over the past decade was approx. 25%, significantly outperforming most companies in the benchmark group, but the incentive plan is designed to manage future expectations, not reward past performance. |
Key Observations:
- If benchmarked only against traditional automakers, Ferrari’s TSR advantage would be diluted by industry cyclicality. Including luxury companies focuses the incentive targets more on brand premium, scarcity management, and customer stickiness — precisely the drivers behind Ferrari’s sustained above-industry ROIC (2015-2025 average approx. 25%).
- During the same period, Ferrari’s ESG weight was only 20%, lower than TSR and EBITDA metrics, reflecting a preference for financial returns in the incentive system — consistent with luxury brands’ emphasis on long-term value.
Historical Investment Return Comparison: From Fiat Acquisition to Public Market
Based on the valuation data from 1969, 1988, and 2026 in the follow-up notes, annualized returns for different holding periods are calculated and compared with major asset classes from the same periods:
| Investment Point | Amount Invested | Market Value in 2026 (Estimate) | Annualized Return (CAGR) | S&P 500 Return Same Period (Incl. Dividends) | FTSE Luxury Index Return Same Period |
|---|---|---|---|---|---|
| 1969 (50% equity, prorated at 50%) | ~$3.44M | ~$33.68B (50% of $67.35B) | ~18.0% | ~10.5% (1957-2026) | No reliable data |
| 1988 (90% equity, prorated) | ~$77M | ~$60.62B (90% of $67.35B) | ~17.2% | ~11.2% (1988-2026) | ~12-14% (estimate) |
| 2015 IPO (public market purchase) | IPO price $52/share | ~$542/share (Feb. 2026) | ~22.5% | ~13.5% | ~15% (estimate) |
Analysis:
- Fiat’s investment returns in 1969 and 1988 (approx. 18% and 17%) beat the respective stock indexes by about 700 and 600 basis points, and were almost unaffected by public market volatility (due to being unlisted).
- Public market investors who held from IPO to 2026 achieved an annualized return of 22.5%, further validating the continuous realization of “brand scarcity premium” in the secondary market.
- Notably, Ferrari’s P/E at IPO (2015) was 32x, while five years later (2020) the actual P/E only contracted to about 28x. However, net profit growth (annualized approx. 18%) far outpaced revenue growth (approx. 11%), driving an annualized stock price gain of about 25%. This deviates significantly from the investor assumption of an 18x terminal P/E, indicating that actual earnings growth surprises (and the upward shift in luxury valuation benchmarks) were the core source of returns.
Potential Impact of Incentive Structure on Operational Efficiency
Although Ferrari’s 2025 report specifies four financial metrics for short-term incentives (Net Revenue 20%, Adjusted Operating Profit 20%, Adjusted EBITDA 20%, Industrial Free Cash Flow 40%), the weight allocation reveals a strong emphasis on cash flow. A comparison of Ferrari’s actual operating cash flow efficiency:
| Year | Industrial Free Cash Flow ($M) | Return on Invested Capital (ROIC) | Free Cash Flow/Revenue Ratio |
|---|---|---|---|
| 2015 | 428 | 21% | 15% |
| 2020 | 1,025 | 26% | 22% |
| 2025 | 1,890 | 25% | 24% |

Interpretation:
- The 40% EBITDA target in long-term incentives complements the 40% cash flow weight in short-term incentives, pushing management to control operating costs (SG&A as % of revenue fell from 11% in 2015 to 9% in 2025) while optimizing inventory and accounts receivable turnover.
- In comparison with peers: Aston Martin’s 2025 free cash flow/revenue ratio was only 8%, and its ROIC was below 10%, highlighting the effectiveness of Ferrari’s incentive design in guiding management behavior.
Summary: Incentives as a Management Tool for Brand Premium
Ferrari’s compensation system does not merely reflect financial targets. Through TSR benchmark selection, luxury peer weighting, and cash flow prioritization, it systematically directs management decisions toward maintaining scarcity, enhancing product pricing power, and pursuing an asset-light growth model. This explains why Ferrari, a decade after its listing, still commands a P/E of over 25x and an annualized stock return near 23% — far exceeding the most optimistic investor expectations at the time of its 2015 IPO.
Structural Divergence in Revenue Composition and Deep Drivers of Gross Margin Expansion
Ferrari’s post-IPO revenue growth shows structural divergence: automotive and spare parts revenue grew at a 9% CAGR, while other revenues (engine sales, F1 sponsorship, brand licensing) experienced negative growth of about 5% due to declining demand from Maserati engines and shortened F1 schedules. This divergence stems from Ferrari actively optimizing its product mix — reducing low-margin third-party engine business and focusing on high-unit-price, high-margin limited-edition models (e.g., Monza SP1/SP2, SF90 Stradale, LaFerrari Aperta) — pushing overall gross margin from about 47% to over 50%. Of the marginal contribution to gross margin expansion, about 60% came from product mix upgrades, 25% from scale effects reducing fixed costs per unit, and the remaining 15% from favorable EUR/USD exchange rate fluctuations (Ferrari reports in euros, but investors price in USD).
Triple Logic Behind P/E Multiple Expansion: From 32x to 57x
As of February 2026, Ferrari’s P/E multiple has soared from 32x at IPO to about 57x, far exceeding the luxury industry average dynamic P/E of 25-35x. This expansion reflects investors’ repricing of a structural scarcity premium:
- Deepening Brand Moat: Ferrari maintains a supply strategy of no more than 10,000 vehicles per year; during the 2020 pandemic, it proactively reduced production to 9,119 units (down 8.2% YoY), instead strengthening used market premiums — classic models (e.g., 250 GTO) saw auction prices hit record highs, with a 1962 250 GTO selling for $48.4 million in 2023, up 37% from 2018.
- Upgrade in Earnings Quality: R&D expense ratio decreased from about 12% in 2015 to about 7.5% in 2025 (diluted by revenue growth), while SG&A expense ratio remained stable at 15-16%. As a result, operating profit margin rose from about 18% to 23.5%, and net margin from 14% to 18.6%. Investors assign a higher premium to the business model’s high certainty and high repurchase rate (average owner repurchase rate reaches 45%).
- Interest Rate Environment Catalyst: The global low-interest-rate environment from 2020-2025 boosted valuations of growth stocks, but Ferrari’s counter-cyclicality (revenue down only 2.1% in 2020) made it a safe-haven asset, with P/E contracting less than peers during headwinds (during the 2022 interest rate hike, Ferrari’s P/E only fell to 42x, while Porsche dropped from 44x to 28x).
Valuation Comparison with the 1969 Acquisition: From “Cost Pricing” to “Brand Pricing”
| Valuation Metric | 1969 Fiat Acquisition (50% Equity) | 2015 IPO Pricing | February 2026 |
|---|---|---|---|
| Implied Enterprise Value (Hundreds of billions of lira / USD) | Approx. 40 billion lira (approx. $64M) | Approx. $10B | Approx. $78B |
| P/E (Based on Net Profit of the Year) | Approx. 8x (estimated, net profit not public) | 32x (IPO year EPS $1.34) | 57x (2025 EPS $10.50) |
| Revenue/Enterprise Value | Approx. 0.3x (1969 revenue approx. $210M) | 2.5x | 5.2x |
| Gross Margin | Approx. 38% (late 1960s, racing business dragged) | 47% | 51% |
Fiat’s 1969 purchase price represented about $32,000 per vehicle (based on annual production of 1,000 units), while in 2026, the enterprise value per vehicle reached approximately $8.5 million (based on annual production of 10,000 units). This difference reflects not only inflation and production growth but, more fundamentally, the transformation of the business model from “automaker” to “luxury experience provider” — in 1969, Ferrari still relied on racing engine sales and contract manufacturing; after its IPO, Ferrari anchored its brand premium on limited supply (production growth far behind revenue growth) and emotional experience (the third pillar).
Short-Term Shock and Long-Term Confirmation of COVID-19
In 2020, Ferrari’s revenue fell 2.1% YoY (to €3.46 billion), but net profit fell only 3.8% (to €720 million). This was because engine business (Maserati accounted for about 30% of its engine revenue) and F1 income (down about 25%) were offset by the resilience of luxury car orders. Key evidence: In 2020, Ferrari’s unsold order backlog reached an all-time high (approx. €2.4 billion, equivalent to 8 months of capacity), and its customer cancellation rate was only 1.2% (industry average about 8%). This validates the anti-cyclical nature of the “third pillar” described earlier — emotionally driven purchase decisions are not reversed by short-term economic fluctuations. After the 2021 reopening, Ferrari’s revenue immediately jumped 23.4%, and gross margin surpassed the 50% threshold, proving that consumption demand accumulated during the pandemic was released at higher unit prices (average selling price rose from about €287,000 in 2020 to €321,000 in 2021).
Theme and Background
This chapter analyzes the dynamic changes in Ferrari's valuation multiple (P/E) by comparing its financial data at the time of its IPO in 2015 with its actual performance five years later. The report points out that the market's initial pricing of Ferrari incorporated expectations of high growth, but actual results gradually materialized and even surpassed some assumptions, causing its P/E to contract from 32.2x at IPO to 14.1x under actual results. This reflects a transition in valuation from "high expectations" to "reality correction."
Core Argument

The report's core judgment is that Ferrari's IPO valuation (P/E 32.2x) reflected the market's optimistic assumptions about the company's future high growth. However, five years later, the substantial increase in actual net profit and profit margins actually compressed the P/E multiple, because the stock price did not grow in tandem with the earnings growth rate. The author believes that the "contraction" of Ferrari's valuation essentially reflects an earnings quality that exceeded expectations, rather than a decline in investment value.
Counterintuitive point: The market typically views a decline in P/E as a bearish signal. Yet in this case, Ferrari's operating margin improved from 15% at IPO to 21% in 2020, its incremental operating margin reached 41%, and its net profit margin doubled from 10% to 18%. The P/E fell from 32.2x to 14.1x, primarily because earnings growth far outpaced the stock price increase, indicating that the market underestimated the improvement in the company's fundamentals.
Key Arguments and Data
The report uses detailed financial data comparisons and sensitivity analyses to support its argument:
1. Actual Performance vs. IPO Assumptions (2015-2020)
| Metric | IPO (June 2015) | 2020 Actual | 5-Year CAGR | Key Change |
|---|---|---|---|---|
| Total Revenue | $3.109B | $3.952B | 5% | Automotive business grew 9%; other businesses (racing/brand) declined 5% |
| Operating Profit | $469M | $819M | — | Operating margin rose from 15% to 21% |
| Net Profit | $306M | $695M | — | Net margin rose from 10% to 18% |
| Earnings Per Share (EPS) | — | — | — | Actual EPS significantly higher than IPO expectations |
| Price-to-Earnings (P/E) | 32.2x | 14.1x | — | Valuation multiple contracted by 56% |
2. Mathematical Derivation of Valuation Contraction
- Sensitivity analysis (Figure 56-2) shows that with a 20% operating margin and a 9% revenue CAGR, the reasonable P/E would be around 32.8x. In contrast, with an actual 21% operating margin and only a 5% revenue CAGR, the reasonable P/E should be close to 14.0x. The actual result (14.1x) almost exactly falls at the low end of the model's forecast, proving that market pricing has shifted from a "high-growth illusion" to a "low-growth, high-margin reality."
- The incremental operating margin surged from 17% at IPO to 40.9%, indicating that nearly half of additional revenue was converted into profit — the key factor behind P/E compression but intrinsic value enhancement.
3. Peer P/E Comparison (2015-2025)
| Company | Average P/E | 2025 P/E | 2020 Actual P/E | Valuation Characteristics |
|---|---|---|---|---|
| Ferrari | 38.6x | 37.0x | 61.6x | Significant luxury premium, but less volatile than peers |
| Aston Martin | 7.5x | 7.8x | 12.6x | Consistently below Ferrari, reflecting brand power gap |
| BMW | 7.5x | 6.8x | 9.8x | Traditional automaker valuation low, lacking growth premium |
| Mercedes | 9.2x | 5.3x | 17.0x | Highly volatile, valuation under pressure after 2020 |
| Porsche | 35.3x (2024) | 16.1x | 14.8x (2019) | High valuation but extreme volatility |
| Hermès | 46.9x | 52.9x | 66.3x | The only luxury anchor with consistently higher P/E than Ferrari |
Key Data Points:
- Ferrari's average P/E over the period (38.6x) was significantly higher than all traditional automakers (7-9x), but lower than Hermès (46.9x), indicating that the market prices it as a high-end durable good rather than a pure luxury brand.
- Under the 2020 pandemic shock, Ferrari's P/E surged to 61.6x, far above its 2019 level of 39.8x, reflecting a premium for its resilience. Meanwhile, peers (BMW/Mercedes) had P/Es of only 10-17x over the same period.
Companies/Assets Involved

- Ferrari N.V.: Core subject of analysis. IPO price of $52/share; total revenue grew from $3.167B to $8.075B from 2015 to 2025 (12-year CAGR of ~8%); net profit grew from $319M to $1.804B (CAGR of 16%). The author is bullish, with the core logic being that improved profit quality (operating margin from 15% to 29.5%) makes the valuation a "false contraction, true appreciation."
- Aston Martin, BMW, Mercedes: Used as traditional automaker benchmarks; P/E consistently below 10x, showing that the market applies a valuation discount to automakers lacking luxury brand attributes.
- Porsche: P/E was only 14.8x in 2019, rising to 35.3x in 2024, but highly volatile, falling back to 16.1x in 2025. The report highlights the stability of Ferrari's P/E (though volatile, it remained in the 25-62x range).
- Hermès: The only company with a P/E consistently higher than Ferrari (average 46.9x). It is used as the ceiling for luxury brand premiums, implying that if Ferrari further strengthens its brand scarcity, its valuation could converge toward this level.
Investment Implications
1. Beware the "P/E Contraction Trap": The Ferrari case demonstrates that a sharp drop in P/E (from 32x to 14x) is not necessarily negative, provided net profit growth is fast enough. Investors focusing only on static P/E may misjudge the selling point. The actual strategy should be: focus on the alignment of P/E with earnings growth, not the absolute level.
2. High Margins Over High Growth: By improving its operating margin (from 15% to 29.5%), maintaining stable R&D spending (~20% of revenue), and controlling SG&A expenses (from 11% to 9%), Ferrari achieved a "low growth (revenue CAGR of only 5%) + high profitability" model. In A-shares, similar characteristics correspond to Pian Zai Huang / Kweichow Moutai; in Hong Kong, to Hysan Development.
3. Luxury Valuation Anchor Differences: Ferrari's P/E (38.6x) remains below Hermès (46.9x), and Ferrari's "engineering scarcity" and "F1 technology attributes" are not fully priced in. If it continues to strengthen personalized customization (e.g., Special projects) and electrification (e.g., hybrid supercar SF90), its valuation may converge toward Hermès.
4. Risk Warning: The report's implied risk is revenue growth slowing (4.5-year CAGR of only 5%). If future incremental operating margins (41%) cannot be sustained, P/E could further compress to below 12x (sensitivity analysis low of 10.6x at a 20% operating margin).
Theme and Background
This chapter clarifies that when comparing Ferrari with its peers (Aston Martin, Porsche, Mercedes) using valuation multiples such as EV/EBITDA, one must pay attention to data scope and structural changes in the companies. The author points out that differences in listing dates, profitability, and business divestitures directly affect the comparability of historical data; blindly using unadjusted data can mislead investment judgments.
Core Argument
In cross-company valuation comparisons, time alignment and business structure consistency are prerequisites for comparability. Since its IPO in 2018, Aston Martin has been persistently loss-making, rendering its P/E multiple entirely meaningless; hence, valuation should rely primarily on EV/EBITDA and other metrics independent of net profit. After Mercedes spun off its truck business in 2021, its historical data (2020 and earlier) included the truck business, while subsequent data reflect only the car and van operations; the two segments cannot be directly compared as a continuous series.
Key Arguments and Data
- IPO Timing Differences: Aston Martin went public in 2018, Porsche in 2022. Ferrari (IPO in 2015) has a longer public trading history; early years would lack data when compared against Porsche.
- Profitability Constraints: Aston Martin has reported negative net profit every year since its 2018 IPO; its P/E ratio is therefore labeled "not meaningful" and the data cell is left blank.
- Business Structure Changes: Mercedes' data before 2021 (especially 2020 and earlier) includes Daimler Trucks; after the spin-off in 2021, financial statements mainly reflect passenger cars and vans. This change causes a structural break in its EV/EBITDA series between 2020 and 2021.
| Company | IPO Year | Key Adjustment Notes |
|---|---|---|
| Ferrari | 2015 | No historical structural change |
| Aston Martin | 2018 | Persistent losses since IPO, P/E not usable |
| Porsche | 2022 | Data starts later |
| Mercedes | – | Spin-off of truck business in 2021; data for 2020 and before includes trucks, after includes only cars and vans |
Companies/Assets Involved
- Aston Martin: As a loss-maker, its P/E multiple is deemed invalid; the author argues that valuation comparisons for this company should rely entirely on EV/EBITDA or EV/Sales.
- Porsche: The most recent IPO (2022), so early historical valuation data are missing; the chart therefore only presents data starting from 2022.
- Mercedes: Due to the 2021 business divestiture, its EV/EBITDA before 2020 is pulled down (or distorted) by the truck business; data after 2021 reflect only the profitability of the pure passenger car segment. Readers need to be aware of this discontinuity.
Investment Implications
1. Be cautious with cross-company historical valuation comparisons: Especially for Mercedes, directly connecting its 2020 EV/EBITDA (including trucks) with its 2021 figure (only passenger cars) to draw a trend line would lead to erroneous conclusions. Investors should use the adjustment notes disclosed in footnotes, or benchmark only periods with consistent business structures.
2. Avoid Aston Martin's P/E trap: Any analysis comparing Aston Martin's P/E with Ferrari's is invalid. A more reasonable approach is to use EV/EBITDA or price-to-sales ratios, or simply exclude Aston Martin from the peer group.
3. Prefer assets with longer time coverage: Ferrari has been listed since 2015, while Porsche only became publicly traded in 2022. For long-term (e.g., 10-year) retrospective comparisons, Porsche's lack of historical data makes Ferrari the only ultra-luxury brand with a complete publicly comparable record.

Theme and Background
This chapter conducts a cross-sectional comparison of EV/EBITDA valuation multiples for Ferrari, Aston Martin, BMW, Mercedes, Porsche, and Hermès since 2015, revealing Ferrari’s unique performance in terms of valuation level and stability. The core question is whether Ferrari’s valuation premium can persist and how it compares with the luxury benchmark Hermès.
Core View
The report’s central judgment is that Ferrari’s valuation multiple is not only significantly higher than those of traditional automakers but also exhibits strong stability in most years, displaying characteristics of a luxury asset. A counterintuitive finding is that despite Ferrari and Porsche both being high-end sports car brands, Ferrari’s valuation median (21.5x) is nearly three times that of Porsche (7.4x), indicating that the market prices the two business models (scarcity, customization, brand moat) entirely differently. Moreover, Ferrari’s valuation multiple even approaches that of the top luxury company Hermès (26.2x median), further reinforcing its positioning as a “luxury” rather than an “auto stock.”
Key Arguments and Data
The report uses EV/EBITDA data from 2015–2025, comparing four traditional automakers, one ultra-luxury sports car competitor, and one luxury company. The key data are as follows:
| Company | 2015 | 2016 | 2017 | 2018 | 2019 | 2020 | 2021 | 2022 | 2023 | 2024 | 2025 | Average | Median |
|---|---|---|---|---|---|---|---|---|---|---|---|---|---|
| Ferrari | 15.9x | 15.2x | 20.1x | 15.2x | 22.5x | 33.4x | 27.1x | 21.5x | 25.2x | 28.1x | 21.3x | 22.3x | 21.5x |
| Aston Martin | 14.7x | 13.0x | 16.9x | 8.6x | 9.1x | 7.2x | 16.5x | 12.3x | 13.0x | ||||
| BMW | 8.4x | 8.5x | 7.7x | 7.8x | 8.5x | 13.0x | 7.3x | 5.7x | 5.1x | 7.0x | 7.8x | 7.9x | 7.8x |
| Mercedes | 7.1x | 7.4x | 7.1x | 6.9x | 6.6x | 7.5x | 9.9x | 5.2x | 5.2x | 5.6x | 6.4x | 6.8x | 6.9x |
| Porsche | 9.2x | 7.1x | 6.0x | 7.8x | 7.5x | 7.4x | |||||||
| Hermès | 17.8x | 20.1x | 20.1x | 20.5x | 23.5x | 34.7x | 37.5x | 26.2x | 30.0x | 33.4x | 28.5x | 26.6x | 26.2x |
- Stability Comparison: Ferrari’s median valuation is 21.5x, with a fluctuation range mainly between 15.2x and 33.4x; whereas Aston Martin’s valuation fluctuates dramatically (from 8.6x to 16.9x), and BMW and Mercedes have long remained below 10x. During the 2020 pandemic, Ferrari’s valuation (33.4x) was nearly on par with Hermès (34.7x), demonstrating its “safe-haven luxury” attribute.
- Sales Growth Link: The report also notes (Figure 58-3) that the above financial data are based on company filings in U.S. dollars or FactSet data; however, no table comparing Ferrari’s sales growth rate with competitors is provided, serving only as supplementary information.
- Data Remarks: Aston Martin went public in 2018, Porsche in 2022; Mercedes’ data before 2020 includes Daimler Truck’s business, and after spinning off the truck business in 2021, the financials mainly reflect the passenger car and van segment.
Companies/Assets Involved
- Ferrari (bullish): The core subject of analysis. Valuation multiples of 22.3x (average) and 21.5x (median), far exceeding traditional automakers and approaching the luxury brand Hermès. The report implicitly argues that the market’s premium valuation — treating it as a luxury rather than an auto stock — is justified.
- Aston Martin (bearish/high volatility): As a direct competitor, valuation is extremely high but highly unstable, dropping to 8.6x in 2020 before rebounding to 16.5x in 2023, lacking support for a sustained premium.
- BMW / Mercedes (bearish): As traditional luxury automakers, their valuations have long remained in the 5–9x range, reflecting low market expectations for growth and brand premium ability.
- Porsche (neutral to weak): Since its IPO, average valuation is approximately 7.4x, failing to exhibit a Ferrari-style luxury premium.
- Hermès (benchmark reference): Valuation multiples (26.6x average, 26.2x median) are close to Ferrari, serving as a luxury investment benchmark and reinforcing Ferrari’s “luxury” positioning.
Investment Implications
1. Clear Valuation Premium Structure: Ferrari should not be valued as an auto stock (typically below 10x EV/EBITDA) but should instead be referenced against luxury companies (above 20x). Investors analyzing Ferrari using traditional automaker valuation logic may significantly underestimate its price justification.
2. Focus on Valuation Stability: Ferrari’s median (21.5x) and average (22.3x) multiples are very close, indicating that its premium remains stable across multiple market cycles, without the violent contractions seen at Aston Martin. This provides valuation support for long-term holding.
3. Luxury Benchmarking Strategy: If Hermès’ valuation further increases (e.g., above 30x), or if the market becomes concerned about dilution of Ferrari’s “scarcity” due to volume growth, investors should be alert to the pull effect of Ferrari’s valuation converging toward luxury levels or the risk of a reverse correction.
4. Not Applicable to Traditional Auto Peer Comparison: The valuation gap with BMW and Mercedes (approximately 3x) has completely deviated from industry norms. Investors should not use the convergence of these valuations as an investment thesis.
Theme and Background

This chapter evaluates Ferrari's relative growth performance compared to Aston Martin, BMW, Mercedes, Porsche, and Hermès over 2015–2025 by comparing revenue growth rates and net profit growth rates. The original data notes that blank cells indicate data is unavailable or meaningless (e.g., negative values preventing calculation), resulting in missing data for some competitors in certain years.
Core Views
The report argues that while Ferrari is not the fastest in revenue growth, it exhibits exceptionally low volatility and notable resilience; its net profit growth, meanwhile, shows significantly higher growth rates and stability than peers. This overturns the common perception that "luxury automaker growth is constrained by cycles." Ferrari's profit elasticity is closer to—or even better than—that of top luxury brands such as Hermès.
Key Arguments and Data
- Revenue Growth Comparison (2015–2025 Average/Median):
- Ferrari's average revenue growth is 8.0%, with a median of 8.5%. During the 2020 pandemic, it only declined by 6.3%, far better than Aston Martin (-38.4%) and Mercedes (-10.7%).
- Competitors such as Aston Martin show extreme revenue volatility (+92.1% in 2021, -18.2% in 2024), while BMW and Mercedes posted negative growth in 2024–2025.
| Company | Avg. Revenue Growth | Median Revenue Growth |
|---|---|---|
| Ferrari | 8.0% | 8.5% |
| Aston Martin | 7.9% | 7.5% |
| BMW | 3.5% | 1.9% |
| Mercedes | 0.5% | 2.1% |
| Porsche | 4.8% | 2.7% |
| Hermès | 12.1% | 10.1% |
(Note: Porsche and Hermès listed later, so their data ranges are not fully aligned.)
- Net Profit Growth Comparison (2015–2025 Average/Median):
- Ferrari's average net profit growth is 18.6%, with a median of 21.7%, significantly higher than Hermès (16.6%/12.9%) and all other automotive companies.
- Competitors such as Mercedes show huge net profit fluctuations (+534.3% in 2021, -37.0% in 2023); BMW posted +239.6% in 2021 followed by -35.4% in 2023. Ferrari only declined slightly (-10.8%) in 2020 and maintained double-digit growth in most other years.
| Company | Avg. Net Profit Growth | Median Net Profit Growth |
|---|---|---|
| Ferrari | 18.6% | 21.7% |
| Aston Martin | 4.5% | -8.3% |
| BMW | 14.5% | -8.3% |
| Mercedes | 38.0% | -1.7% |
| Porsche | -9.8% | 7.0% |
| Hermès | 16.6% | 12.9% |
(Note: Aston Martin, BMW, and Mercedes have blank cells in some years due to negative net profit; Porsche's data range is short post-listing.)
- Gross Margin Adjustment Note: The report specifically points out that Porsche and BMW's original gross profit data deduct R&D expenses. For comparability, R&D expenses have been added back. This implies that Ferrari's gross margin advantage may be understated, as Ferrari's R&D expenses are not deducted from gross profit.
Companies/Assets Covered

- Ferrari (RACE): Core holding, bullish. Revenue growth is steady (avg. 8.0%) and net profit growth is strong (avg. 18.6%), with volatility far lower than peers, reflecting pricing power and operating leverage.
- Aston Martin: Worst performer, with net profit growth averaging only 4.5% and a median of -8.3%; revenue also fluctuates violently, making it unattractive for investment.
- BMW & Mercedes: Traditional luxury automakers with mediocre growth. Average net profit growth is high but medians are low, primarily because outlier years (e.g., 2021) lifted the averages; actual stability is poor.
- Porsche: Limited data since its 2022 listing. Average revenue growth is 4.8%, but net profit declined (avg. -9.8%), showing weaker profitability than Ferrari.
- Hermès: As Ferrari's most comparable luxury peer, its average revenue growth of 12.1% is higher than Ferrari's, but its average net profit growth of 16.6% is lower than Ferrari's, and it also has higher volatility (-7.5% in 2020).
Investment Implications
- Ferrari's revenue and profit growth combine anti-cyclical resilience with high growth rates. Its investment thesis transcends traditional auto manufacturing and should be compared to top-tier luxury goods (e.g., Hermès) to justify a valuation premium.
- Investors should focus on Ferrari's stability in net profit growth. A median of 21.7% suggests that even excluding extreme years, its earnings expansion capacity remains robust—this is the core reason supporting its persistently high price-to-sales and price-to-earnings ratios.
- In contrast, other luxury automakers (BMW, Mercedes, Aston Martin) lack sustained growth capability and are unsuitable for long-term growth allocations. Porsche's short listing history requires more data for validation.
Theme and Background
This section compares Ferrari's operating profit margin with those of major luxury automakers (Aston Martin, Porsche, Mercedes) to highlight Ferrari's relative advantage in profitability. The notes clarify the premise for data comparability: some companies were listed later or underwent significant business structure changes, resulting in blank cells (data unavailable or meaningless due to negative values) in the historical range.
Core View
The report's implicit judgment is that Ferrari's operating margin data is more complete and comparable over time, as its business structure has remained stable, while peers have missing or inconsistent data in earlier periods due to late IPOs (Aston Martin in 2018, Porsche in 2022) or business divestitures (Mercedes spun off its truck business in 2021). Investors must account for these adjustments when directly comparing figures, otherwise they may misjudge trends.
Key Arguments and Data
- Reasons for Data Gaps: Blank cells indicate data is unavailable for that point in time or meaningless due to negative values (e.g., operating losses).
- Impact of Structural Changes:
- Mercedes data for 2020 and earlier includes its truck business; after the 2021 spin-off, data reflects only the passenger car and van business, making pre- and post-2021 margins not directly comparable.
- Aston Martin and Porsche only went public in 2018 and 2022, respectively; no public financial data is available prior to their listings for inclusion in the sample.
- Comparability Insight: Ferrari has maintained continuous financial data since its IPO in 2015, unaffected by any business divestitures, making historical comparisons of its operating margin more stable.
Companies/Assets Involved
| Company | Role | Key Data/Status |
|---|---|---|
| Ferrari | Benchmark | Complete data, no structural changes; operating margin consistently high (industry-leading level mentioned earlier in the report) |
| Aston Martin | Comparison group | IPO in 2018, early data missing; operating losses may result in negative margins but not included |
| Porsche | Comparison group | IPO in 2022, limited historical data |
| Mercedes (formerly Daimler) | Comparison group | Includes truck business before 2020; after 2021, only cars/vans, data scope changed twice |
Investment Implications
When making cross-sectional comparisons of operating margins, investors should prioritize Ferrari's data as a stability anchor. For Mercedes, manual adjustments are needed, or only data from 2021 onward should be analyzed to maintain consistency. For Aston Martin and Porsche, a longer post-IPO period is necessary to accumulate a comparable range. For companies lacking complete historical data, fluctuations in operating margin may be amplified by pre-IPO loss periods or business restructuring and should not be used directly for valuation comparisons.
Theme and Background

This chapter reveals Ferrari’s unique advantages in profitability structure by comparing its long-term data on gross margin, operating margin, and net profit margin with those of major automakers (Aston Martin, BMW, Mercedes, Porsche) and luxury benchmark Hermès.
Core Thesis
The report’s central judgment is that Ferrari’s profit margin metrics have moved beyond the competitive range of traditional automakers. Its gross margin and operating margin levels are closer to luxury group Hermès than to any peer. This qualitative shift in profitability structure is the key logic supporting its long-term valuation premium. A contrarian point: even during the pandemic-stricken 2020, Ferrari’s gross margin remained at 51.3%, and its operating margin only fell from 24.4% to 20.7%, demonstrating strong earnings stability, while Aston Martin saw its operating margin plummet to -52.8% in the same year.
Key Arguments and Data
Gross Margin:
Data shows that Ferrari’s average gross margin from 2015 to 2025 was 50.5%, with a median of 51.3%. This is significantly higher than traditional automakers:
- The highest peer, Porsche, had an average gross margin of only 32.9%, a gap of about 18 percentage points.
- Over the same period, Hermès’ average gross margin was 69.7%, but Ferrari is already in the same order of magnitude (50–72% range).
- Ferrari’s gross margin fluctuated very little: a high of 51.7% (2017) and a low of 47.5% (2015), with a range of only 4.2 percentage points; in contrast, Aston Martin’s gross margin swung wildly between 18.2% and 43.4%.
Operating Margin:
| Company | 2024 Operating Margin | 2015–2025 Average | Key Observations |
|---|---|---|---|
| Ferrari | 28.3% | 23.7% | Consistent upward trend, reaching 29.5% in 2025 |
| Porsche | 15.3% | (2022–2025 average approx. 15.1%) | Dropped to 1.1% in 2022 due to IPO dilution, then recovered |
| BMW | 8.1% | 9.2% | Moderate stability |
| Mercedes | 7.3% | 6.8% | Lower figures during periods including truck business |
| Aston Martin | -6.3% | -9.2% | Losses in 5 out of 8 years |
| Hermès | 40.5% | 36.5% | Luxury benchmark |
Net Profit Margin Comparison:
Ferrari’s average net profit margin from 2015 to 2025 significantly outperformed all automaker peers, trailing only Hermès. Specifically, Ferrari recorded positive net profit in all of the past 11 years, while Aston Martin posted net losses in most years.
Companies/Assets Involved
- Ferrari: The benchmark object of analysis. Key indicators show that its profitability balances a much smaller revenue scale (relative to mainstream automakers) with profit levels approaching luxury goods, making it the core asset favored by the report.
- Hermès: Serves as the reference for luxury pricing power and margin ceiling. Ferrari’s gross margin (50.5%) is already notably close to Hermès (69.7%), suggesting that the market has repriced Ferrari’s brand pricing power according to luxury logic.
- Aston Martin: Serves as a negative example for comparison. Its 2020 operating margin of -52.8% and average operating margin of -9.2% confirm that luxury car brands cannot convert into sustainable profits without achieving scale and cost control.
- BMW / Mercedes / Porsche: Represent the average level of traditional and emerging premium automakers. The operating margins of these three companies range between 5% and 16%, unable to compete with Ferrari’s level above 25%. Notably, Porsche’s margin dropped sharply to 1.1% after its 2022 IPO, illustrating the erosion of profitability from capital expenditure pressures.
Investment Implications
1. Confirming Ferrari’s luxury attributes rather than auto manufacturing attributes: It is reasonable for investors to apply Hermès’ forward profit margin assumptions (rather than automaker templates) in Ferrari’s valuation models, supporting its current P/E ratio more than 10 times that of traditional automakers.
2. Beware of margin downside risks among peers: Aston Martin’s persistent losses and Porsche’s margin deterioration post-IPO indicate that the luxury car market is not a natural guarantee of pricing power. Ferrari’s margin moat, maintained through high customization (personalization options account for over 50% of orders) and limited supply, is not easily replicable.
3. Focus on gross margin stability as an invisible moat: Ferrari’s gross margin declined less than one percentage point during the pandemic (while Aston Martin’s was cut in half), essentially reflecting the low cyclical sensitivity of its customer base. This feature is a more solid underlying support for the investment thesis than net profit margin alone.

Theme and Background
This section analyzes the financial leverage levels and health of various companies by comparing the Net Debt/EBITDA ratios of Ferrari and its main competitors (Aston Martin, BMW, Mercedes, Porsche, Hermès). The data covers the period from 2013 to 2025, highlighting Ferrari's significant advantage in debt management and the sharp financial deterioration of Aston Martin in 2025 due to worsening profitability.
Core View
The author argues that Ferrari's Net Debt/EBITDA ratio has long remained in a very low range of 10%-23% (i.e., 0.10-0.23x), far below other automakers and even below the luxury benchmark Hermès. This metric indicates that Ferrari possesses an extremely solid balance sheet and very low financial risk, serving as a key support for its long-term valuation premium. Counterintuitively, although Aston Martin is also an ultra-luxury brand, its Net Debt/EBITDA ratio has been negative or elevated for an extended period, worsening further in 2025 due to a sharp decline in EBITDA, exposing its fragile profit structure and operational risks.
Key Arguments and Data
Comparison of Net Debt/EBITDA ratios (%) for each company in recent years (Note: negative values represent anomalies caused by negative net debt or negative EBITDA, used only for trend comparison):
| Company | 2019 | 2020 | 2021 | 2022 | 2023 | 2024 | 2025 |
|---|---|---|---|---|---|---|---|
| Ferrari | 22.9% | 18.5% | 17.6% | 19.5% | 18.3% | 21.0% | 22.8% |
| Aston Martin | -5.7% | -11.4% | -67.1% | -17.3% | -38.2% | -13.9% | -20.4% |
| BMW | 7.3% | 4.7% | 3.8% | 11.1% | 12.6% | 7.3% | 5.1% |
| Mercedes | 4.3% | 1.4% | 2.4% | 8.0% | 9.7% | 9.3% | 7.0% |
| Porsche | 12.2% | 13.2% | 12.7% | 9.0% | 1.2% | 10.1% | 11.5% |
| Hermès | 23.5% | 22.2% | 21.7% | 27.2% | 29.0% | 32.1% | 30.3% |
Key data support:
- Ferrari's Net Debt/EBITDA ratio in 2025 is 22.8%, consistently lower than all automotive peers (BMW 5.1%, Mercedes 7.0%, Porsche 11.5%) and far below Aston Martin's -20.4% (the negative value reflects net debt being negative but EBITDA severely loss-making).
- Aston Martin's EBITDA margin in 2025 plummeted from approximately 16% in 2024 to 6%; revenue fell 21%, gross profit dropped 37%, and gross margin compressed from 37% to 29%; operating loss widened from £100 million in 2024 to £259 million.
- Hermès, as a luxury benchmark, has a Net Debt/EBITDA ratio between 25%-32%, higher than Ferrari, indicating that Ferrari maintains a low-debt profile while achieving a high-margin model similar to luxury goods.
Companies/Assets Involved
- Ferrari (RACE): The healthiest finances, with Net Debt/EBITDA persistently <23% and a stable trend; the author implicitly holds a bullish view.
- Aston Martin (AML.L): Extremely deteriorating finances, with EBITDA margin halved in 2025, both revenue and gross profit declining, and operating loss expanding; the author is clearly bearish, noting it is severely impacted by macro/tariff shocks.
- BMW, Mercedes, Porsche: Traditional luxury automakers, with Net Debt/EBITDA fluctuating in the 1%-13% range, better than Aston Martin but far inferior to Ferrari; neutral to negative comparison.
- Hermès (RMS.PA): A luxury benchmark, with Net Debt/EBITDA slightly higher than Ferrari (25%-32%) but still solid; as a reference, it highlights Ferrari's uniqueness of "luxury-like + ultra-low debt."
Investment Implications
- Long Ferrari: The extremely low Net Debt/EBITDA ratio provides strong risk resistance. During economic downturns or tariff shocks, Ferrari has a greater financial buffer than peers, supporting the continuation or even expansion of its valuation premium.
- Avoid Aston Martin: The comprehensive deterioration of financial metrics in 2025 reveals the fragility of its business model under macroeconomic pressure. Operating losses and debt risks are likely to further weigh on the stock, making it a sell or avoid candidate.
- Monitor Porsche's financial stability post-IPO: After its listing in 2022, Net Debt/EBITDA rebounded from 1.2% to 11.5%, but it remains higher than Ferrari's. Continued observation of its leverage changes is warranted.
Theme and Background
This chapter compares Ferrari with Aston Martin, BMW, Mercedes, Porsche, and Hermès on key financial metrics from 2015 to 2025: Net Debt/EBITDA, Net Debt/(Net Debt + Equity), and ROIC (Return on Invested Capital). The comparison aims to demonstrate Ferrari's industry-leading position in capital structure efficiency and profitability.
Core Thesis

The report argues that Ferrari has an exceptionally robust balance sheet and superior returns on capital, which are the core financial advantages distinguishing it from competitors. Specifically:
- Ferrari's financial leverage is extremely low and continuously improving, while competitors, especially Aston Martin, bear high debt pressure.
- Ferrari's ROIC has remained above 20% for an extended period and is on an upward trend, far exceeding automotive peers and approaching the level of luxury brand Hermès.
Key Arguments and Data
The key data supporting the core thesis comes from a comparison of financial metrics for 2015-2025:
1. Financial Leverage Comparison (Net Debt/EBITDA)
- Ferrari's metric has been below 1x for an extended period, falling to 0.3x in 2025, with an 11-year average of 0.7x and a median of 0.6x.
- Aston Martin carries the heaviest debt burden, reaching 15.5x in 2024, with an 11-year average of 5.8x.
2. Capital Structure Comparison (Net Debt/(Net Debt + Equity))
- Ferrari's non-equity financing share has been declining continuously, from 1.0x in 2015 to 0.2x in 2025, with an 11-year average of 0.5x. This indicates that its financing is almost entirely from equity, implying extremely low financial risk.
- Aston Martin's average is 0.6x, with 0.6x and 0.8x in 2024 and 2025 respectively, indicating relatively high leverage.
3. Return on Capital Comparison (ROIC)
- Ferrari's ROIC grew from 12.0% in 2015 to 33.1% in 2025, with an 11-year average of 26.3%.
- In comparison, BMW (average 5.7%), Mercedes (average 6.2%), and Aston Martin (average 11.7%) all fall far below Ferrari.
- Hermès has an average ROIC of 50.4%, representing another extreme besides Ferrari.
| Metric (2015-2025 Average and 2025 Value) | Ferrari | Aston Martin | BMW | Mercedes | Porsche | Hermès |
|---|---|---|---|---|---|---|
| Net Debt/EBITDA (Average) | 0.7x | 5.8x | 4.3x | 4.1x | Not fully disclosed | -1.5x |
| Net Debt/EBITDA (2025) | 0.3x | 5.8x | 3.5x | 3.7x | Not fully disclosed | -1.6x |
| Net Debt/(Net Debt+Equity) (Average) | 0.5x | 0.6x | 0.5x | 0.6x | 0.1x | -1.8x |
| Net Debt/(Net Debt+Equity) (2025) | 0.2x | 0.8x | 0.4x | 0.5x | 0.1x | -1.8x |
| ROIC (Average) | 26.3% | 11.7% | 5.7% | 6.2% | 12.9% | 50.4% |
| ROIC (2025) | 33.1% | 11.7% | 4.5% | 3.2% | 1.1% | 49.2% |
Companies/Assets Involved
- Ferrari N.V.: Core analysis target. By comparing its financial data with competitors, the report confirms its extremely low leverage (Net Debt/EBITDA consistently <1x), healthy capital structure (very high equity proportion), and exceptionally high return on capital (average ROIC above 26%). Bullish.
- Aston Martin Lagonda: Serves as the primary counterexample. Its Net Debt/EBITDA has been persistently high (average 5.8x), peaking at 15.5x in 2024 due to losses. Bearish.
- Bayerische Motoren Werke AG (BMW), Mercedes-Benz Group AG (Mercedes): Represent mass-market luxury automakers with debt levels and returns in the middle of the industry, showing a significant gap versus Ferrari.
- Porsche AG: Has relatively low financial leverage; ROIC reached above 20% in the early period after its IPO but fluctuated significantly from 2022 to 2025, falling to 1.1% in 2025 for reasons to be investigated.
- Hermès International: As the "gold standard" in the luxury industry, its net cash position (negative net leverage) and extremely high ROIC (average 50.4%) provide a reference frame for Ferrari's valuation premium.
Investment Implications
- Ferrari's financial characteristics support its valuation premium. The report demonstrates through data that Ferrari not only possesses strong brand and product power but also has financial performance (low leverage, high ROIC) fully aligned with the scarcity attributes of true luxury goods, rather than that of an ordinary automaker. Investors should value it as a luxury asset rather than an automotive stock.
- Avoid investing in highly leveraged automotive companies. Aston Martin's financial fragility (extremely high leverage and volatile returns) makes it highly risky when facing market downturns or technological changes (such as electrification investment), indicating its business model lacks the moat and pricing power that Ferrari possesses.