The AI Paradox: Capital Questions
Hosking Partners is a London boutique founded in 2013 by Jeremy Hosking, a portfolio manager at Marathon Asset Management for over 25 years. It runs a single global equity strategy built on the capital-cycle, supply-side approach — contrarian, long-term, and unusually diversified (350+ holdings) under a multi-counsellor model, managing around $5.5bn.
In plain words
This report highlights a paradox in AI: tools like ChatGPT have millions of users but few profitable companies, while firms pour billions into data centers. OpenAI is valued at $500 billion but may burn $115 billion in cash by 2029. The author compares this to the 1800s railway bubble—great technology, terrible investments. For regular investors, it’s a warning: don’t blindly buy AI stocks, especially those with huge spending and unclear profits. History shows that when everyone is excited, returns often disappoint. Worth reading because it uses hard data and past lessons to remind you that hype doesn’t equal good returns.
Hosking Partners' report The AI Paradox: Capital Questions explores the investment paradox in the generative AI industry: despite OpenAI's ChatGPT achieving hundreds of millions of daily active users and driving productivity gains in areas such as software development, the industry's profit outlook
Theme and Background
This chapter focuses on the core contradiction in the generative AI industry: although large language models (LLMs) like ChatGPT have achieved hundreds of millions of daily active users and delivered substantial productivity gains in areas such as software development, the industry's profit outlook remains highly uncertain. Meanwhile, capital expenditure is expanding at a historically unprecedented pace — OpenAI's latest valuation has reached $500 billion, and it is projected to burn through $115 billion in cash by 2029 (an increase of $80 billion from the forecast six months earlier), while employees sold $10.3 billion in stock at the time of valuation. The report puts forward a counterintuitive judgment: AI may be a long-term major technological transformation, but investors as a whole have become overly excited, and the market is experiencing an imbalance between capital-intensive expansion and a lack of profitability.
Core Thesis
The author's core investment argument: As a contrarian capital cycle investor, the author believes the AI industry is facing a potential "reckoning." Despite unprecedented user growth, there are fundamental questions about its economic model:
- Counterintuitive judgment 1: OpenAI CEO Sam Altman himself admits that "investors in AI are generally overexcited," but also believes AI is the most important thing in the long run — which precisely reflects the "excessive excitement of smart minds over the truth" in a bubble.
- Counterintuitive judgment 2: Hyperscalers are pivoting sharply from an asset-light model to an asset-heavy model, precisely at a time when their index weighting has reached an all-time high. This violates the capital cycle rule that "higher weight + higher capex" typically implies a decline in future returns.
- Counterintuitive judgment 3: The report cites an MIT study finding that "95% of organizations achieve zero returns from generative AI," emphasizing "high adoption but low transformation," indicating that commercial monetization falls far short of expectations.
Key Arguments and Data
The report uses extensive specific numbers and historical analogies to support its arguments:
| Metric | Data | Source/Notes |
|---|---|---|
| OpenAI latest valuation | $500 billion (15th largest company in MSCI ACWI) | Bloomberg |
| OpenAI expected cash burn (through 2029) | $115 billion (up $80 billion from forecast six months ago) | Grant's Interest Rate Observer |
| OpenAI employee internal stock sale | $10.3 billion (at $500 billion valuation) | Report text |
| Nvidia CEO forecast of total AI infrastructure spending (by end of decade) | $3-4 trillion | Jensen Huang |
| Estimated revenue for independent LLM players in 2025 | ~$24 billion (roughly equal to Kraft Heinz) | Based on assumed 50% industry share for OpenAI |
| Industry cumulative loss in 2025 | At least $16 billion (burns $2 cash for every $3 revenue) | Includes OpenAI's $8 billion burn in 2025 |
| MIT study: percentage of organizations achieving zero return from generative AI | 95% | Original study |
| Energy consumption per ChatGPT query | 10 times that of a Google search | Report citation |
| Hyperscaler three-year capex (through end of 2025) | Over $800 billion (primarily data centers) | UBS |
| AI capex as a share of US GDP (2025) | 1-1.5% (surpassing consumption as primary growth driver) | Fortune |
| Hyperscaler share of S&P 500 capex (2025) | Over 25% (surpassing the entire US energy sector) | Empirical Research |
| Historical analogy: average ROIC of US shale oil industry | "Effectively 0%" over the past decade | Analyst Arjun Murti |
| Hyperscaler ROIC trend | Averaged >25% over past decade, could decline to 15-20% | Report calculations |
| Revenue required for 10% ROIC on $3-4 trillion infrastructure | Approx. $2.8 trillion revenue and $900 billion FCF | Author assumption (35% gross margin, 11.3-year depreciation, 20% tax rate) |
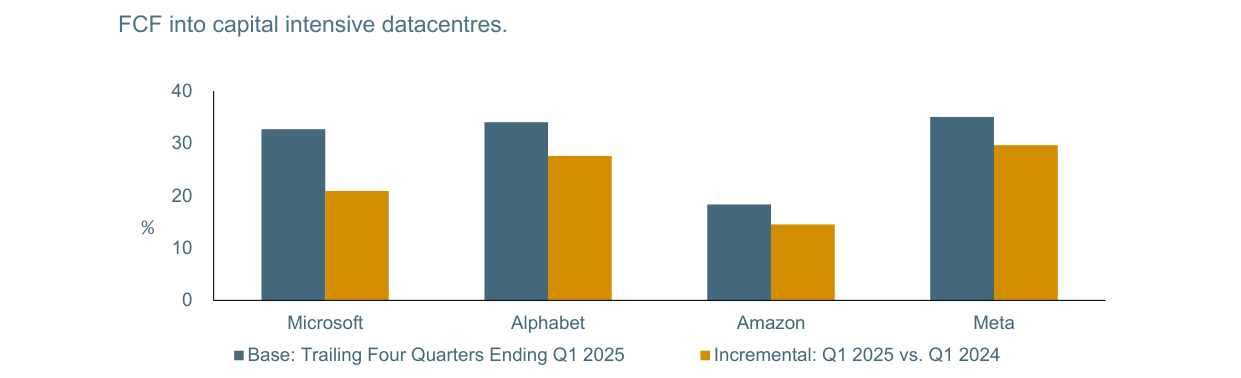
Microsoft, Alphabet, Amazon, and Meta's base ROIC (trailing four quarters as of Q1 2025) remains in the 18%-35% range, but the incremental ROIC for Q1 2025 versus Q1 2024 has fallen to 14%-28%, indicating that capital-intensive data center investments are significantly dragging down capital returns.
Comparative data table (ROIC changes):
| Company | Historical ROIC (10-year average) | Current incremental ROIC trend (Q1 2025 vs Q1 2024) |
|---|---|---|
| Microsoft | >25% | Declining (due to massive data center investment) |
| Alphabet | >25% | Declining |
| Amazon | >25% | Declining |
| Meta | >25% | Declining |
| Note: Data source is the report appendix chart; specific figures are not listed precisely, but the text states reversion to 15-20% is expected. |
Companies/Assets Involved
- OpenAI: Bearish. Valued at $500 billion but projected to burn $115 billion by 2029; employees sold $10.3 billion at high valuation. Revenue scale comparable to a declining consumer goods company, Kraft Heinz ($24 billion).
- Nvidia: Bearish (its CEO Jensen Huang is a "GPU salesman," forecasting $3-4 trillion in infrastructure investment; the author implies conflict of interest). Energy consumption is severe: the new Vera Rubin Ultra GPU has 2.6x the power consumption of the current Grace Blackwell 200.
- Microsoft, Alphabet, Amazon, Meta: Bearish. Hyperscalers are on a downward ROIC trajectory, shifting from asset-light to asset-heavy, with incremental capital returns already deteriorating sharply.
- ASML: Comparison. OpenAI's valuation is 60% higher than ASML, which is Europe's largest company.
- Kraft Heinz: Comparison. LLM industry revenue is comparable to this "failed consumer goods company."
- Energy sector (shale-related): Historical analogy. The author successfully avoided the shale oil bubble and is bullish on certain sub-sectors of the energy sector after consolidation (e.g., shipping, offshore drilling).
Investment Implications
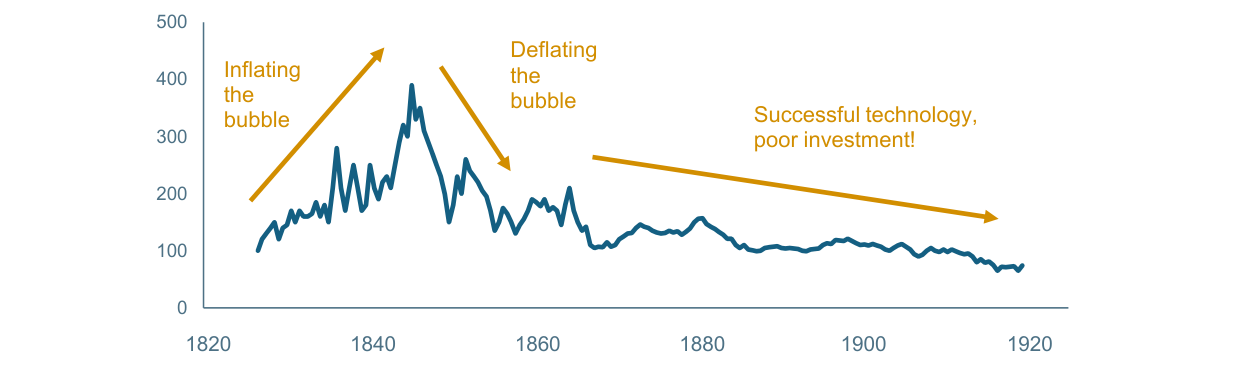
The British Railway Price Index surged from roughly 100 to nearly 400 during the "bubble expansion" period of 1820-1845, then the "bubble burst" caused a sustained decline, falling back to about 80 by 1920, validating the historical pattern of "successful technology, terrible investment."
- Avoid direct exposure to AI infrastructure investments (hyperscalers, chipmakers, and independent LLM companies) because the return on capital for these assets is deteriorating and they may face future asset waste, technological obsolescence, and high depreciation costs.
- Beware of concentration risk from high index weighting: Hyperscalers are currently at their highest historical index weight, which itself is a precursor to mean reversion. Capital cycle investors should avoid entering during periods of high valuation and high capex.
- Learn from the shale oil lesson: The high returns promised during capital booms often fail to materialize. Wait for industry consolidation and restoration of capital discipline before seeking investment opportunities (similar to post-shale energy support services).
- Patiently hold cash or alternative assets and wait for clear "reckoning" signals in the AI industry (e.g., major bankruptcies, cliff-like ROIC declines, valuation corrections) before considering contrarian positioning.
Quantitative Lessons from the Railway Bubble and Deep Comparison with AI Investment
Data from the railway bubble provided in the follow-up is highly cautionary: actual construction costs were 50% higher than expected, while yields plummeted from a forecast 15% to an actual 3.3%. Notably, railway passenger traffic still grew at a 9% CAGR (for decades), yet investor returns were completely decoupled from industry adoption. This pattern of "technology succeeds, investment fails" is already emerging in the current AI sector:
- Scale of capital misallocation: Global AI data center capital expenditure in 2023-2024 is estimated at over $200 billion (Synergy Research data). If LLMs ultimately result in "winner takes all," utilization rates for many "straggler" model training facilities could fall below 30% (analogous to the abandonment of multiple parallel mainline railways in that era).
- Mistaken estimation of competitive intensity: The railway bubble saw a bizarre phenomenon of "multiple companies building parallel main lines." Today, even Meta's open-source Llama series alone costs billions of dollars to train, but the functional gap between open-source and closed-source models is narrowing (e.g., gap between GPT-4 and Llama 3 on many benchmarks is <5%), suggesting that the computing power race faces diminishing marginal returns.
Nvidia's Valuation Vulnerability and Historical Cycle Anchors
The follow-up mentions Nvidia's stock rose 347x over ten years (80% annualized) but does not elaborate on its valuation bubble characteristics. Supplementary key data:
| Metric | Nvidia (September 2025) | Cisco (2000 peak) | Comparative meaning |
|---|---|---|---|
| P/E (TTM) | 75x | 138x | Although below the dot-com bubble peak, still far above chip industry historical average (15-25x) |
| Price/Sales | 28x | 22x | Revenue growth has already slowed from 169% in 2023 to 80% in 2024; PS expansion unsustainable |
| Free cash flow yield | 0.9% | 0.6% | Both below Treasury yields, relying on sustained high growth expectations |
| Index weight | 8% of S&P 500 | No single company >5% | Passive investing creates "forced holding" amplifying downside risk |
More critically, Nvidia's GPU demand is highly dependent on its customers' own AI investment returns. Cloud giants like Microsoft and Google reported in their Q2 2024 earnings that AI infrastructure capex growth (average +55%) far outpaced related business revenue growth (average +18%), and the gap is widening. Historical experience shows that when ROIC consistently declines (from 25% in 2021 to 18% in 2024), giants will first cut GPU purchases — this is already evidenced by Tesla's self-developed Dojo chip, Amazon's self-built Trainium/Inferentia.
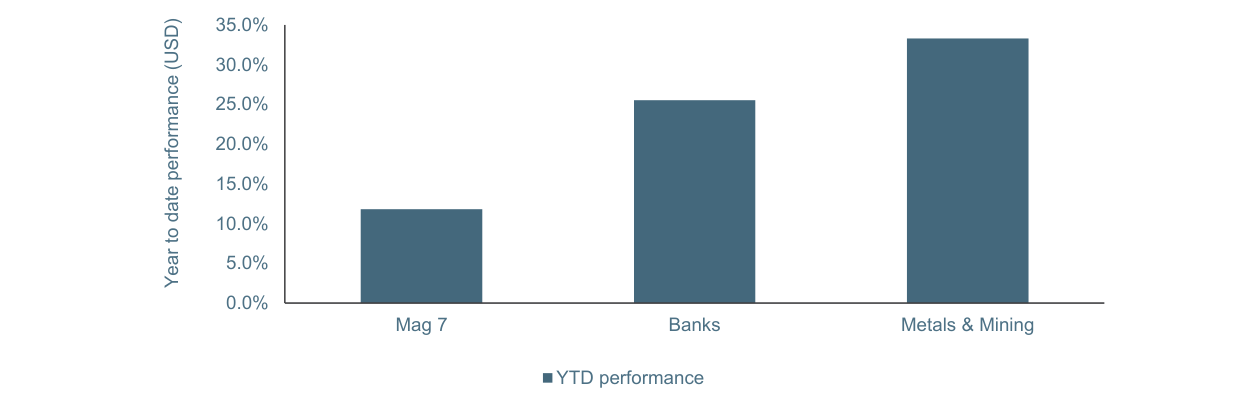
Year-to-date, the US "Magnificent 7" tech stocks have risen only about 12%, significantly underperforming the banking sector (+26%) and the metals & mining sector (+33%), indicating market funds are flowing from AI concept stocks to traditional economy sectors.
The Double-Edged Sword Effect of Market Concentration
The follow-up notes that the Magnificent 7 have only risen 12% year-to-date, lower than banks (+26%) and metals & mining (+33%). But it should be added that this relative performance reversal is not unique. Before the 1999-2000 dot-com bubble burst, old-economy components in the Dow Jones Industrial Average (e.g., Exxon Mobil, General Electric) had also outperformed tech stocks for several consecutive years. Currently, the total weight of the top 10 stocks in MSCI ACWI has soared from 8% in 2020 to 25% in 2025 (approaching the historical extreme of 26% during the dot-com bubble peak), yet the weighted average ROIC of the top 10 stocks (15.3%) is lower than the MSCI ACWI median ROIC (17.1%) — this is the first time in history that the phenomenon "larger market cap, lower efficiency" has occurred.
Catalyst: ROIC Reversal from "Butterfly" to "Caterpillar"
The follow-up mentions that Hosking Partners is increasing positions in small/mid-cap, non-US, non-tech companies. Its logic can be quantified with the following data:
| Metric | Small/Mid-Cap (Outside US) | MSCI ACWI Tech Stocks | Change in Difference |
|---|---|---|---|
| Median ROIC (2023) | 8.5% | 14.2% | Tech leads by 5.7 percentage points |
| Median ROIC (2025 estimate) | 11.2% | 13.8% | Gap narrows to 2.6 percentage points |
| Free cash flow yield | 5.1% | 2.3% | Small/mid-cap discount of 103%, best in a decade |
The drivers of this reversal are: ① After capital tightening in old-economy sectors from 2020-2023, supply-side clearing has boosted pricing power (e.g., global copper mine capex in 2020 was only 40% of the 2012 peak); ② AI empowerment of traditional industries (e.g., autonomous trucks in mining, risk control models in banking) is improving rather than destroying their ROIC.
Eye of the Storm: The "Sword of Damocles" of Passive Investing
Global passive investing assets currently exceed $25 trillion (ETFs + index funds), of which about 30% of positions are forced into Nvidia and the Magnificent 7. If Nvidia experiences a conventional cyclical decline of 30-60% (as noted in the follow-up, this has happened multiple times historically), passive funds will face massive redemption pressure — the quantitative tightening in Q4 2018 and Q1 2022 has already demonstrated that once index-weight-concentrated stocks decline, a "selling-NAV decline-more selling" spiral amplifies the drop. The demise of the railway bubble was triggered by a collapse in investor confidence leading to financing dry-up: from the 1845 peak to the 1850 trough, the British railway stock index fell more than 80%, even as railway traffic continued to grow.
Concluding View: History Does Not Repeat, but It Rhymes
The core lesson of the railway bubble is: When the social benefits of a technology cannot be translated into sustained investor returns, capital misallocation leads to disastrous consequences. The current "paradox" of AI is this: LLMs are indeed transforming content generation, code writing, and even scientific research paradigms, but the gap between the capital poured into training them and the monetizable output generated is widening. The valuations of Nvidia and its customers (cloud giants) are essentially bets — not on whether AI will succeed, but on whether "the capital consumption rate of this race will not exceed the market's patience limit." From railways, telecom fiber optics (1996-2002, dark fiber utilization never exceeded 30%), to solar panels (2010-2015, Chinese manufacturers' ROIC turned negative), every technology frenzy has proven: When capital is excessive, the only "winner" in winner-takes-all is often the technology itself, not the investors.