Q3 2025 - Quarterly Report Commentary
Hosking Partners is a London boutique founded in 2013 by Jeremy Hosking, a portfolio manager at Marathon Asset Management for over 25 years. It runs a single global equity strategy built on the capital-cycle, supply-side approach — contrarian, long-term, and unusually diversified (350+ holdings) under a multi-counsellor model, managing around $5.5bn.
In plain words
This report says global stock markets are shifting: US stocks, especially tech, are at record-high valuations (like price-to-earnings ratios), and AI spending may not pay off. Meanwhile, Japan, UK, and emerging markets (e.g., China) are cheaper and improving. For regular investors, it suggests looking beyond US giants—like metal mining (platinum, copper) due to supply shortages, or Chinese tech firms (Alibaba, Tencent) at lower prices. It also shows US bank stocks have beaten the 'Magnificent 7' tech stocks over 1, 2, and 5 years. The key is to diversify and avoid overpaying for hype.
Hosking Partners’ Q3 2025 letter reports that its diversified global strategy delivered an absolute net return of 11%, with a quarterly excess return of 3.4%, year-to-date alpha of +6.1%, and alpha of +3.9% relative to the MSCI AC World over the past 12 months. The core argument is that global equit
Theme and Background
The report discusses the global equity market entering a new regime: U.S. stock valuations are at "once-in-a-generation" extremes (with composite metrics across P/E, P/B, P/S, etc. surpassing peaks from 1929, 1965, and 1999), while AI speculative excess drives declining returns on capital. In contrast, Japan, the UK, and emerging markets offer low valuations, constrained capital supply, and improving prospects. Hosking Partners' diversified global strategy delivered an 11% absolute net return in Q3, with excess returns of 3.4%, year-to-date alpha of +6.1%, and a trailing 12-month alpha of +3.9% versus the MSCI AC World.
Core Thesis
The author clearly asserts that global equity markets are shifting from a U.S.-centric growth concentration toward a broader market. Key contrarian positions include:
- Significantly underweighting the U.S. at 30% (benchmark 65%), arguing that U.S. valuations are extreme and AI investment is excessive.
- Overweighting the metals and mining sector (10.7% weight vs. index 1.7%), with a particularly bullish view on platinum group metals (PGM), believing supply contraction will drive prices higher.
- Favoring Japan, UK small-caps, and emerging markets (especially Chinese tech leaders), seeing these regions as being in the early stages of improving returns on capital.
Key Arguments and Data
1. Extreme U.S. market valuations: The report cites the average percentile across multiple valuation metrics (long-term P/E, forward P/E, CAPE, P/B, P/S, EV/EBITDA, Q ratio, market cap/GDP), showing U.S. equities at an all-time high, exceeding levels seen in 1929, 1965, and 1999.
2. AI bubble risk: Nvidia has risen 347x cumulative over the past 10 years (80% annualized), reaching an 8% weight in the S&P 500 (an all-time high) and 5% in the MSCI ACWI. Hyperscalers are pouring hundreds of billions into data centers, creating downside risk for returns on capital.
3. Metals and mining supply bottlenecks: PGM supply is steadily declining — the last investment cycle in South Africa's deep-level mines began in the late 1990s, and those mines are now reaching the natural end of their lives. Current PGM prices are less than 50% of gold (historically they were twice gold), requiring prices well above $2,500/oz to sustain production. PGM mining stocks rose roughly 50% in Q3, contributing +116 bps to returns; year-to-date contribution is +263 bps. The platinum market faces a deficit of nearly 1 million ounces in 2025.
4. Coal and copper: Coal stocks contributed +44 bps in Q3, copper miners +29 bps. The report describes using price volatility to rotate: trimming Peabody when coal nearly doubled and adding to Freeport-McMoRan during copper's sharp decline.
5. China and Japan: Q3 saw Chinese and Hong Kong markets rise approximately 20% in USD terms. The author believes the market is beginning to reward China's AI approach based on open-source, low-cost power, and self-sufficient chips. The strategy's 2% China weight contributed +52 bps, half of which came from Alibaba and Tencent. Japan's 14.7% weight (3x the index) contributed +134 bps, with the Japanese stock portfolio rising 8.9% (slightly ahead of the Nikkei's 8.0%).
6. Small and mid-cap stocks: Saga (a UK silver economy company), with a market cap of £400m, trades at a fraction of its 75-year brand's replacement cost. Management targets £100m in operating profit. The stock rose 53% in Q3, contributing +24 bps. A basket of Sri Lankan small-cap stocks (11 holdings) contributed +32 bps.
7. U.S. banks vs. Mag 7: On a total return basis, a U.S. bank basket (including Bank of America, Citigroup, JPMorgan, etc.) has outperformed the Magnificent 7 over 1-year, 2-year, and 5-year periods. A chart shows that from September 2020 to September 2025, HP US Banks' cumulative total return rose to ~225% from 0%, consistently outperforming the Mag 7's ~190%.
| Period (Total Return) | U.S. Bank Basket vs Mag 7 |
|---|---|
| 1 Year | Outperformed |
| 2 Years | Outperformed |
| 5 Years | Outperformed |
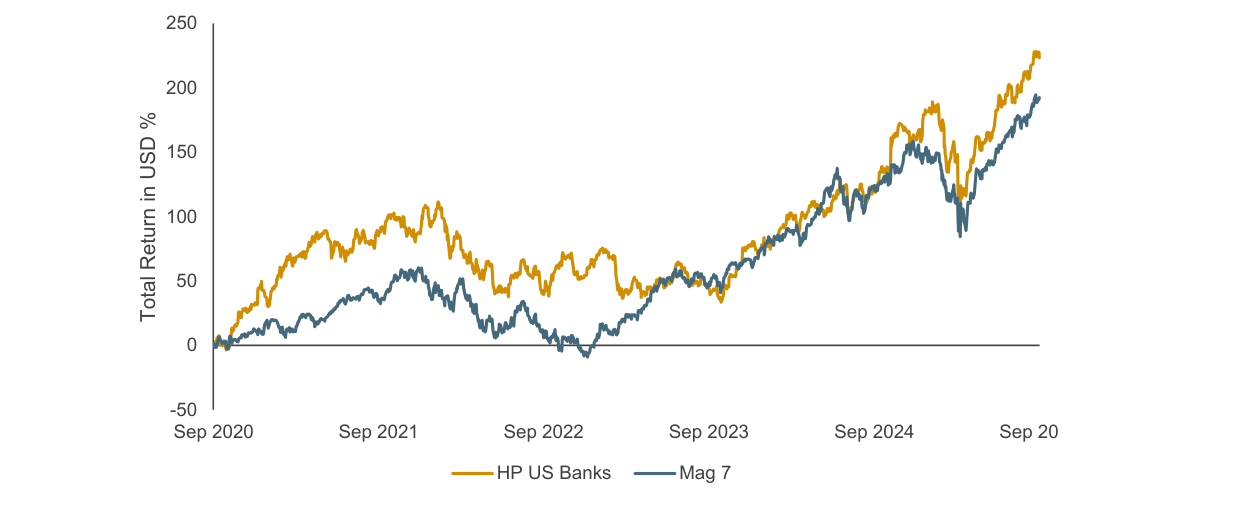
September 2020 to September 2025: HP US Banks total return rose from 0% to ~225%, consistently outperforming the Mag 7's ~190%
Companies/Assets Covered
- Alibaba (Bullish): Down 43% from its peak, valuation still attractive relative to U.S. peers; half of the strategy's China position comes from Alibaba and Tencent.
- Tencent (Bullish): Similar to Alibaba, valuation is relatively reasonable.
- Saga (Bullish): UK elderly-focused services company, market cap £400m, target operating profit £100m, brand replacement cost far above market cap.
- Freeport-McMoRan (Bullish): A high-quality global copper resource company, owning one of two U.S. smelters; strategic value is significant, added to during the pullback.
- Peabody (Trimmed): After coal prices nearly doubled, the author recycled capital.
- Chemical stocks (Bullish/adding on dips): Croda, LyondellBasell, Quaker Houghton, Lanxess, Synthomer.
- Spirits stocks (Bullish/adding on dips): Diageo, Pernod Ricard, Remy Cointreau.
- U.S. large financials (Partially trimmed): Wells Fargo, PNC, Citigroup. The report acknowledges the bank basket's strong performance over the past five years but chooses to take profits.
- PGM miners (Bullish, implied): Largest contribution to returns, but individual names are not listed.
- Japanese stock basket (Bullish): Benefiting from expectations of industry consolidation; new Prime Minister Takaichi supports M&A.
- Sri Lankan small-cap stocks (Bullish): Small-cap companies in a recovering economy.
- Nvidia (Cautious/Bearish): Excessive weight; returns on AI capital spending are questionable.
Investment Implications
1. Reduce exposure to large-cap U.S. tech stocks: Valuations are extreme and returns on AI investment face reversal; index weight concentration adds systemic risk.
2. Increase allocation to supply-constrained hard assets: Metals and mining such as PGM, copper, and coal face long-term capital underinvestment, with supply deficits likely to push prices higher. Focus especially on PGM (platinum deficit near 1 million ounces).
3. Overweight Japan, UK, and emerging markets: These regions offer low valuations, improving capital discipline, and rising M&A activity (Japan); small-cap value stocks present revaluation opportunities (e.g., Saga).
4. Focus on Chinese tech leaders: Alibaba, Tencent, etc., trade at a significant discount to U.S. peers, and China's AI path may be repriced higher.
5. Use market volatility for rotation: When cyclical stocks like coal and copper experience large price swings, rotate into higher-quality, lower-valuation names.
6. Watch for capital flows triggered by AI bubble unwinding: As markets rotate from concentrated mega-cap holdings to broader sectors, previously overlooked asset-heavy companies will benefit from improving ROIC.