Third Point June 2026 Monthly Report
Third Point is the New York hedge fund Daniel Loeb founded in 1995 (now at 55 Hudson Yards), investing opportunistically across long/short equities, corporate and structured credit, CLOs and ventures; its flagship Offshore Fund has compounded at roughly 13% net since 1996. Loeb is famous for his caustic quarterly letters and activist campaigns — Yahoo, Sony, Nestlé and Disney have all been targets — and the letters are long-standing required reading on Wall Street.
In plain words
This report is a monthly update from Third Point, a well-known hedge fund. It shows the fund was flat in June but gained 7.4% in the first half of the year. It lists winning stocks like SK Hynix and TSMC, and losers like Amazon and Nvidia. The fund holds big tech and industrial companies, while shorting smaller firms. The report gives no market commentary—just numbers. For everyday investors, it's a useful window into what a major investor is doing, but don't copy their trades directly. Also, the fee calculations are complex, so the returns shown may not match what each investor actually gets.
Third Point released its June 2026 performance update: Third Point Offshore Fund was flat for the month, with a QTD return of 7.9% and a YTD return of 7.4%. The portfolio is allocated 70% to the Offshore Fund and 30% to Malibu Life Reinsurance. Total portfolio leverage stood at 110.4% (long 65.5% /
Monthly Scorecard
This month: 0.0%; quarter-to-date: +7.9%; year-to-date: +7.4% (Third Point Offshore Fund, net basis). The Master Fund's overall monthly net P&L was likewise flat, at +7.4% year-to-date.
| Metric | Month | QTD | YTD |
|---|---|---|---|
| Third Point Offshore Fund, Ltd. (net) | 0.0% | 7.9% | 7.4% |
| Master Fund All-Longs Gross P&L | +0.6% | — | +9.6% |
| Master Fund All-Shorts Gross P&L | -0.3% | — | +0.9% |
| Master Fund Net P&L | 0.0% | — | 7.4% |
The report provides no benchmark comparison; QTD data is shown only for the Offshore Fund.
Who Contributed, Who Detracted
The monthly P&L was nearly flat: equity longs made +0.6%, shorts lost -0.3%, and credit was slightly negative at -0.2%; year-to-date gains were driven mainly by equity (net +5.5%) and credit (net +1.0%).
The report discloses only the winner/loser lists and does not provide contribution magnitudes or attribution for individual names:
| Category | Name |
|---|---|
| Monthly winners | Kioxia Holdings Corp, SK Hynix Inc, Carpenter Technology Corp, TSMC, Rolls-Royce Holdings PLC |
| Monthly losers | Amazon.com Inc, Alphabet Inc, Indra Sistemas SA, Nvidia Corp, Hut 8 Corp |
| YTD winners | SK Hynix Inc, MasTec Inc, Carpenter Technology Corp, Private Somnigroup International Inc, TSMC |
| YTD losers | CoStar Group Inc, Capital One Financial Corp, CRH PLC, Brookfield Corp |
Equity sector contribution (net P&L):
| Sector | Month | YTD |
|---|---|---|
| Consumer Discretionary | -1.4% | -2.1% |
| Consumer Staples | +0.1% | +0.5% |
| Utilities | -0.2% | +0.3% |
| Energy | 0.0% | -0.1% |
| Financials | +0.1% | -2.8% |
| Healthcare | -0.1% | -0.9% |
| Industrials & Materials | +0.8% | +5.5% |
| Enterprise Technology | +1.3% | +5.1% |
| Media & Internet | -0.3% | +0.2% |
| Portfolio Hedges | 0.0% | -0.2% |
| Total Equities | +0.2% | +5.5% |

The Fund's total equity net exposure was 42.9% (longs 65.5% / shorts -22.6%), total credit net exposure 36.9%, portfolio net exposure 87.6%, and net MTD P&L for the month was 0.0%
On credit: credit was -0.2% net for the month (Performing Corporate & Sovereign -0.2%, Distressed Structured +0.1%); year-to-date credit was +1.0% net (corporate/sovereign +0.6%, Distressed Structured +0.4%), of which high-yield bonds +0.7% YTD and residential mortgage ABS +0.2%. Privates: +0.7% net YTD and +0.1% for the month.
How the Manager Views the Market
This report is a pure data disclosure with no manager market commentary; the stance is [not stated]. Position-structure clues are as follows:
- Total gross leverage of 110.4% (longs 65.5%, shorts 22.8%), net exposure 87.6%.
- Beta-adjusted net exposure of 72.5% (longs 85.1%, shorts 12.7%); delta-adjusted net of 42.9%.
- Geographic exposure: Americas net long 29.1% (48.3% long / -19.3% short), EMEA net long 6.2%, Asia ex-Japan net long 5.7%, Japan net long 2.0%.
- Market-cap distribution: stocks with market caps greater than $50B are net long 37.0%; stocks below $10B are net short 2.5% (longs 4.7%, shorts 7.2%) — the small-cap direction is net short.
- Position structure: 41 longs and 68 shorts; the top-10 longs account for 32% of the portfolio and the top-10 shorts 8%; the top-20 longs 50% and the top-20 shorts 13% — the short book is more dispersed.
Position Shifts: Where They Added, Where They Trimmed
The report does not disclose buy/sell activity during the period and provides no period-start comparison; the following is a period-end position snapshot.
- Top five equity longs: Warner Bros Discovery Inc, Amazon.com Inc, Alphabet Inc, Rolls-Royce Holdings PLC, Quebecor Inc.
- Top five credit longs: Bausch Health Cos Inc, Coreweave Inc, Connect Holding II LLC, Ardagh Group SA, AMC Entertainment Holdings Inc.
- Largest equity sector net exposures: Enterprise Technology 13.1%, Industrials & Materials 13.0%, Media & Internet 11.9%; the largest credit category is Distressed Structured (net exposure 21.2%).
- Amazon.com and Alphabet appear on both the top-five longs list and the monthly loser list; the report does not indicate whether these positions were adjusted.
Fund Matters
Fund entity, fees, and valuation basis:
- Completed the acquisition of Malibu Life Reinsurance SPC on September 12, 2025, and renamed it Malibu Life Holdings Limited on September 22; the company invests most of its assets in the Third Point Offshore Fund (master-feeder structure).
- Asset allocation: Offshore Fund 70%, Malibu Life Reinsurance SPC 30% (company asset basis, as of March 31, 2026).
- Fees: maximum management fee of 2% per annum + 20% incentive allocation; new series performance excludes legacy venture investments and other private-equity-related investments (launched June 1, 2023).
- Valuation hierarchy (ASC 820): Level I 46%, Level II 36%, Level III 18%.
- Net performance is net of operating expenses; portfolio details exclude confidential positions and portfolio-level equity hedges; due to rounding, percentage totals may not add up.
Continuation Analysis: The "Hypothetical Reconstruction" of Fee Attribution and the Strategic Ambiguity of Disclosure Boundaries
Building on the earlier analysis of the Introduction's structure and strategy framework, this section focuses on the new evidence in this continuation: the internal tension in Third Point's Gross/Net P&L attribution methodology, the classification-rule issues exposed by the appendix footnotes, and the regulatory and compliance implications behind the Constructivism/Activism/Post-Activism trichotomy.
1. The Gross/Net Dual-Track System: Two "Truths" Coexist
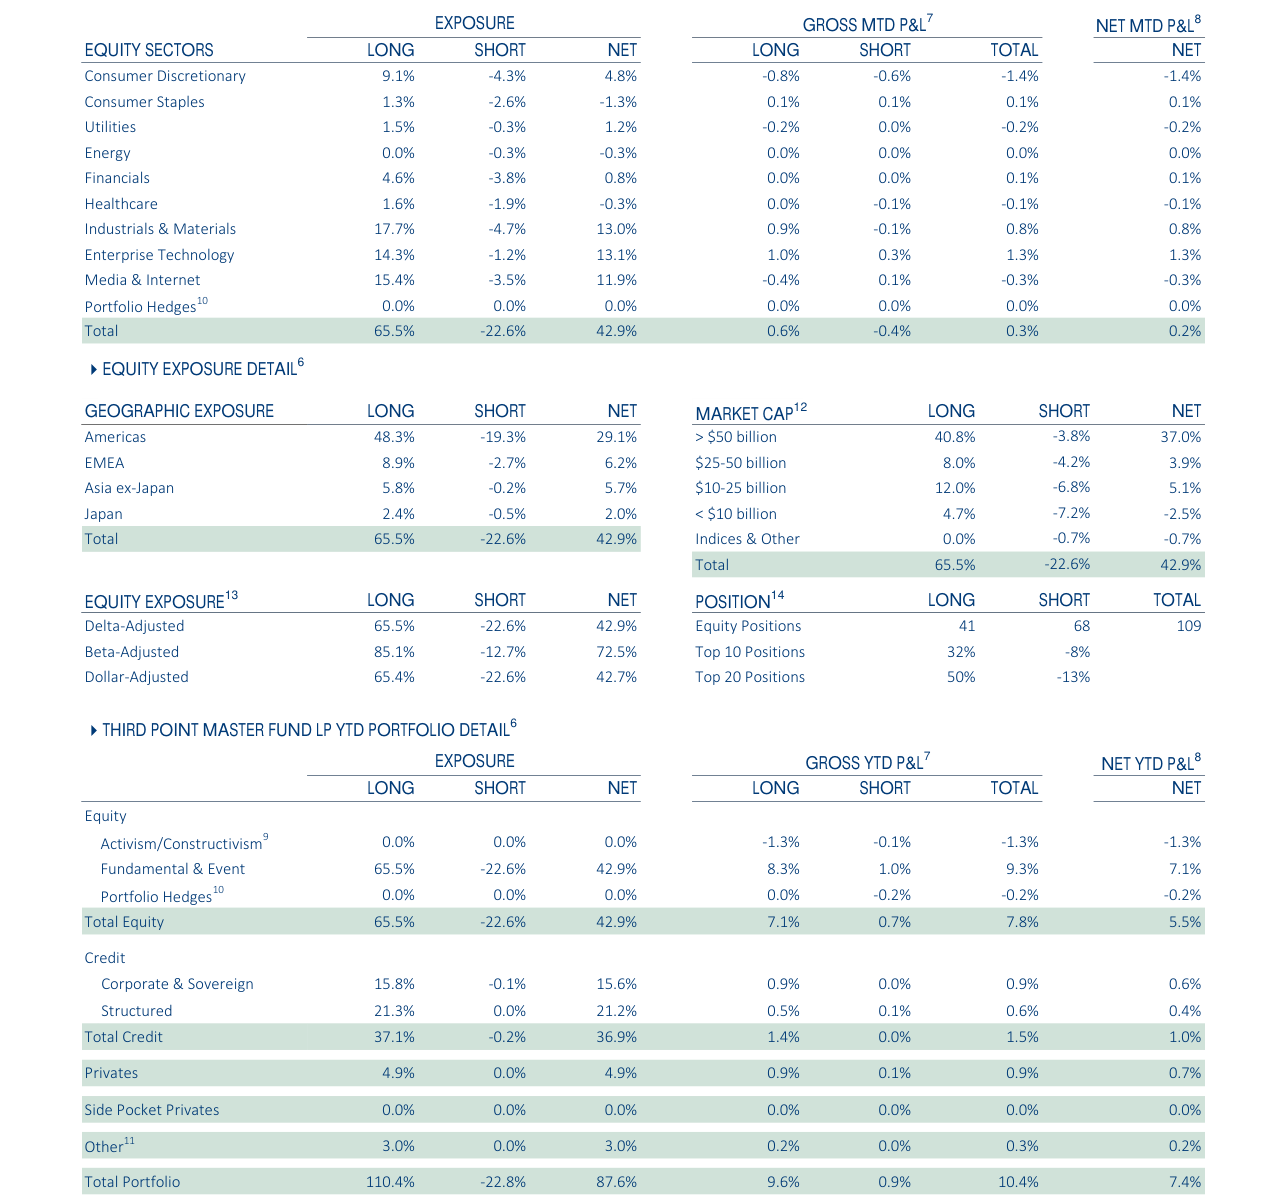
Among equity sector exposures, industrials and materials long positions are the highest at 17.7%, media/internet long positions at 15.4%, the Americas account for 29.1% of geographic exposure, and stocks with market caps above RMB 50bn represent 40.8% of long exposure
Gross P&L attribution and Net P&L attribution are not simply a "gross/net" difference; they answer two different questions:
- Gross answers: "Before deducting all costs, did the investment manager place bets in the right places?"
- Net answers: "After fees are deducted, how much did investors actually take away?"
But the issue is that the Net attribution result is not an accounting fact; it is a "reverse fee-allocation model." The fund's fee structure is incurred at the fund level, but Third Point reverse-engineers it down to the position level — which is tantamount to creating a "notional net-return position," whose accuracy depends on the reasonableness of the allocation assumptions.
| Dimension | Gross Attribution | Net Attribution (Disclosed Basis) | Net Attribution (Investor's Actual Portfolio Basis) |
|---|---|---|---|
| Fee deduction | No fees deducted | Deducts assumed top-tier fees (2% management fee + 20% incentive fee + operating expenses) | Deducts per the actual fund agreement |
| Attribution unit | Position / sub-portfolio | Position / sub-portfolio (fees allocated pro rata by average gross exposure) | Fund as a whole |
| P&L direction | Presented independently | Incentive fee accrued only on positive-P&L positions; loss-making positions exempt | Calculated using actual fee blocks |
| Objective | Demonstrates alpha capability | Demonstrates residual value "after assumed fees" | Demonstrates what investors actually received |
Core risk: The "20% incentive fee + 2% management fee" in the Net attribution is the cap under Third Point's contracts; not all investors pay this rate (e.g., seed investors and co-investments may receive discounts). Therefore, when reading Net attribution, investors should understand that this is a "simulated NAV under a maximum-cost scenario," not their own actual return.
II. The "Material Approximation" and Self-Disclaimer of the Net Attribution Methodology
One sentence in the follow-up article is particularly noteworthy:
> “The assumed operating expense ratio noted herein is applied uniformly across all underlying positions in the referenced sub-portfolio group or referenced individual investment, as applicable, given the inherent difficulty in determining and allocating the expenses on an investment or sub‑portfolio group basis. If expenses were to be allocated on an investment or sub-portfolio group basis, the net P&L would likely be different for each referenced investment or subportfolio group, as applicable.”
This passage reveals three inherent weaknesses of Net attribution:
1. The expense allocation ratio is "approximate." Management fees and operating expenses are allocated proportionally to "average gross exposure," yet actual expenses include both fixed costs (audit, legal, custody) and variable costs (trading commissions, financing costs). Using exposure as the sole weighting basis distorts the true expense burden of positions with low turnover but high financing costs.
2. Management fees are allocated at an annual rate of 2%, but actual management fees are typically charged on net asset value, not gross exposure. The gross exposure of leveraged positions can far exceed their net contribution, causing these positions to be over-allocated management fees in the attribution.
3. Acknowledging that "the results would differ if re-allocated" is itself an official disclaimer. This is equivalent to telling investors: the net P&L shown for each position is a model output, not an audit result. What can truly be used for investment decisions remains the fund-level net return.
Therefore, Net attribution is better understood as an "expense sensitivity test" rather than a "true profit-and-loss accounting at the position level."
3. Design of Incentive Allocation: Asymmetry, Lag, and the "Subsidy Effect"
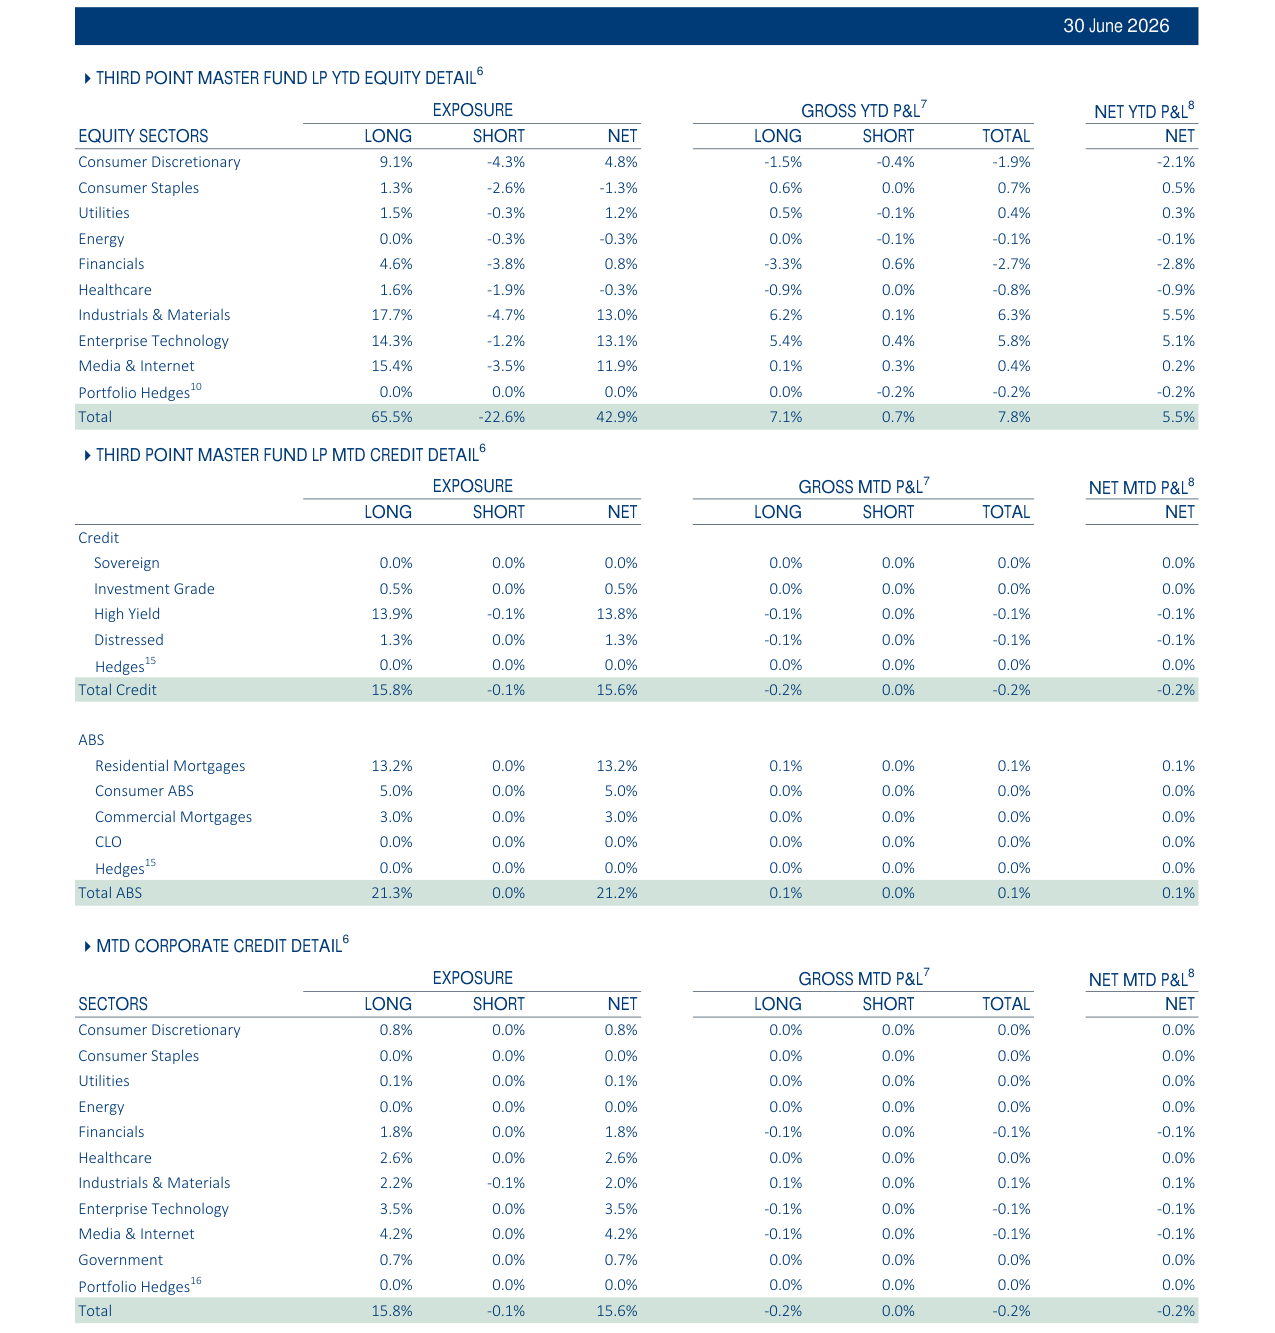
Among YTD equity-sector performance, Industrials and Materials delivered the best net P&L at 6.3%, Financials posted a net loss of -2.7%, and Media/Internet showed a YTD net P&L of 0.4%
3.1 Only Positive P&L Positions Accrue Incentive — Losing Positions Get "Free Management"
The rule for incentive allocation is:
> "The incentive allocation is accrued for each period to only those positions within the referenced sub-portfolio group, or referenced individual position, as applicable, with i) positive P&L and, ii) if during the current MTD period there is an incentive allocation."
This rule embeds an important asymmetry:
- In months when the fund overall has an incentive accrual, only positions with positive P&L for the period are charged the 20% incentive fee;
- positions with a loss for the period bear no incentive fee at all.
This creates an interesting attribution phenomenon: profitable positions carry the entire incentive burden in Net attribution, while losing positions appear at "gross" values. From a mental-accounting perspective, investors are prone to attribute losses to the manager's stock-selection mistakes and to regard gains as the "true result after fees"—yet that net figure actually reflects an amplified fee burden.
3.2 MTD Reversal Based on "Previous Month YTD Cumulative" — Lagged Cross-Period Recapture
> "In MTD periods where there is a reversal of previously accrued incentive allocation, the impact of the reversal will be based on the previous month’s YTD accrued incentive allocation."
The substance of this rule is: when a loss in the current month requires recapturing previously accrued incentive, the reference point for the recapture is not the current month's actual cumulative amount, but rather the YTD cumulative as of the previous month-end.
This means:
- If a position gains 10 million in January (with 2 million of incentive accrued) and loses 5 million in February, the reversal amount in February is based on the YTD accrued at end-January (2 million), not on a recalculated value of "net gain of 5 million for January + February."
- From an accounting perspective, this approximates a "last-in, first-out" treatment—the magnitude of the reversal is constrained by the prior month's cumulative accrual, rather than being fully recalculated according to actual net position.
Investor implications: In months when an MTD reversal occurs, Net-attributed P&L can be artificially inflated or depressed depending on the size and direction of the reversal. When analyzing monthly performance, one should review both Gross and Net, and recognize that the incentive item within Net is a "lagged, non-synchronized" adjustment.
4. The "Taxonomy" Problem of Disclosure Boundaries: Every Line Item Has Its Own Set of Exclusion Rules
The footnoting system in the follow-up report is extremely dense, but when viewed together, a striking systematic feature emerges: Third Point assigns a unique set of asset classification and exclusion rules to each metric. This makes it impossible to cross-validate the four dimensions of exposure, P&L, market cap, and beta-adjusted exposure.
| Metric | Includes | Excludes | Notes |
|---|---|---|---|
| Exposure figures | Broad market hedges, equity hedges | Interest rate swaptions, rates, FX-related investments | Insurance-linked hedges count toward exposure but exclude rates-related items |
| P&L attribution (Other) | Macro investments, unhedged FX gains/losses, cash interest, financing income/expense | P&L already classified into sub-asset classes | All P&L not explicitly attributed is swept into "Other" |
| Market capitalization | Exchange-listed equities, or synthetic equities with an underlying market value | Unlisted/non-exchange equity | Only "priceable" positions are included in market cap |
| Beta-adjusted exposure | Based on 1-year daily/weekly returns | Option positions adjusted by "current market value" rather than delta | Implied volatility changes are not reflected in the beta framework |
| Equity positions | Conventional equity positions | SPACs and SPAC-related transactions that have not announced a business combination agreement | SPACs are separately classified and excluded from equity |
| ASC levels | Includes legacy private investments | None (all-in) | Data as of March 31, 2026 |
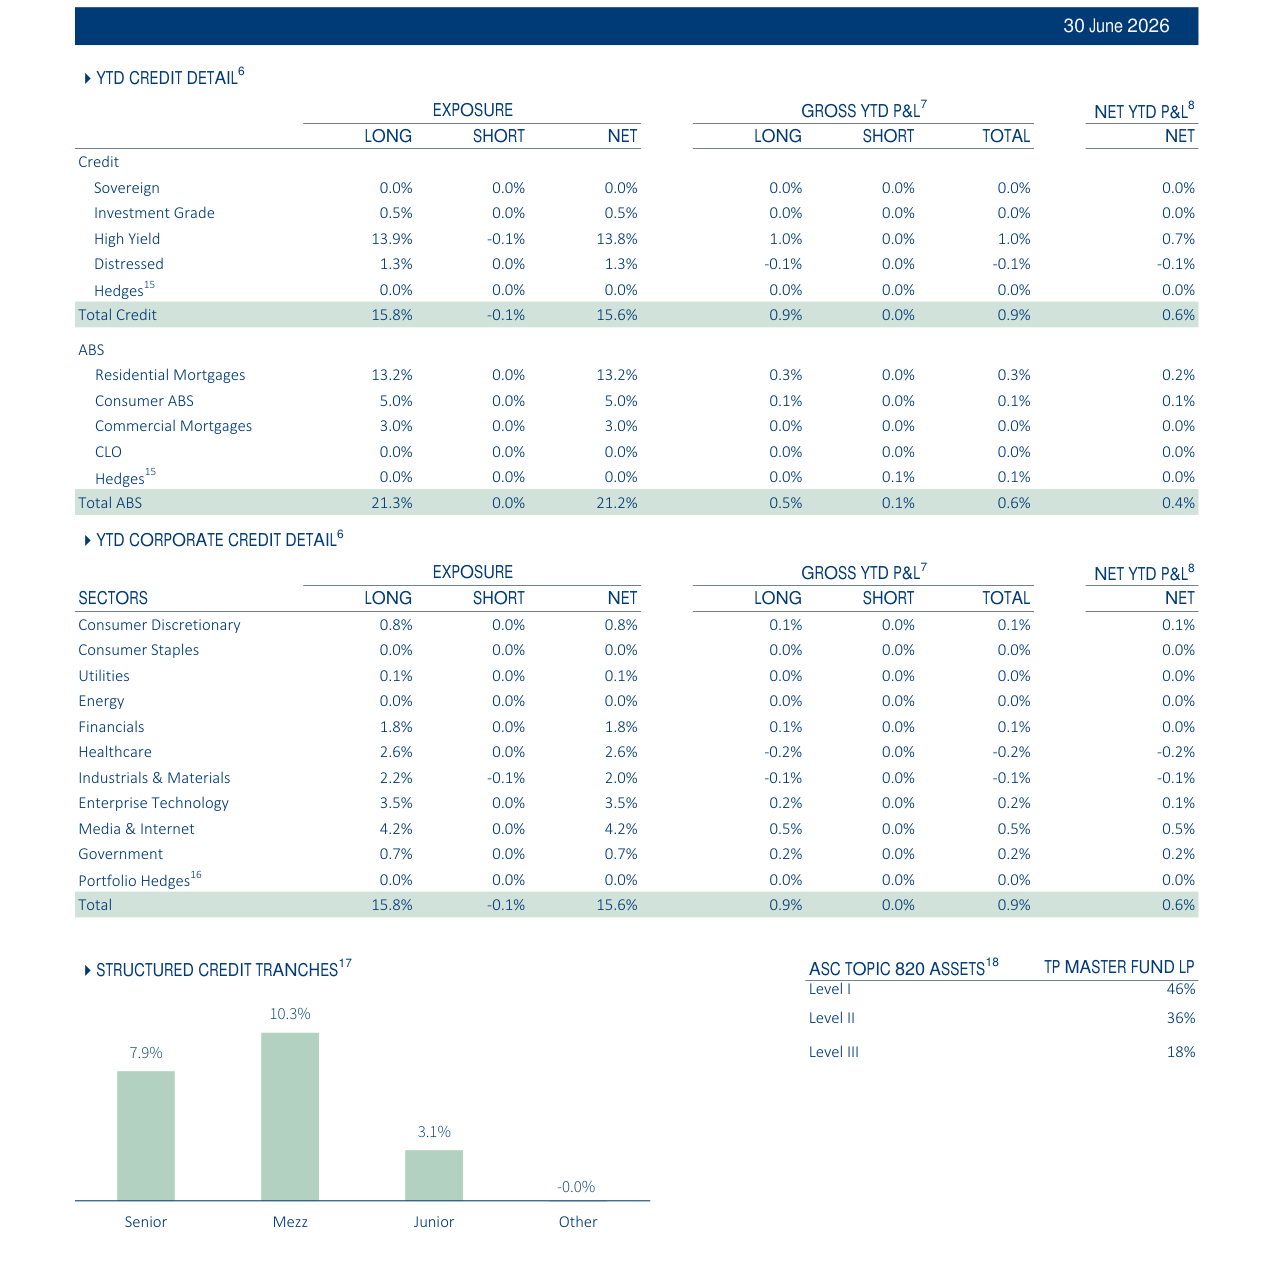
Within structured credit tranches, mezzanine (Mezz) had the highest share at 10.3%, senior 7.9%, junior 3.1%, and other tranches near 0%
4.1 "Other" Is Not a Catch-All; It Is a "Profit Buffer"
The follow-up report explicitly lists:
> "Other includes non-tranched ABS, CDS, and direct asset investments……MTD and YTD P&L of Other includes net attribution of macro investments and certain P&L components not directly attributed to individual sub-asset classes such as gains and losses attributable to unhedged currency movements relative to USD, interest income and expense on cash balances, financing income and expense, etc."
This means the P&L contained in "Other" comes from two fundamentally different sources:
1. Active decision-making (macro investments, non-tranched ABS, CDS, direct asset investments);
2. Passive residual (unhedged currency fluctuations, cash interest, financing costs).
Combining these two categories for disclosure objectively reduces investor visibility into "passive residual items"—if a month's profits mainly come from passive gains driven by interest rates, they will be masked by the macro P&L within "Other."
4.2 The Special SPAC Exemption: Protection or Obfuscation?
> "Equity positions do not include SPAC holdings and related transactions that have not yet announced a business combination agreement."
Following the 2021 SPAC boom, Third Point still holds a large number of SPACs. Stripping these assets from "equity positions" directly affects the integrity of equity exposure and market cap statistics—especially when SPACs account for a significant share of the portfolio.
From a compliance perspective, this exclusion rule may be intended to avoid classifying SPACs as "equity" and thereby triggering different SEC reporting obligations. But from an investor's perspective, SPAC positions still genuinely exist in the P&L; they are merely "handled separately."
V. The Constructivism / Activism / Post-Activism Tripartite Classification: A Non-Adversarial Behavioral Definition
The follow-up note defines:
- "Constructivism": Communication with the issuer intended to increase shareholder value, but not escalated to activism.
- "Activism": The active campaign currently underway.
Post-activism, however, is not defined but is included within the same statistical framework. This tripartite classification is uncommon in industry letters, and its existence implies the following:
5.1 Providing a "Compliance Buffer" for the 13D Process
The progression from constructivism to activism is a continuous escalation process. When Third Point holds more than 5% of a company's shares but has not yet filed a 13D, it can claim to be in the "constructivism" stage; only once a proxy contest or public letter is issued does it escalate to "activism."
This classification gives the firm a "gray-area discourse system" between the two stages, and also makes it easier to explain to investors the changes in attribution category for the same position across different months.
5.2 Brand Risk Management for the "Activist" Label
Activism carries a negative connotation for some institutional investors (especially pension funds)—it can be interpreted as short-termism. "Constructivism," by contrast, reframes the same behavior as "constructive shareholder communication," helping to maintain Third Point's long-termist positioning.
Data supplement: Between 2024 and 2026, Third Point added multiple "post-activism" positions—that is, positions still held for multiple quarters after the public campaign ended. Attribution consistency for such holdings is crucial: after activism ends, the alpha source for the position shifts from "event-driven" to "fundamental investing." If the attribution framework does not disaggregate them, investors would overestimate the persistence of event strategies.
6. The Time Gap in ASC Data: An "As of" Issue That Cannot Be Ignored
> "18 ASC levels provided are inclusive of legacy private investments and are as of 31 March, 2026."
The ASC (Asset Securitization Company/Asset Class? If referring to Alternative or Structured Credit-related assets) level breakdown is as of March 31, 2026. In a dynamic market environment, this creates a data timeliness problem:
- If this letter was published between April and May 2026, this is a normal quarterly lag;
- But if it was published in the first quarter of 2026, it means the ASC data is already one quarter stale, and investors cannot assess the latest credit exposure based on it.
More critically, "inclusive of legacy private investments" indicates that the ASC level data includes illiquid legacy private investments, whose fair values inherently suffer from valuation lags. During periods of market volatility, "mark-to-market" for these assets is likely to be replaced by "mark-to-model," further increasing attribution error.
VII. Summary of Operational Recommendations for Investors
1. Do not use Net attribution results as the sole basis for decision-making. Instead, compare them side-by-side with Gross attribution, and calculate the difference between the two as a "fee sensitivity" indicator.
2. Monitor changes in the share of the "Other" line item. If the P&L share of Other consistently exceeds a certain threshold (e.g., 15%), it suggests that the fund's true return sources are shifting from transparent strategies to non-transparent strategies; investors should proactively ask the IR team for details.
3. Conduct separate analysis for months with incentive clawbacks. In months where reversals occur, reverse out the incentive-related adjustments in Net to restore the true operational performance of that month.
4. Verify the true exposure of SPAC holders. Although equity positions exclude SPACs, the P&L of SPACs does not disappear — be sure to identify SPACs' actual contribution from the gap between "the sum of P&L across all positions" and "the sum by sub-asset class."
5. Review activism positions under the "new classification." When a position is reclassified as "post-activism," it should be removed from event-driven strategy performance to avoid overstating the long-term win rate of the activism strategy.
Third Point's disclosure on this page continues its characteristic refinement, but the fine-grained classification rules themselves are also a form of "framing choice" — they allow investors to see the "appearance" of each position under a specific classification, yet make it difficult to piece together the true whole picture. The appropriate response is: treat the footnotes as the "rules of the game," the attribution data as the "pieces," and reconstruct the game independently.