3Q24 Asia Pacific Commentary
Southeastern Asset Management is a Memphis-based deep-value firm founded in 1975 by O. Mason Hawkins to exploit the bargains left by the 1973-74 bear market. Its flagship Longleaf Partners Funds (launched 1987) invest employees' own money alongside clients'. Following Graham's discipline and its "Business, People, Price" framework, it runs concentrated books of 15-25 undervalued stocks held for the long term — famously closing funds to new investors when opportunities were scarce. CEO and Head of Research Ross Glotzbach now leads the firm, which publishes quarterly Longleaf fund commentaries and Research Perspectives notes.
In plain words
The report explains why Chinese stocks could keep rising after recent policy stimulus (the central bank launched $112 billion in market support). Valuations are low (Hang Seng PE ratio of 10x), foreign investors hold very few Chinese shares, and the government is committed. It also highlights a hidden opportunity in small Japanese companies that are improving governance and trading cheaply. Key takeaway: don't try to time the market — most gains happen in just a few days. For long-term investors, both China and Japan offer attractive entry points, but expect bumps along the way.
Southeastern (Longleaf Partners) Asia Pacific UCITS Fund The Southeastern (Longleaf Partners) Asia Pacific UCITS Fund returned 21.4% in the third quarter of 2024, outperforming the FTSE Asia Pacific Index by approximately 12 percentage points. Performance was primarily driven by strong policy stimul
Theme and Background
This chapter focuses on the performance and investment logic of the Southeastern Asia Pacific UCITS Fund in the third quarter of 2024, with a particular emphasis on the market rebound triggered by Chinese policy stimulus and its sustainability. The report notes that the People's Bank of China (PBOC) launched aggressive stimulus measures in late September (including a reserve requirement ratio (RRR) cut, an interest rate cut, a 50bps reduction in existing mortgage rates, a lowering of the minimum down payment ratio, and a total of RMB 800 billion in stock market support tools), akin to the European Central Bank's "whatever it takes" commitment in 2012, sparking a sharp rally in Chinese equities. The fund returned 21.4% for the quarter, outperforming the FTSE Asia Pacific Index by approximately 12 percentage points.
Core Thesis
The author's core investment thesis is that the rebound in Chinese equities is sustainable, not a short-term pulse. Despite the prevailing market view that China is "uninvestable," the author argues that valuations are at historically extreme lows, foreign allocation is severely underweight, and the policy pivot is clear, creating a "release after a compressed spring." Counter-intuitive judgments include: 1) After four consecutive years of negative returns for Chinese equities, such a scenario has only occurred historically during the Great Depression, suggesting this is closer to an endpoint than a starting point; 2) Even with a still-weak economic fundamental backdrop (property downturn, low consumer confidence), a policy-driven rebound can replicate the market performance seen in Europe after the "Draghi put"—weak economy but rising stocks.
Key Arguments and Data
- Policy Intensity: The PBOC launched RMB 800 billion in stock market support tools (RMB 500 billion in swap facilities + RMB 300 billion in repo financing). PBOC Governor Pan Gongsheng explicitly stated, "If the tools work well, a second and third RMB 500 billion tranche can be added." The Politburo meeting was unusually convened in September (typically held in April, July, and December), for the first time demanding a "halt to the decline in the real estate market."
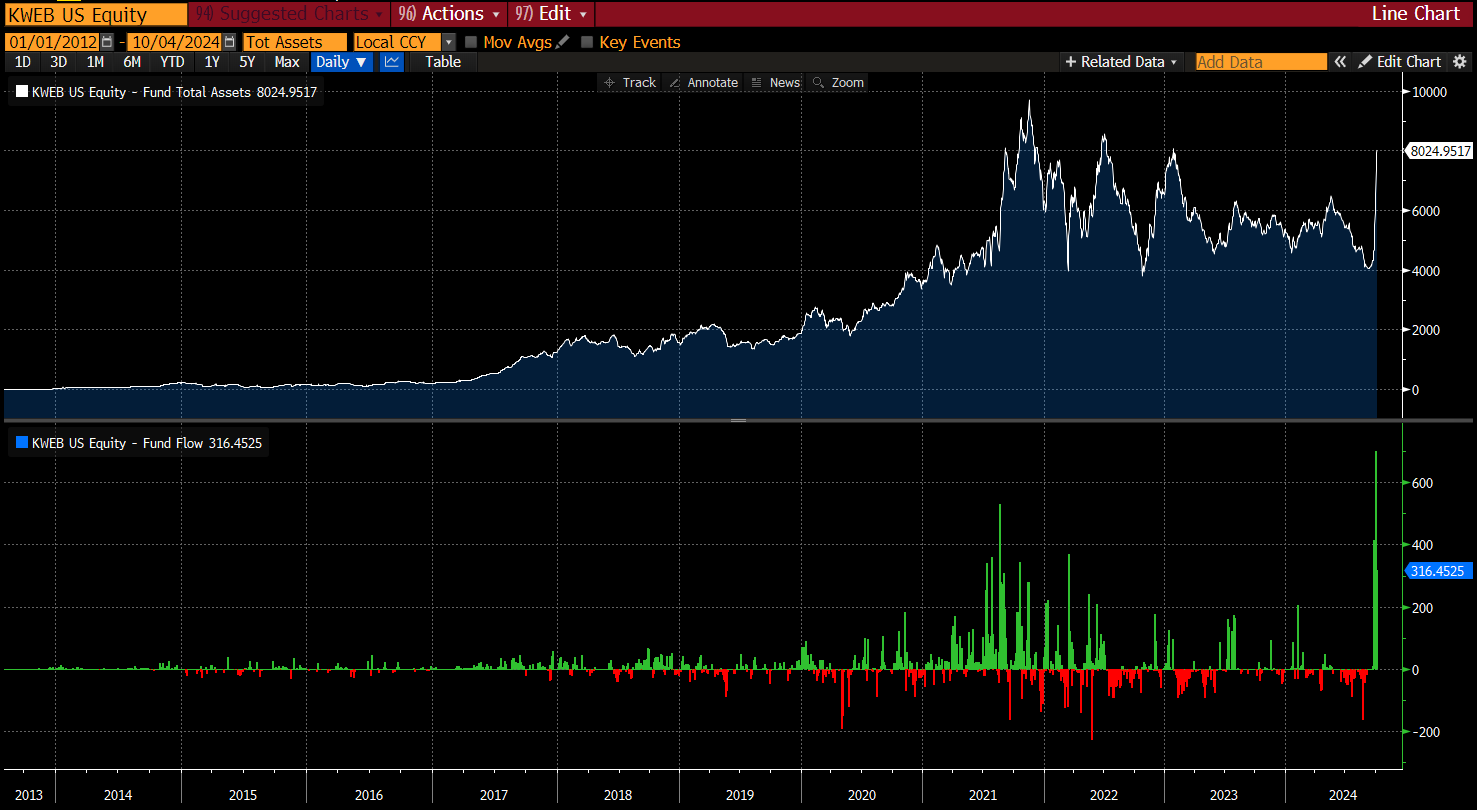
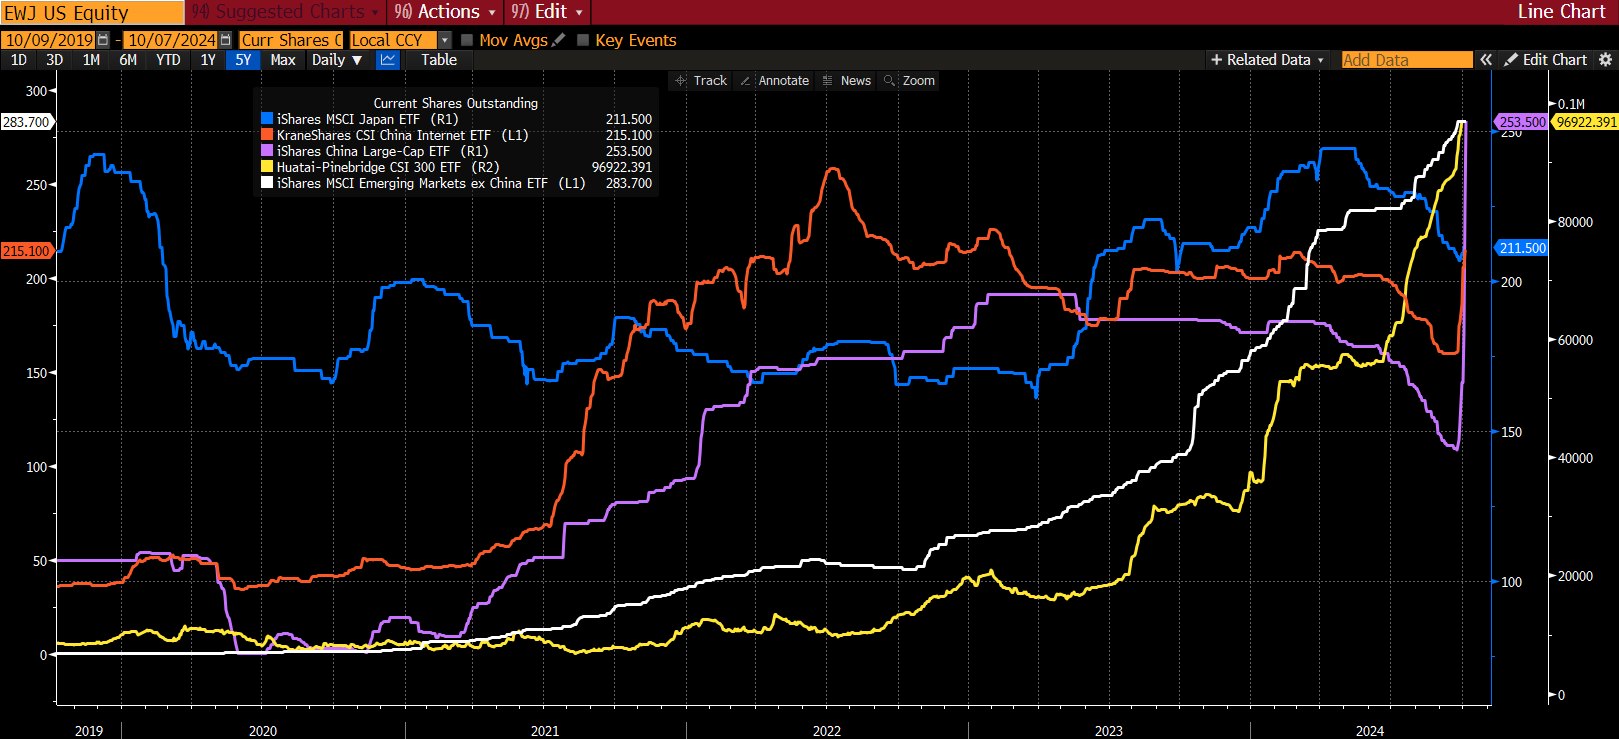
- Capital Inflows: The KraneShares CSI China Internet Fund (KWEB) saw its asset base double to $7.9 billion within a week, with a record single-day inflow of $700 million on October 1. Hong Kong stock market turnover reached $56 billion on October 2 (close to the record $65 billion on September 30), and average daily turnover during the National Day holiday (October 1-7) was $42 billion, more than three times the average daily turnover for the first eight months.
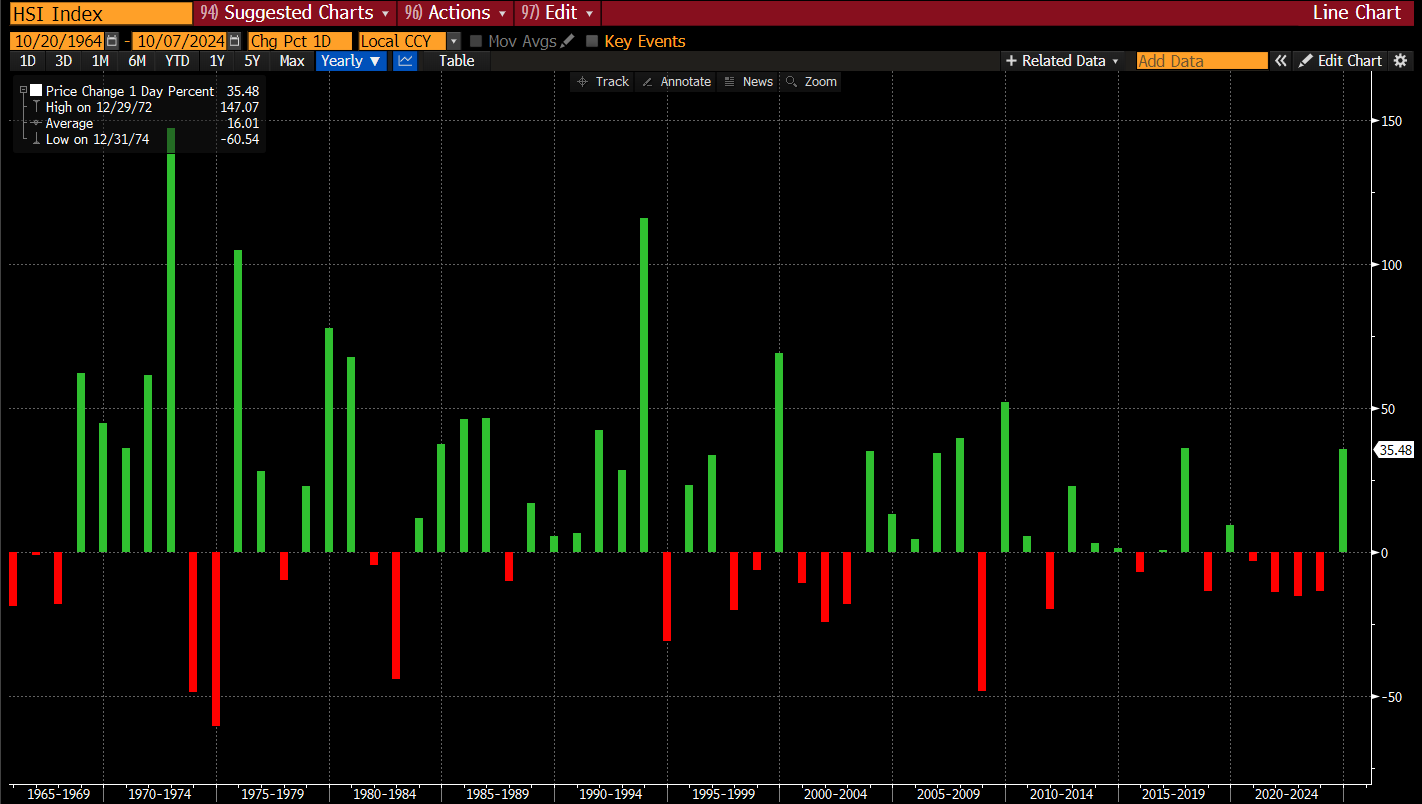
- Valuation and Historical Comparison: The Hang Seng Index rose 36% from its September low to October 7, but its forward P/E was only 10x, P/B 1.2x, and dividend yield 3.4%. Of the five major rebounds in the CSI 300 since 2005, three were stimulus-driven (2008-09, 2014-15, 2020-21), with gains of 50-100% from trough to peak. The Hang Seng Index has only experienced three consecutive years of negative returns in its history, and each time was followed by five years of positive returns.
- Foreign Positioning: Goldman Sachs data shows that as of September 30, hedge funds' net allocation to China was only 8.7%, well below the 13% peak during the reopening in early 2023 and still near the 6% trough.
| Indicator | Current Value | Historical Comparison |
|---|---|---|
| Hang Seng Index Forward P/E | 10x | Below long-term average |
| Hang Seng Index P/B | 1.2x | Near historical lows |
| Hang Seng Index Dividend Yield | 3.4% | Above historical average |
| Hedge Fund Net Allocation to China | 8.7% | Well below 13% peak |
| KWEB Asset Size (One-Week Change) | $7.9B (doubled) | Record |
| HK Stock National Day Avg. Daily Turnover | $42B | >3x 8-month average |
Companies/Assets Involved
- Jollibee (Philippine Fast Food): One of the fund's top two holdings, returned 24% for the quarter, benefiting from Philippine consumer resilience and Yen appreciation.
- SharkNinja (US Consumer Electronics): One of the fund's top two holdings, returned 45% for the quarter, benefiting from product innovation and increased North American market share.
- KraneShares CSI China Internet Fund (KWEB): A China internet ETF used as a barometer for capital inflows, with assets doubling to $7.9 billion in a week.
- Hang Seng Index (HSI): The author believes valuations are extremely low, offering significant rebound potential after four consecutive years of negative returns.
- CSI 300 Index: After three consecutive years of negative returns, historically, stimulus-driven rebounds have ranged from 50-100%.
Investment Implications
- Overweight Chinese Equities: The author is explicitly bullish on Chinese stocks, arguing that the policy pivot (a "Fed Put" version) and underweight foreign positioning constitute a dual positive, making the rebound sustainable. Investors are advised against trying to time the market, as KWEB's 26% year-to-date gain was concentrated in just six trading days; missing them would turn the annual return negative.
- Focus on HK Stocks over A-Shares: The surge in Hong Kong stock turnover during the National Day holiday (without Southbound capital participation) indicates active buying by foreign investors, not just mainland capital. Valuations in Hong Kong (10x P/E) remain lower than A-shares, offering greater room for recovery.
- Be Wary of Short-Term Pullbacks but Maintain Positions: Although the economic fundamentals remain weak (property, consumption), history shows that stimulus-driven rebounds can persist. With current foreign positioning still low (hedge fund net allocation at 8.7%), the potential for subsequent capital inflows is significant.
Structural Opportunities and Tactical Operations in the Japanese Market
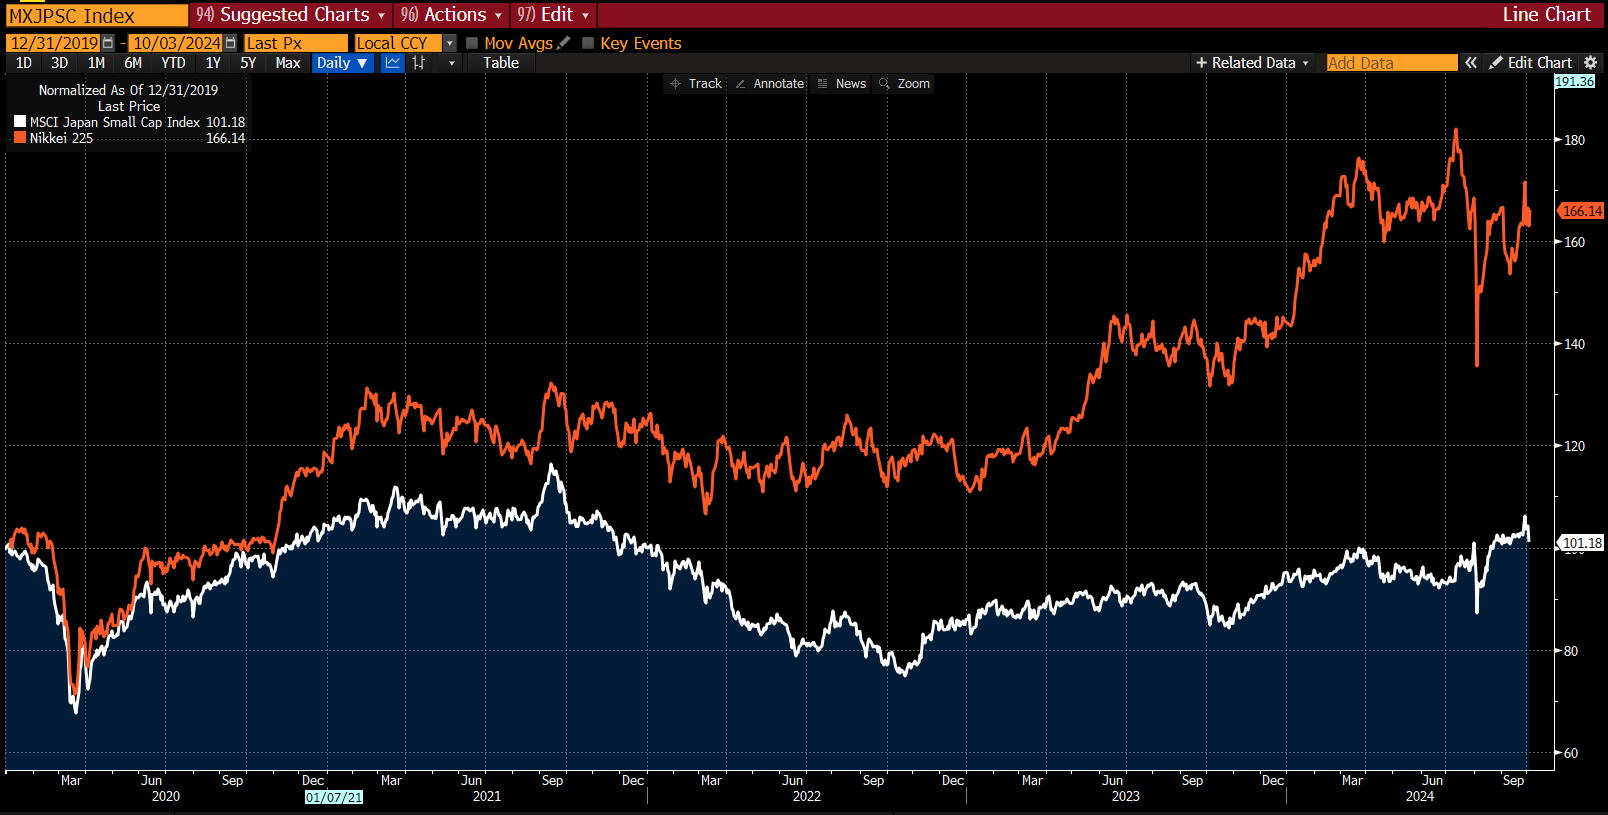
The Japanese portfolio's excess return this quarter (contributing over half of the 12% relative index outperformance) was not accidental but based on a systematic allocation to the long-term value trough in Japanese small-cap stocks. Although the fund is underweight Japan by 10 percentage points relative to the index (the index has a 34% weight in Japan), small-cap stocks contributed approximately 90% of the Japanese portfolio's return. This phenomenon stems from a structural divergence in the Japanese market since 2021: Small-cap stocks have decoupled from the Nikkei 225 Index, rooted in the fact that rising US interest rates suppressed valuations of high-growth small caps, while foreign capital primarily flowed into export-oriented large caps (Nikkei 225 constituents) benefiting from Yen depreciation, rather than domestically-oriented small caps.
Key Data Comparison: Japanese Small Caps vs. Large Caps
| Indicator | MSCI Japan Small Cap Index (USD) | Nikkei 225 Index | Explanation of Difference |
|---|---|---|---|
| Mid-2024 Level vs. 2017 | Roughly flat | Significantly up | Small caps suffered valuation contraction due to Yen depreciation and rising US rates |
| Earnings Growth (2021-2024) | Faster than large cap average | Slower | Small caps had faster earnings growth but valuations did not reflect it |
| Foreign Investor Focus | Semiconductor supply chain (China substitution demand) | Export beneficiaries | Small caps overlooked, domestic companies trade at deeper discounts |
Source: Bloomberg, MSCI, internal calculations
Policy Catalysis and Value Return
The Tokyo Stock Exchange's (TSE) "naming and shaming" policy (targeting undervalued companies) has accelerated the transition of Japanese companies towards an ROIC-oriented approach. As of September 2024, the MSCI Japan Value Index had outperformed the Growth Index by nearly 500 basis points year-to-date, with a cumulative excess return of over 10% over three years. This trend resonates with the following factors:
- Increased Independent Director Ratio: The proportion of independent directors at Japanese listed companies rose from approximately 20% in 2015 to over 50% in 2024, with governance improvements driving value revaluation for low P/B companies.
- Rising Activist Investor Activity: The number of Japanese companies targeted by activists in the first three quarters of 2024 increased by 30% year-over-year, primarily concentrated in the small-cap space.
- Yen Depreciation Dividend: Despite the Yen's weakness, domestically-oriented small caps (e.g., entertainment, healthcare, IT services) have a high proportion of local revenue, limiting the exchange rate impact. Instead, their valuation discounts provide a margin of safety.
Tactical Addition During the August 5 Global Mini-Crash
On August 5, the Nikkei 225 plunged 12.4% in a single day (the second-largest drop in history), triggered by:
1. Bank of Japan Rate Hike: The second rate hike on July 31 (first in March), strengthening the Yen.
2. Fed Rate Cut Expectations: Weakening the US Dollar, leading to massive unwinding of Yen carry trades (borrowing low-interest Yen to invest in higher-yielding assets).
3. Leverage Amplification: Leverage used in carry trades exacerbated the sell-off.
We used this correction to significantly increase holdings in Japanese domestically-oriented, high-growth small caps, with the core logic being:
- Beneficiary of Yen Appreciation: Domestically-oriented companies generate revenue in Yen and benefit from lower costs for imported raw materials (e.g., energy, food).
- Valuation Overshoot: Small caps fell more during the crash (MSCI Japan Small Cap Index fell 14.5% in a single day), but fundamentals did not deteriorate.
- Liquidity Mismatch: Foreign investors were forced to sell small caps to meet margin calls on large caps, creating a buying window.
New Portfolio: Focus on "Owner-Operator" Model
Five new Japanese small-cap stocks were added this quarter (all owner-managed except Hikari Tsushin), with core characteristics:
| Company | Industry | Key Advantage | Management Ownership | Quarterly Buyback |
|---|---|---|---|---|
| GENDA | Entertainment (Game Centers, Karaoke) | Low-cost M&A integration (cost of capital 1.1-1.3%), acquiring businesses from owners without successors in an aging society | ~26% | Yes |
| Medley | Medical HR Platform | Network effects (34% penetration), winner-takes-most market | Founder-controlled | No |
| Appier Group | AI Marketing Technology | Leading AI application in Japan, cross-border business growth | Management-owned | Yes |
| Hikari Tsushin | Holding Company (Small-cap Investments) | Similar to Berkshire Hathaway model, focused on Japanese small caps | Founder-led | Yes |
| Another Undisclosed | Domestic Industry Consolidator | Consolidating fragmented industries, acquiring at low multiples | Owner-managed | Yes |
In-depth Analysis of GENDA:
- Acquisition of Sega Entertainment: Acquired at zero cost in December 2020 (Sega Sammy divested due to pandemic losses), with revenue of JPY 20 billion. Post-acquisition, operating margins doubled to pre-pandemic levels.
- M&A Strategy: The vast majority of 33 transactions were direct negotiations (not auctions), with acquisition multiples significantly lower than overseas M&A (typically <5x EBITDA vs. 8-12x overseas).
- Management Background: CEO Kataoka was formerly President of Aeon Fantasy (stock price rose 7x), and CFO Watanabe is a former Goldman Sachs Japan M&A professional. The board includes industry veterans and a former Goldman Sachs executive.
Exits and Reallocation
To fund the Japanese investments, we liquidated:
- CK Asset (Hong Kong Listed): Weak Hong Kong property market, limited room for valuation recovery.
- Melco International (Macau Gaming): Slower-than-expected recovery in Chinese outbound travel, increased competition.
Simultaneously, we exited via Itochu's privatization offer for Descente (at a premium) and reallocated the capital to the aforementioned Japanese small caps. This operation reflects opportunity cost management: reallocating capital between a low-valuation market (Japanese small caps) and higher-valuation markets (Hong Kong property, Macau gaming).
Risks and Outlook
Despite the strong performance of Japanese small caps, attention must be paid to:
- Yen Exchange Rate Volatility: If the Yen continues to appreciate, export-oriented large caps will come under pressure, but domestically-oriented small caps will benefit.
- Carry Trade Unwinding Risk: Further BOJ rate hikes could trigger market volatility again, but small-cap valuations have partially priced in this risk.
- Liquidity Constraints: Small caps have lower trading volumes; large orders could impact prices, requiring execution in tranches.
Core Conclusion: The structural opportunity in Japanese small caps (low valuations, high earnings growth, governance improvements) has not yet been fully priced in by foreign capital. Through our "owner-operator" screening and contrarian accumulation strategy, we aim to capture excess returns while controlling risk.
Added Analysis: Regulatory Impact and Portfolio Dynamics
1. Quantifying the Regulatory Impact on JobMedley's Business Model
A draft regulation from Japan's Ministry of Health, Labour and Welfare would prohibit HR companies from offering monetary incentives to job seekers, directly challenging Medley's verification mechanism. Medley currently pays successful job seekers an average incentive of JPY 10,000 (approximately 0.1-0.5% of their annual income) to confirm job placement. If the ban is implemented, alternative verification methods (e.g., third-party audits or digital tracking) are expected to increase compliance costs by 5%. Medley plans to raise prices by 30% to cover costs, but even after the increase, its fee rate would still be only 2.6-16.9%, far below competitors' 20-35%. Comparative data is as follows:
| Indicator | Medley Current | Medley After 30% Price Increase | Competitors (Recruitment Agencies) |
|---|---|---|---|
| Fee Rate (% of Annual Salary) | 2-13% | 2.6-16.9% | 20-35% |
| Compliance Cost Increase | - | 5% | No direct regulatory impact |
| Market Share (Japan Medical HR) | ~15% | Expected to maintain | Fragmented (Top 5 <40% combined) |
Key Insight: Even with a 30% price increase, Medley maintains its lowest-cost advantage. If it only raises prices by 5% (covering compliance costs), profit increments would come from efficiency gains. Historical data shows Medley reduced its operating expense ratio from 18% to 12% between 2019-2023 through scale effects, providing ample pricing power.
2. Hikari Tsushin's Valuation Discount and Buyback Signal
Hikari's investment portfolio is valued at JPY 1.1 trillion, representing 77% of its total market cap, implying its operating business (M&A and insurance) trades at only 0.3x P/B. Management's target share price is JPY 50,000-60,000, implying 78-114% upside from the current price (~JPY 28,000). The buyback plan (JPY 10 billion, 1.13% of shares outstanding) is the 7th such operation since 2018, with historical buybacks followed by an average 23% share price appreciation over the next 12 months. Comparing its investment returns and operating growth:
| Indicator | Hikari Tsushin | Japanese Market Average |
|---|---|---|
| Portfolio IRR (7-Year) | 18% | 8-10% (TOPIX) |
| Operating Profit CAGR (10-Year) | 12% | 3-5% (Japanese Small/Mid Caps) |
| Price-to-Book Ratio | 0.8x | 1.2x (TOPIX) |
Risk Note: 70% of investments are concentrated in Japanese small caps, posing higher liquidity risk; however, management has achieved 15% annualized EPS growth through buybacks and M&A synergies (e.g., the 2023 acquisition of an insurtech company).
3. Appier's S-Curve Inflection Point and Free Cash Flow Turnaround
Appier is in the early stages of its North American expansion (revenue share <10%), but customer acquisition costs (CAC) have fallen to 60% of their level 12 months ago, benefiting from 12 years of proprietary data accumulation. Its AI model gains an advantage under privacy regulations (e.g., GDPR, CCPA): customer retention rates improved to 92% in H1 2024, compared to an industry average of 75-80%. Management announced a JPY 1 billion buyback (0.8% of shares outstanding), based on expectations of improved profitability in H2. Key financial indicators:
| Indicator | 2023 | 2024 (Estimate) | Industry Comparison (AI Marketing Companies) |
|---|---|---|---|
| Free Cash Flow (JPY Millions) | -150 | +200 | Median: -50 (2023) |
| Gross Margin | 68% | 72% | 55-65% |
| North America Revenue Growth (YoY) | +40% | +60% | +25% (Industry Average) |
Catalyst: If North American revenue reaches 20% of total by 2025, it could push overall gross margins above 75% and free cash flow margin from 5% to 12%.
4. Industry Concentration Analysis of Portfolio Contributions
Among the top five contributors in Q3, consumer (SharkNinja, Jollibee) and technology (Appier) each accounted for two positions, demonstrating the portfolio's cross-cycle allocation. SharkNinja's inventory cycle (8.6 weeks) is below its historical average (10-12 weeks), with restocking potential of over 20%. Alibaba's contribution was primarily sentiment-driven (China policy stimulus), but operationally, its market share remained stable at 35-38% (in line with industry growth). Comparing quarterly and annual performance:
| Holding | 3Q24 Contribution (%) | 2024 YTD Contribution (%) | Driver |
|---|---|---|---|
| SharkNinja | +2.86 | +5.29 | North American restocking + International expansion |
| Alibaba | +2.20 | - | Policy sentiment + HK dual listing |
| GENDA | +2.14 | - | Japanese entertainment consumption recovery |
| Appier | +1.57 | - | AI marketing demand + Buyback |
Risk Hedge: Among the bottom contributors, Macau gaming stocks (Melco, Sands China) were dragged down by weak Chinese consumption, but valuations have fallen to historical lows (EV/EBITDA 6-8x), providing a margin of safety.
Added Arguments and Data Analysis
Alibaba: Southbound Capital-Driven Incremental Demand and Shareholder Returns
- Accelerated Southbound Inflow: Since being included in the Stock Connect in September, mainland investors have purchased over $5 billion worth of Alibaba's Hong Kong shares in just one month, raising their stake to 2.67%. Following Tencent's (00700.HK) Southbound shareholding path (currently ~8-10%), Alibaba's Southbound stake could rise to 10% over the next 12-18 months, corresponding to approximately $20 billion in incremental capital inflow.
- Shareholder Yield Comparison: Alibaba spent approximately $22 billion on buybacks and dividends over the past 12 months, representing a total yield of 8%. This level significantly exceeds Tencent (~3.5% over the same period) and Meituan (~1.2%), placing it among the leaders in the internet sector. If the Southbound stake rises to 10%, it is expected to drive an additional ~$2 billion in annualized buyback demand.
| Company | Southbound Stake (Current) | Southbound Stake (Potential) | Total Shareholder Yield (TTM) |
|---|---|---|---|
| Alibaba | 2.67% | 10% | 8.0% |
| Tencent | 8.5% | 10% | 3.5% |
| Meituan | 4.2% | 6% | 1.2% |
GENDA: M&A-Driven Growth and North American Expansion
- Synergies from NEN Acquisition: GENDA's acquisition of National Entertainment Network (NEN) added approximately 8,000 mini-entertainment locations, primarily embedded in retail channels like Walmart. Its US claw machine business, Kiddleton, generates three times the revenue per location compared to NEN, indicating significant operational improvement potential at NEN sites. Assuming Kiddleton's operational efficiency is gradually replicated across NEN locations, GENDA's US business revenue could double within 12-18 months.
- Upward Financial Guidance: GENDA raised its FY1/25 revenue guidance from JPY 100 billion to JPY 110 billion (+10%), driven by better-than-expected H1 performance. While its Q2 EBITDA margin of 13.3% was down 30bps year-over-year, net profit margin (excluding goodwill amortization) improved 40bps year-over-year to 3.8%, indicating improved profitability post-M&A integration.
Jollibee: Valuation Revaluation Driven by ROIC Target
- ROIC Target and Global Benchmarking: Jollibee management set a 2028 ROIC target of 20% for the first time, aligning with global leading QSR companies like McDonald's (~20%) and Starbucks (~18%). With Jollibee's current ROIC at approximately 12%, achieving this target could see its P/E ratio (currently ~22x) converge towards global peers (average 25-30x), implying a 15-35% valuation uplift.
- Capital Allocation Shift: Management raised its full-year operating profit growth target from 10-15% to 18-20%, while cutting capital expenditure budget by 20% to PHP 16-18 billion. This "profit-first" strategy aligns with the ROIC target and is expected to push the free cash flow yield from the current 4.5% to over 6%.
Appier: AI-Driven S-Curve Inflection Point
- Operating Leverage Release: Appier's Q2 revenue grew 32% year-over-year, with strong growth in Northeast Asia (+35%) and the Americas/Europe (+65%). Operating margin expanded from 1.3% to 4.3%, indicating that revenue growth is translating into excess operating leverage. If full-year revenue growth remains above 30%, the operating margin could break through 8% in FY2025.
- Management Confidence Signal: Appier management believes the current stock price is undervalued and has initiated a share buyback program. Referencing its historical valuation range (EV/Revenue 3-5x), the current ~2.5x valuation is at a historical low, and the buyback could trigger a valuation recovery.
Key Risks and Uncertainties
- Sustainability of Alibaba's Southbound Inflows: If Southbound capital inflows slow (e.g., due to macroeconomic or policy impacts), support for Alibaba's stock price could weaken. Furthermore, its 8% total shareholder yield depends on sustained buybacks; if cash flow deteriorates, the yield could decline.
- GENDA Integration Risk: Some of NEN's 8,000 locations are in low-traffic areas, and Kiddleton's efficient operating model may not be fully replicable. If integration progresses slower than expected, GENDA's US business growth could decelerate.
- Jollibee's Smashburger Turnaround Uncertainty: Smashburger's new CEO Denise Nelsen's menu and brand revitalization plan still requires time to prove itself. If Q3 SSSG fails to turn positive, market confidence could be further shaken.
- Appier's Intensifying Competition: The AI marketing space is highly competitive, with giants like Salesforce and Adobe increasing their investments. If Appier cannot maintain its technological lead, its revenue growth could slow to below 20%, limiting the release of operating leverage.
Summary
The portfolio adjustments this quarter reflect a positive positioning towards Southbound capital inflows (Alibaba), M&A integration (GENDA), a profit-oriented transformation (Jollibee), and AI operating leverage (Appier). Key observation points include: whether Alibaba's Southbound stake can break through 5%, the pace of per-store revenue improvement at GENDA's NEN locations, Jollibee's ROIC improvement trajectory, and whether Appier's operating margin can continue to expand.