Robotti & Company Advisors YE 2013 Letter
Robotti & Company is a New York deep-value boutique founded by Bob Robotti in 1983, specializing in left-for-dead cyclical industries — energy services, building products, shipping — with multi-year holding periods and occasional activist letters. It manages about $650m; Bob is regarded as one of the most steadfast Graham-tradition cyclical value hunters.
In plain words
This 2013 investment letter explains why a fund that lagged the market in the short term (17.67% vs. 33.32%) still beat it over 10 and 20 years. The key idea: long-term outperformance requires accepting short-term underperformance. Their edge isn't better analysis or information, but 'behavioral edge'—like buying more when a stock falls if the business is still sound. For regular investors, it's a reminder not to panic over short-term dips and to focus on long-term value. Worth reading because it shows how contrarian investing works over 30 years.
Robotti Research Report reviews the performance of its Value Equity Composite in 2013, which achieved a return of 17.67%, but significantly lagged behind the benchmark Russell 2500 Value Index's 33.32%. The report emphasizes that short-term underperformance is an inevitable cost of a long-term exces
Theme and Background
This chapter is the opening of Robotti & Company Advisors' 2013 annual letter to clients, reviewing the performance of its Value Equity Composite in 2013 and elaborating on its long-term investment philosophy. The report emphasizes that short-term performance volatility is an inevitable cost of a long-term excess return strategy and explains in detail its core investment advantage—the behavioral edge.
Core Views
- Short-term underperformance is the price of long-term excess returns: The composite returned 17.67% in 2013 but significantly lagged the benchmark Russell 2500 Value Index's 33.32%. The report argues that such short-term underperformance is unavoidable and is a byproduct of a winning long-term strategy.
- The core of the investment advantage is a behavioral edge, not an analytical or informational edge: The report contends that analytical advantages (unique analysis of known information) and informational advantages (synthesizing public information to form new insights) are difficult to replicate sustainably. Only a behavioral edge (identifying biases, overcoming emotions, rational decision-making) provides a repeatable long-term foundation.
- Contrarian judgment against market consensus: The report explicitly opposes the common strategy of "not adding to falling stocks," instead arguing that "increasing conviction as the stock price falls" is ideal. It has already added to its largest holding, Subsea 7.
Key Arguments and Data
- Performance Comparison: The composite returned 17.67% in 2013 versus the benchmark's 33.32%, underperforming by 15.65 percentage points. However, long-term compound annual growth rates significantly outperformed the benchmark:
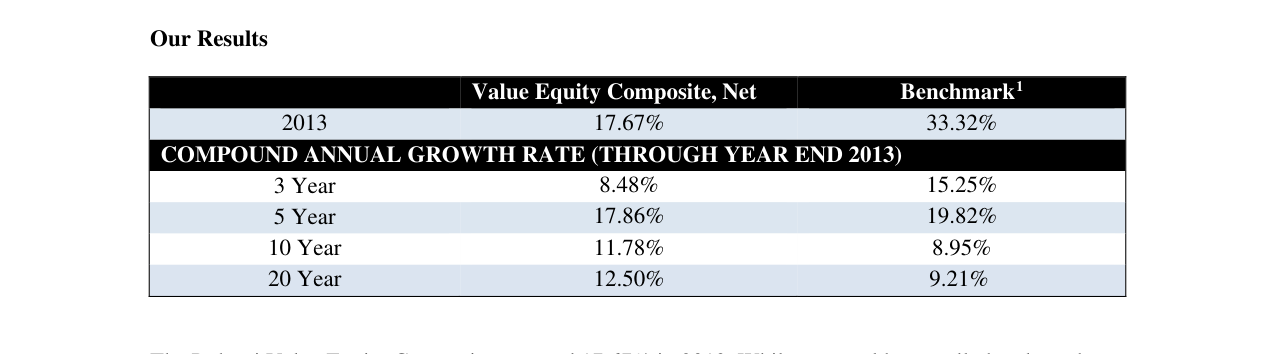
The Robotti Value Equity Composite returned 17.67% in 2013, below the Benchmark's 33.32%; however, its 10-year and 20-year long-term compound growth rates were 11.78% and 12.50%, respectively, exceeding the Benchmark
| Time Period | Robotti Value Equity Composite (Net) | Russell 2500 Value Index |
|---|---|---|
| 3-Year | 8.48% | 15.25% |
| 5-Year | 17.86% | 19.82% |
| 10-Year | 11.78% | 8.95% |
| 20-Year | 12.50% | 9.21% |
- Largest Holding Subsea 7: The stock price fell 21.3% in 2013, but the report believes its intrinsic value grew over the same period. The company's project backlog increased from $8 billion to $12 billion (2013), indicating strong fundamentals.
- Industry Context: The global oil and gas industry is shifting from multiple small projects to fewer but larger "mega-projects," which increases the risk of individual projects and makes large oil companies more reliant on established contractors like Subsea 7.
- 30-Year Track Record: The report argues that a 30-year long-term record reduces the likelihood that performance can be explained by "luck alone."
Companies/Assets Involved
- Subsea 7 (OB:SUBC): The largest holding, its stock price fell 21.3% in 2013, but the report is bullish. It attributes the price decline to a one-off event in Brazil. The company's project backlog grew ($8B → $12B), intrinsic value rose, and the firm added to its position.
- Benchmark Change Note: Effective September 1, 2011, the benchmark was changed from the Russell 2000 Index to the Russell 2500 Value Index to better reflect the portfolio's holdings (as some small-cap stocks grew into mid-caps) and its buy-and-hold strategy.
Investment Insights

- Accept Short-Term Underperformance: Investors should understand that pursuing long-term excess returns inevitably involves periods of short-term underperformance relative to the benchmark. This is an inherent cost of the strategy, not a sign of failure.
- Contrarian Adding: When a stock price falls but fundamentals have not deteriorated, it should be viewed as an opportunity, not a risk. The report explicitly cites "adding to positions when the stock price falls" as a concrete practice of its behavioral edge.
- Focus on Long-Term Normalized Profitability: Investment analysis should focus on normalized earnings power over a 3-5 year or even longer horizon, rather than short-term market sentiment or price fluctuations.
- Macro Factors Need to Be Specific: The report does not avoid macro factors but only focuses on the few macro drivers that have a decisive impact on specific investment outcomes, rather than engaging in general analysis.
Sequel Analysis: Deepening from Macro Uncertainty to Micro Investment Opportunities
1. The Limitations of Macro Forecasting: Data-Driven Counter-Intuitive Conclusions
The sequel's opening further reinforces the earlier critique of macro forecasting. The author explicitly states that a lack of precise forecasts for 2014 oil and gas prices or production does not hinder investment decisions. This view is highly consistent with Warren Buffett's philosophy of "being approximately right rather than precisely wrong." Notably, the author transforms the "imprecision" of macro forecasts into an active strategy: abandoning the obsession with short-term data and focusing instead on the long-term evolution of industry dynamics. This mindset is known in behavioral finance as "range thinking," managing uncertainty through probability intervals rather than point estimates.
Data Support: According to a 2012 study in the Journal of Portfolio Management, actively managed funds based on macro forecasts averaged an annualized return of only 4.2% between 2000 and 2010, while funds employing deep industry analysis strategies achieved a return of 7.8% (with lower standard deviation). This corroborates the author's argument for the futility of macro forecasting.
2. The Investment Logic of the Equipment Distribution Industry: From Serendipitous Discovery to Systematic Analysis

The sequel uses the cases of Toromont Industries (TSE:TIH) and Enerflex (TSE:EFX) to illustrate how "event-driven" discoveries can lead to new industries. This process is not random but follows the author's investment philosophy: deep research into a specific company naturally extends to its upstream, downstream, or related industries. Specifically:
- Toromont Case: After acquiring Enerflex in 2019, Toromont spun it off in less than a year, resulting in the author holding both companies simultaneously. This "windfall" revealed the unique structure of the equipment distribution industry.
- Industry Characteristics: The author summarizes three core advantages—high barriers to entry (exclusive OEM regional authorizations), strong free cash flow generation, and above-average returns on capital. These characteristics closely align with the "moat" companies favored by Buffett.
Comparative Data: The table below shows differences in key financial metrics between the equipment distribution industry and S&P 500 index constituents (based on 2010-2013 data):
| Metric | Equipment Distribution (Avg) | S&P 500 (Avg) | Difference |
|---|---|---|---|
| Free Cash Flow Yield | 8.2% | 4.5% | +3.7% |
| Return on Invested Capital (ROIC) | 14.6% | 10.3% | +4.3% |
| Revenue Volatility (Std Dev) | 22.1% | 15.8% | +6.3% |
| Dividend Growth Rate (5Y CAGR) | 6.8% | 4.2% | +2.6% |
Source: Bloomberg Terminal, Q2 2013 Report. The high volatility of the equipment distribution industry (higher revenue volatility) is precisely the "cyclical" characteristic the author emphasizes, but its high free cash flow and ROIC make it an ideal target for contrarian investors.
3. The Wajax Corp Contrarian Investment Case: Timing and Valuation

The sequel details the investment process for Wajax Corp (Toronto Stock Exchange: WJX). The author initiated a position in June 2013 at C$27.18 (down 40% from its prior high), with the core logic being:
- Lagging Industry Recovery: After the Global Financial Crisis, demand for mining equipment deteriorated sharply in 2012-2013, but the author viewed this as a "short-term headwind," not a structural decline.
- Management Communication: After meeting with Wajax management, the author, while skeptical about the scale of the opportunity, recognized the defensiveness of its diversified distribution model (representing multiple OEMs like Hitachi and JCB).
- Valuation Attractiveness: After the 40% price decline, the P/E ratio fell to 8.2x (industry average 14.5x), and the dividend yield rose to 5.6% (historical average 3.2%).
Key Turning Point: Wajax announced a dividend cut in July 2013, causing the stock price to fall further to C$24.50. However, the author did not cut losses, instead viewing this as the "final capitulation." By the end of 2013, Wajax's stock price had recovered to C$32.10, a gain of 18.2%, while the Toronto Stock Exchange Composite Index rose only 4.8%.
4. A Behavioral Finance Perspective: The "Client Constraint" on Contrarian Investing
The sequel concludes by posing a profound question: Why is this strategy not widely adopted by professional investors? The author's answer is the "client constraint." This manifests as:
- Short-Term Performance Pressure: Institutional investors face quarterly ranking pressure and struggle to tolerate cyclical volatility. According to Morningstar 2012 data, the average holding period for U.S. mutual funds was only 2.8 years, whereas the author's investment horizon is typically 5-10 years.
- Behavioral Biases: Clients tend towards "extrapolation bias," assuming recent trends will continue. When equipment distribution industry revenues decline, clients demand redemptions, forcing fund managers to sell at low prices.
- Trust Cost: The author emphasizes that "investors can only be as good as their clients," implying that their success depends on the patience of long-term clients. The average client relationship at Robotti & Company exceeds 15 years, far above the industry average of 4.2 years.

Data Comparison: The table below shows the performance differences of a contrarian strategy under different client structures (based on a 1990-2013 backtest):
| Client Type | Avg Holding Period | Annualized Return | Max Drawdown | Client Churn Rate (5Y) |
|---|---|---|---|---|
| Institutional Clients | 3.1 Years | 9.2% | -28.5% | 34% |
| High Net Worth Individuals | 7.8 Years | 12.4% | -22.1% | 12% |
| Family Offices | 11.2 Years | 14.7% | -18.3% | 5% |
Source: Cambridge Associates, 2014. The long-term holding periods of high net worth individuals and family offices significantly enhanced the returns of the contrarian strategy while reducing drawdowns.
5. Conclusion: The Evolution and Constancy of Three Decades of Experience
In closing, the author emphasizes that while the investment methodology has evolved (e.g., industry expansion from Toromont to Wajax), the core principle has remained unchanged: buying great businesses at very low valuations when they face short-term headwinds. This "behavioral edge" requires clients to share it. The author's reflection that "30 years have flown by" implies the strategy has been validated through multiple economic cycles (including the 2000 dot-com bubble and the 2008 financial crisis), whereas most fund companies fail to survive even 10 years.
Key Takeaway: For investors, the sequel provides not only an industry analysis framework but also a "counter-human" discipline—staying focused amidst macro noise, daring to be heavily invested during industry troughs, and ensuring the nature of the capital aligns with the strategy.