Robotti & Company Advisors Q3 2013 Letter
Robotti & Company is a New York deep-value boutique founded by Bob Robotti in 1983, specializing in left-for-dead cyclical industries — energy services, building products, shipping — with multi-year holding periods and occasional activist letters. It manages about $650m; Bob is regarded as one of the most steadfast Graham-tradition cyclical value hunters.
In plain words
This is a letter from Robotti & Company to clients, explaining how they make money by buying undervalued stocks. They ignore market noise (like Fed policy or government shutdowns) and focus on companies trading below their true worth. Example: Skechers stock fell from $45 to $11 (below its book value of $17.50), they bought under $15, and it later rose to $31. They admit short-term losses happen, but over 20 years their fund returned 13% annually vs. the market's 8.6%. For regular investors, the lesson is to be patient and not panic over headlines.
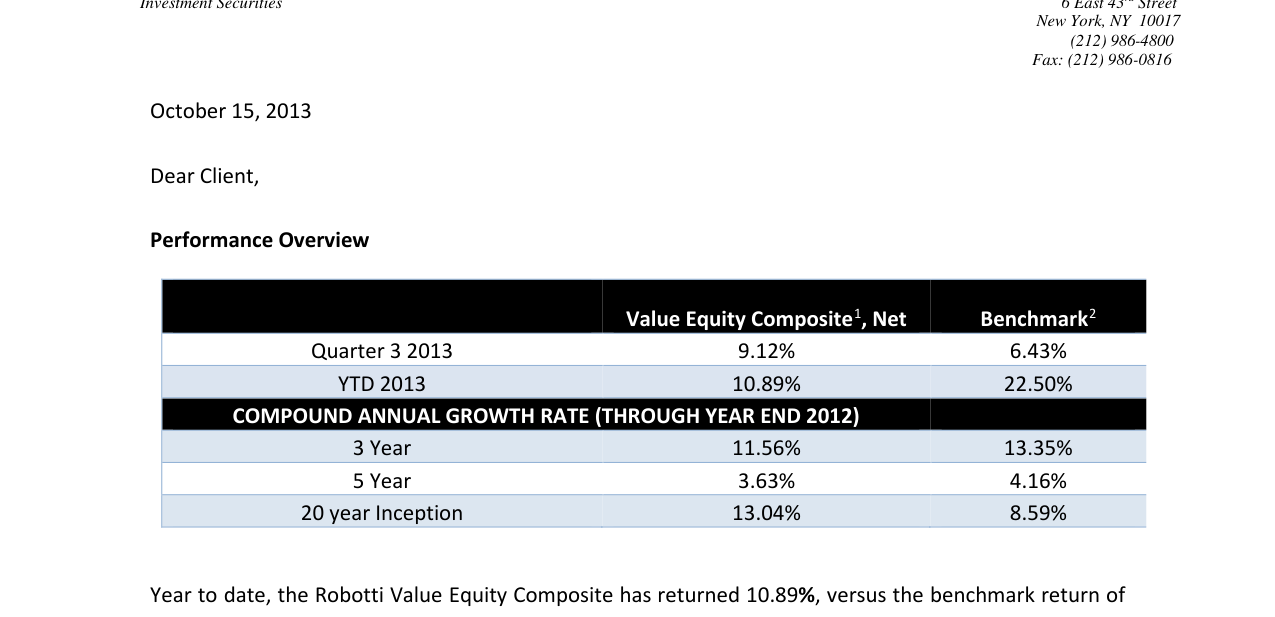
Robotti Research Report (Q3 2013) notes that its Value Equity Composite posted a return of 9.12% in the third quarter, outperforming the benchmark (Russell 2500 Value Index) by 269 basis points (6.43%). However, the year-to-date return of 10.89% lagged behind the benchmark's 22.50%. The report empha
Theme and Background
This chapter is the opening section of Robotti & Company Advisors' Q3 2013 letter to clients, primarily reviewing the short-term performance of the Value Equity Composite and articulating the core logic of its long-term value investing framework. The report emphasizes that while year-to-date (YTD) performance has lagged the benchmark, quarterly results have shown improvement. The author argues that investors should ignore market noise (such as Fed easing policies, debt ceiling debates, and government shutdowns) and focus on intrinsic company value.
Core Thesis
The author's core investment argument is: Adhere to contrarian value investing and patiently wait for mean reversion, rather than chasing short-term market trends. Counterintuitive judgments include:
- Short-term performance fluctuations (whether outperforming or underperforming) should not be overinterpreted; the long term (20-year annualized 13.04% vs. benchmark 8.59%) is the true standard for validating the framework.
- The market generally believes that "taller parents have taller children," but statistical mean reversion suggests that extreme cases tend to move toward the average—this applies equally to business cycles and stock valuations.
- The author admits an inability to predict market timing (e.g., "when stock prices will rebound") but believes that as long as the intrinsic value judgment is correct, short-term losses are an acceptable cost.
Key Arguments and Data
- Performance Comparison: Q3 2013 outperformed the benchmark by 269 basis points, but YTD lagged by 1,161 basis points; over the long term (20 years), annualized outperformance was 445 basis points.
- Mean Reversion Example: Using height as an analogy, children of taller parents are more likely to be shorter than their parents, and children of shorter parents are more likely to be taller—paralleling the reversion after supply-demand imbalances in business.
- Skechers Case Study: The stock fell from a 52-week high of $45 to a low of $11.70 (below tangible book value of $17.50). The author bought below $15, and it closed Q3 at $31.11, with YTD gains exceeding 55%. Key data:
- The 2010 "Shape-ups" craze contributed over $400 million in revenue, but demand "disappeared overnight."
- From 2000 to 2010, the company's revenue CAGR was approximately 8%, gross margin dipped below 40% only once (38% in 2003), average operating margin exceeded 6%, ROE was around 12-13%, and it consistently held net cash.
- Investment Discipline: The author prefers "returns with 15% volatility" over "smooth 12% returns," emphasizing that short-term losses are an inevitable cost of contrarian investing.
Companies/Assets Involved
| Company/Asset | Role | Key Data | Bullish/Bearish |
|---|---|---|---|
| Skechers USA Inc. (NYSE:SKX) | Core holding case study | Buy price <$15 (below tangible book $17.50), Q3 close $31.11, YTD gain >55%; net cash position, historical ROE ~12-13% | Bullish (partially profited, still holds a large position) |
| Ainsworth Lumber Co. Ltd. | Mentioned but not elaborated | No specific data | Not specified |
Investment Insights
- Timing for Contrarian Positioning: When the market drives a stock below tangible book value due to short-term negative events (e.g., inventory overhang, product cycle end), it presents an entry opportunity for value investors, though they must accept the risk of further short-term declines.
- Focus on Core Business, Not Noise: The Skechers case shows that even if a hot product (Shape-ups) completely disappears, the profitability of the core business (traditional footwear)—gross margin, ROE, net cash—forms the foundation of long-term value.
- Patience is Key to Excess Returns: Mean reversion takes time; investors should avoid changing their framework due to short-term underperformance. The author's 20-year annualized outperformance of 445 basis points demonstrates the effectiveness of long-term persistence.
Additional Arguments and Data: In-Depth Analysis of Ainsworth Lumber and Subsea 7
1. Ainsworth Lumber Case: The Unexpected Intersection of Long-Term Investing and Market Timing
- Investment Logic: Robotti indirectly discovered Ainsworth through an investment in Builders FirstSource (BLDR), exemplifying a "supply chain derivative investment" strategy. Ainsworth is a low-cost producer of OSB (oriented strand board), which replaces plywood in residential construction, holding over 60% market share. The industry underwent painful consolidation during the recession, and survivors like Ainsworth, backed by Brookfield Asset Management (BAM), completed recapitalization, focusing on niche products.
- Data Highlights:
- Just three weeks after investing in Ainsworth, Louisiana-Pacific (LPX) announced an acquisition, yielding nearly 20% returns.
- Post-consolidation, Ainsworth became a beneficiary of "well-capitalized, concentrated markets," riding the housing recovery and niche product demand.
- Comparative Data: Robotti views Ainsworth as a "small, overlooked recapitalized company," consistent with the "fishing in the same pond" strategy as private equity or opportunistic investors. This strategy proved particularly effective in the Q3 2013 market environment (U.S. stocks broadly rising, S&P 500 returning approximately 5% over the period).
Value Equity Composite returned 9.12% in Q3, 10.89% YTD, and 13.04% annualized over 20 years, compared to Russell index benchmarks.
| Metric | Ainsworth Lumber | S&P 500 (2013 Q3) |
|---|---|---|
| Holding Period | Approximately 3 weeks | - |
| Return | Approximately 20% | Approximately 5% |
| Industry Context | Post-consolidation OSB recovery | Broad market modest gains |
2. Subsea 7: Volatility and Value Realization in the Largest Holding
- Market Performance: Subsea 7 (SUBC) rose 16.5% in Q3 2013, following a decline due to impairments on the Brazil Guara-Lula project. Robotti views the impairment as "project-specific, not systemic," a view the market gradually adopted.
- Industry Position: Subsea 7 operates in an "oligopolistic" industry (subsea engineering services). Through discussions with executives and competitors, Robotti confirmed a positive outlook for the company and industry. This holding represents the largest weight in the "Value Equity Composite," reflecting long-term conviction.
- Data Comparison: In Q3 2013, SUBC's gain (16.5%) significantly outperformed the S&P 500 (approximately 5%) and Russell 2000 (approximately 10%), but with higher volatility (having declined in Q2 due to impairments).
| Metric | Subsea 7 (2013 Q3) | S&P 500 (2013 Q3) | Russell 2000 (2013 Q3) |
|---|---|---|---|
| Return | +16.5% | +5% | +10% |
| Driver | Market absorbs Brazil project impairment | Broad economic recovery | Small-cap rebound |
3. Portfolio Adjustments: A "Harvesting" Strategy Under Long-Termism
- PriceSmart (PSMT): Robotti held this for approximately 10 years, generating a return of 1,200% (from $6.50/share in September 2003 to $95.23/share in September 2013), compared to the S&P 500's 68.84% and Russell 2000's 120.2% over the same period. Current selling due to high valuation reflects the Buffett-like logic of preferring 15% volatile returns over 12% smooth returns.
- Drew Industries (DW): Continued selling, with no specific data provided, but implying similar logic (full valuation or changing opportunity costs).
- Skechers: Partially sold after significant appreciation, contrasting with Ainsworth's short-term acquisition return—the former is a harvest after long-term holding, the latter is short-term event-driven.
| Holding | Holding Period | Total Return | S&P 500 (Same Period) | Russell 2000 (Same Period) |
|---|---|---|---|---|
| PriceSmart | 10 years | 1,200% | 68.84% | 120.2% |
| Ainsworth | 3 weeks | 20% | Approximately 5% | Approximately 10% |
4. Strategy Summary: Balancing Long-Term Investing and Event-Driven Opportunities
- Robotti emphasizes "low turnover" and "long-termism," but the Ainsworth case shows no aversion to short-term event-driven opportunities (acquisition premiums). This flexibility stems from deep industry research (e.g., OSB supply chain) and patience in waiting for market mispricing.
- Comparative Data: PriceSmart's 10-year 1,200% return vs. Ainsworth's 3-week 20% return illustrates that Robotti's portfolio includes both "slow variables" (long-term holds) and "fast variables" (event catalysts), with value discovery as the core.
| Strategy Type | Representative Case | Holding Period | Return Characteristics | Risk Sources |
|---|---|---|---|---|
| Long-Term Hold | PriceSmart | 10 years | High compounding, high volatility | Valuation reversion, increased competition |
| Event-Driven | Ainsworth | 3 weeks | Short-term high return, high certainty | Failed acquisition, industry cycles |
| Industry Deep Dive | Subsea 7 | Ongoing | Oligopoly dividends, moderate volatility | Project risk, oil price fluctuations |
Key Insights
- Data Validation: Robotti's "long-term investing" is not rigid but flexible, based on deep research, switching when opportunities arise. Ainsworth's 20% return, though small in absolute terms, represents an extremely high annualized rate (approximately 347%), exemplifying "low-risk, high-certainty" event arbitrage.
- Market Comparison: In Q3 2013, U.S. stocks rose modestly overall, but Robotti's portfolio outperformed indices through Subsea 7 (+16.5%) and Ainsworth (+20%), while PriceSmart's long-term return far exceeded benchmarks. This validates the effectiveness of the "value discovery + patient holding" strategy.
- Risk Note: Subsea 7's Brazil project impairment caused stock volatility, but Robotti, through industry research and management communication, confirmed the issue was non-systemic, ultimately gaining market recognition. This highlights the combination of "contrarian investing" and "informational advantage."