Looking Where the Light Is: Volatility Is Not Risk.
Patient Capital Management is a Baltimore asset manager founded in 2020 by Samantha McLemore, CFA — Bill Miller's long-time co-manager (working together since 2002, running the flagship Opportunity Equity strategy since 2014). Continuing the Miller-school contrarian tradition, it practices "time arbitrage": exploiting behavioral mispricing to concentrate in controversial growth names (tech, healthcare, Bitcoin-related) at deep discounts to intrinsic value. Its site preserves Bill Miller's complete 1995-2022 market letters, alongside ongoing quarterly letters and webinars.
In plain words
This essay argues that volatility is not risk; real risk is permanent loss of capital. The author warns investors not to pick funds by volatility or fund ratings, but to check whether gains when right exceed losses when wrong. Volatility-based models used by endowments have lagged the market. Highlights: the FAANG/Mag 8 basket averaged 31.5% annual returns but fell about 1.6 times as much as the market in downturns; the S&P 500 returned 12.8% annually over ten years, beating most endowments; and the author advises buying good managers when they temporarily underperform.
At a Glance
The author argues that volatility is only a "measurable" proxy; the essence of risk is permanent capital loss. Long-term investors should abandon using volatility to select funds and instead shift to scenario analysis and tests of asymmetry of gains and losses. [Cautious]
- Morningstar/Vanguard fund rating research shows that ratings with high volatility weighting have weak correlation with future performance. Vanguard even found that one-star funds outperformed five-star funds, indicating that "selecting funds by volatility" is unreliable.
- Many university endowments use volatility-based risk models; their ten-year average annual return through June 2024 was only 6.8%, far below the S&P 500's 12.8% and MSCI ACWI's 9.0%.
- The FAANG/Mag 8 basket posted an average annual return of 31.5% from end-2009 to the end of last year, roughly more than double the S&P 500's 14%. A $10,000 investment would have grown to approximately $796,000, nearly 10 times the S&P 500's ~$83,000—but its average drawdown was roughly 1.6 times that of the market.
- The author proposes that a pragmatic test for a risk framework is "asymmetry of gains and losses"—earning more when right than losing when wrong—and advocates using scenario analysis to assess the distribution of outcomes and price compensation, rather than controlling the magnitude of volatility.
Volatility Is Measurable, But It Is Not Risk Itself
The article opens with the "streetlight effect": the investment industry measures risk by volatility because it can be quantified, not because it is risk. The author writes that a person who loses their keys searches under the streetlight not because they were dropped there, but because that is where the light is — the investment industry has been doing something remarkably similar for decades. Investment risk is inherently difficult to measure directly; volatility, by contrast, is easy. Faced with a concept that cannot be directly quantified, the industry chose one that can be. The author stresses that this was "not an irrational decision, but a pragmatic one." Modern portfolio theory (MPT) and the capital asset pricing model (CAPM) provided a rigorous mathematical framework for risk and return, and volatility gradually evolved from a proxy for risk into the definition of risk itself. The mathematician Benoit Mandelbrot later showed that the framework's key assumptions were flawed: markets experience extreme price swings far more frequently than traditional models predict (the "fat tails"). But the author points out that the lure of quantification is too strong — investment advice became easier to manage not because uncertainty disappeared, but because it became easier to quantify.
Volatility Tools Have Not Delivered Better Returns
If volatility were a valid measure of risk, its use should improve long-term returns; the author uses two sets of evidence — fund ratings and endowments — to show that this is not the case. Morningstar's fund ratings place considerable weight on volatility, but multiple studies have found that these ratings have only a weak relationship with future fund performance; Vanguard even found in one study that one-star funds outperformed five-star funds. The author's interpretation: the quantitative metrics preferred by the industry are mostly backward-looking and non-stationary, so they look best after strong performance and worst after significant underperformance, in practice often reinforcing "buy high, sell low," the greatest mistake in investing. The better process the author advocates is to identify excellent managers with robust investment processes and invest during their periodic underperformance. The disconnect is equally evident at the institutional level: after the financial crisis, many university endowments adopted complex risk models and volatility-based portfolio construction, yet produced average annual returns of only 6.8% over the ten years through June 2024.
| Portfolio | Ten-year annualized return through June 2024 |
|---|---|
| University endowments (average) | 6.8% |
| S&P 500 | 12.8% |
| MSCI ACWI | 9.0% |
| 60/40 stock-bond portfolio | 7.7% |
The author concedes that underperformance cannot be blamed entirely on the "risk equals volatility" paradigm, but also notes that there is no convincing evidence that increasingly sophisticated volatility measures consistently translate into better investment outcomes.
Big Winners Often Come with Deeper Drawdowns
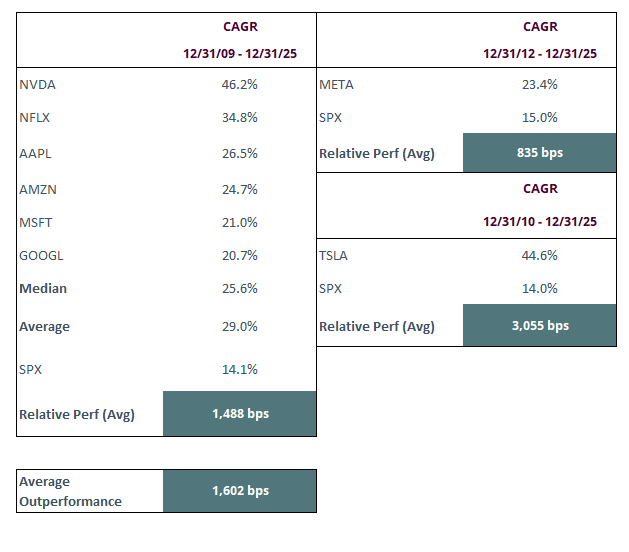
The author uses the FAANG/Mag 8 basket as an example: high volatility (including downside volatility) is often a hallmark of the market's biggest long-term winners, not a flaw. The article notes that some institutions have shifted to "downside capture" or "upside/downside capture" metrics, measures that at least acknowledge the value of upside volatility. The author's observation as a practitioner: "our observation as practitioners is that the stock that rise the most also tend to fall the most during market drawdowns" — that is, "the stocks that rise the most also tend to fall the most during market drawdowns." In hindsight, FAANG/Mag 7 or Mag 8 became some of the greatest wealth creators in modern market history; if investors had known this outcome in advance, the drawdowns along the way would have been a small price to pay. From the end of 2009 (or their IPO dates for those listed later) through the end of last year, the basket posted an average annual return of 31.5% — more than twice the S&P 500's 14%; a $10,000 investment in Mag 8 would now be worth approximately $796,000, roughly ten times an investment in the S&P 500 (approximately $83,000) (Exhibit A). The article does not name the basket's constituents individually, referring to them only collectively as FAANG/Mag 7 or Mag 8.
| Metric (end of 2009 through end of last year) | Mag 8 basket | S&P 500 |
|---|---|---|
| Average annual return | 31.5% | 14% |
| Ending value of a $10,000 investment | Approximately $796,000 | Approximately $83,000 |
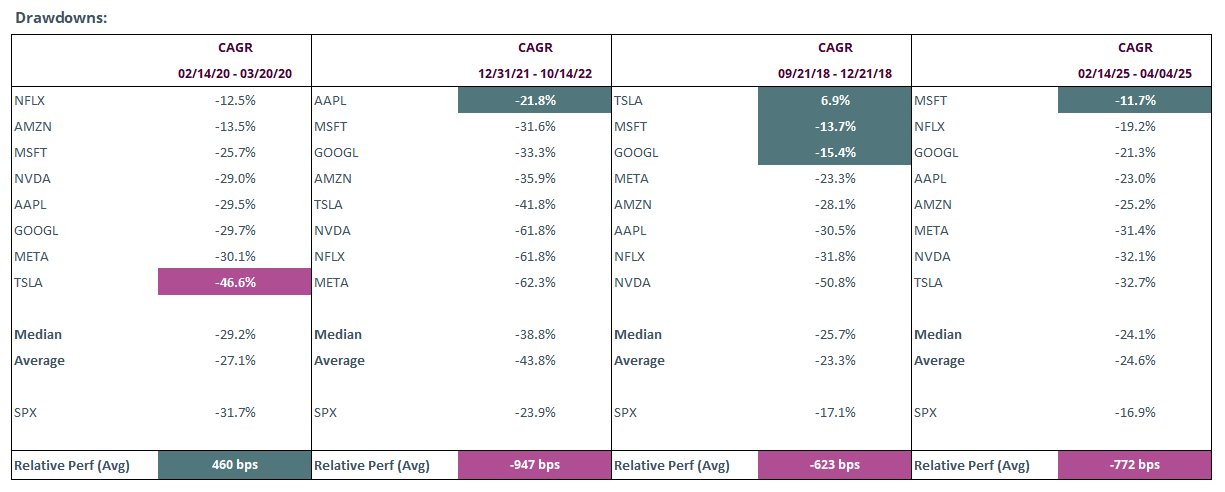
The cost is deeper drawdowns: the basket underperformed the market in three of the past decade's four largest market sell-offs, the sole exception being the pandemic period — when surging demand for digital services was especially favorable to its business model. Excluding that period, its average drawdown was roughly 1.6 times the market's (Exhibit B). Research by Hendrik Bessembinder of Arizona State University likewise finds that many of the market's greatest long-term wealth creators experienced unusually large drawdowns along the way.
Risk Is Permanent Loss, Not Volatility
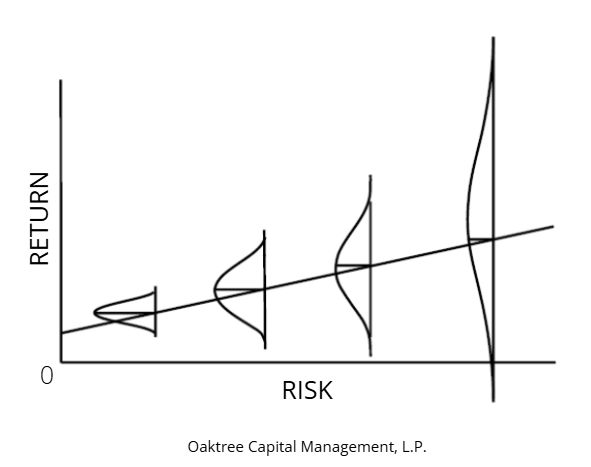
The academic evidence on beta does not match CAPM's predictions; the article returns to the Buffett definition cited at the start — risk is measured not by beta, but by the probability of a loss of purchasing power. The article reviews the well-known empirical studies: the early work of Black, Jensen, and Scholes found that the relationship between beta and returns did not fit CAPM's predictions; follow-up research by Fama and French and by Frazzini and Pedersen further questioned the claim that "buying the highest-beta stocks reliably earns excess long-term returns." The only setting where the theory holds up consistently is a leveraged market index — whose upside and downside move one-for-one with beta's predictions. The author says beta remains useful as a measure of market sensitivity, and he himself uses it, but like volatility it describes only one dimension of investment risk; raising beta alone cannot reliably construct an outperforming portfolio. The article marks the turning point in one sentence: "Perhaps the problem isn't volatility itself. Perhaps it's the definition of risk." — that is, "perhaps the problem is not volatility itself, but the definition of risk." The definition the author offers: investment risk is the possibility of permanent capital loss and loss of purchasing power, not the daily fluctuation of market prices. The article cites Howard Marks's Exhibit C to illustrate that future risk is best understood as the distribution of potential future returns — the wider the distribution, the greater the risk.
Investment Implications
For long-term investors, the actionable conclusions of this article are: stop selecting funds by volatility/ratings; identify managers with robust processes and buy during their temporary underperformance; and tolerate the deep drawdowns of big winners. The author notes that volatility-type metrics are backward-looking and can amplify chasing highs and selling lows; and because the market's biggest winners generally come with deeper drawdowns, filtering by volatility amounts to filtering out the source of excess returns. A reminder on institutional perspective bias: Patient Capital, as an asset manager advocating "patient capital," gives the advice to "buy when managers are underperforming" — which is precisely its own business model; readers should note that this is a self-justifying argument from the perspective of a position holder. The author also candidly acknowledges that endowment underperformance cannot be fully attributed to the volatility paradigm.
Scenario Analysis Replaces Volatility as the Firm's Practical Risk Metric
The article notes that its investment process uses extensive scenario analysis to evaluate the distribution of potential outcomes for each investment, the key drivers behind those outcomes, and whether the current price sufficiently compensates for the associated risks. The author writes: "Through extensive scenario analysis, we evaluate the range of potential outcomes for each investment, the key drivers behind those outcomes, and whether today's price more than compensates us for the associated risks" — meaning: "Through extensive scenario analysis, we evaluate the range of potential outcomes for each investment, the key drivers behind those outcomes, and whether the current price sufficiently compensates for the associated risks." This is in line with the earlier overview's proposition that "the essence of risk is loss of purchasing power, not volatility": the object of risk measurement shifts from price volatility to the distribution of outcomes itself.
The article further stresses that uncertainty and risk are two different things, and both must be adequately compensated: "we must be adequately compensated for both uncertainty and risk" — meaning: "We must be adequately compensated for both uncertainty and risk." Business quality, valuation, competitive position, management decisions, and other factors jointly determine the level of risk in an investment, and these factors cannot be captured by a single volatility number.
The Test of a Risk Framework Is Asymmetry of Outcomes, Not Model Precision
The author argues that the only pragmatic test of a risk framework's effectiveness is whether it improves long-term investment returns — specifically, making more money when right than losing when wrong. The original text states: "The pragmatic test of a risk framework's effectiveness is its ability to improve long-term investment returns. At the end of the day, investors aim to make more money when they are right than they lose when they are wrong." — meaning: "The pragmatic test of a risk framework's effectiveness is its ability to improve long-term investment returns. Ultimately, what investors pursue is making more when they are right than losing when they are wrong." This definition shifts the focus of risk management from "controlling drawdown magnitude" to "asymmetry of gains and losses" — under this framework, a strategy that allows larger drawdowns but offers favorable long-term odds is "safer" than a low-volatility strategy with mediocre returns.
Measurability Is Not Relevance: Volatility Is Special Because It Is Easy to Quantify, But It Is Not the Answer
The article concedes that volatility's "measurability" has made it an indispensable investment tool, but reminds us that long-term investment success has always depended on seeing beyond what the market makes most visible. The author concludes with an aphoristic judgment: "In investing, as in life, the easiest place to look isn't always where you'll find the answer. The ability to measure volatility has made it an indispensable investment tool, but long-term investment success has always depended on seeing beyond what the market makes most visible." — meaning: "In investing, as in life, the easiest place to look is not always where you will find the answer. The ability to measure volatility has made it an indispensable investment tool, but long-term investment success has always depended on seeing through what the market makes most visible." The logic here echoes the chain of evidence in the report's overview: volatility is widely used precisely because it is a computable proxy — not because it is risk itself. The five pieces of literature cited at the end (Vanguard's research on fund ratings and future performance, Bessembinder's "Do Stocks Outperform Treasury Bills?", empirical tests of the CAPM, the Fama-French three-factor model, and Betting Against Beta) together outline the long-running academic debate over "how risk should be measured," and the author uses this to show that the volatility framework is merely one option that has been mainstreamed, not a settled conclusion.
Investment Implications
The actionable implication for investors is that, when selecting managers, one should not treat short-term performance volatility as the core metric for risk review, but should instead examine whether the manager's decision-making process systematically evaluates the relationship between outcome distributions and price compensation. The firm positions its own process as a "better investment decision" system centered on scenario analysis, aiming to show that its return source is judgment quality rather than volatility management. Readers should note that this is a self-defense from a position holder's perspective — the article endorses its approach with phrases such as "adequate compensation" and "pragmatic test," yet provides no concrete scenario analysis cases to substantiate what this framework actually produces.
Position Moves
| Instrument | Direction | Author's Stance in One Sentence | Key Data |
|---|---|---|---|
| FAANG/Mag 7 or Mag 8 basket | Hold / observe | Big winners often come with deeper drawdowns; volatility filters can mistakenly eliminate sources of excess returns | Average annual return of 31.5% from end-2009 to end of last year vs. 14% for the S&P 500; $10,000 investment terminal value of approx. $796,000 vs. approx. $83,000 for the S&P 500; underperformed the market in three of the four largest selloffs over the past decade; excluding the pandemic drawdown, roughly 1.6x the market |
| S&P 500 | Not specified | As a long-term return benchmark, it clearly outperforms endowments that adopt volatility models | 10-year annualized return of 12.8% as of June 2024; $10,000 investment terminal value of approx. $83,000 |
| University endowments (average) | Not specified | Returns still underperform a simple benchmark after adopting complex volatility risk models | 10-year annualized return of 6.8% as of June 2024 |
| MSCI ACWI | Not specified | As a global equity benchmark, returns fall between the S&P 500 and endowments | 10-year annualized return of 9.0% as of June 2024 |
| 60/40 stock/bond portfolio | Not specified | Traditional portfolio outperforms endowments but trails equity indices | 10-year annualized return of 7.7% as of June 2024 |
| One-star/five-star funds covered by Morningstar/Vanguard fund ratings | Not specified | Ratings assign excessive weight to volatility, with weak correlation to future performance; Vanguard even finds one-star funds outperforming five-star funds | No specific figures |
| Superior managers (with robust investment processes) | Add position | Should be bought during periods of temporary underperformance, not avoided based on short-term volatility | No specific figures |
| The market's greatest long-term wealth creators | Not specified | They often experience extraordinarily large drawdowns along the way (Bessembinder research) | No specific figures |
| Leveraged market indices / high-beta stocks | Not specified | Relying solely on raising beta cannot reliably construct an outperforming portfolio; beta is only one dimension of risk | No specific figures |