Bargain, Value Trap or Something in Between?
GMO is a Boston asset manager co-founded in 1977 by Jeremy Grantham with Richard Mayo and Eyk Van Otterloo, known for valuation-driven dynamic asset allocation built on long-horizon mean reversion. Grantham is famous for calling historic bubbles, warning publicly ahead of both the 2000 dot-com crash and the 2008 financial crisis. Flagship publications include the GMO Quarterly Letter (now written by Asset Allocation co-heads Ben Inker and John Pease), Grantham's Viewpoints essays and the 7-Year Asset Class Forecast.
In plain words
This report from investment firm GMO helps regular investors tell the difference between a real bargain and a value trap. After a decade of US growth stocks soaring, GMO looks at three lagging assets: US value stocks (priced below their true worth), US small-cap stocks, and Chinese stocks. The key is to check if their poor performance comes from cheap valuations or bad fundamentals. GMO concludes US value stocks are genuinely cheap and promising; small-caps need careful picking; Chinese stocks face too many risks—more trap than opportunity. Don't buy just because it's cheap.
GMO's Q4 2024 report analyzes three categories of relatively lagging assets after the long-term outperformance of US large-cap growth stocks: US value stocks, US small-cap stocks, and Chinese stocks. The core argument is that over the past decade, US large-cap growth stocks have delivered an annuali
Theme and Background
This chapter serves as the report's introduction, posing a core question: After U.S. large-cap growth stocks have long outperformed major global financial assets, which lagging assets have the potential to rebound, and which may continue to disappoint? The author explicitly adopts a contrarian perspective, arguing that U.S. large-cap growth stocks, which delivered an annualized real return of 12.4% over the past decade, do not represent the best future opportunity. Instead, opportunities are more likely to emerge from three significantly lagging asset classes: U.S. value stocks, U.S. small-cap stocks, and Chinese equities.
Core Thesis
The author's core investment argument is: Investors need to systematically distinguish between "bargains" and "value traps." The counterintuitive judgment lies in the fact that not all low-valuation assets are worth buying. It is essential to identify, through four dimensions of analysis, which lagging assets truly have the conditions for a rebound and which have lagged with reasonable support from fundamental deterioration.
Key Arguments and Data
The author proposes four analytical dimensions for assessing the rebound potential of lagging assets, but this chapter only outlines the framework without delving into specific data:
1. Valuation Compression vs. Fundamental Deterioration: Distinguishing whether an asset's underperformance stems from valuation compression (potentially reversible) or genuinely worsening fundamentals (likely to persist).
2. Earnings Quality and Growth Sustainability: Assessing whether the profitability of lagging assets is deteriorating and whether such deterioration is reasonably priced by the market.
3. Shareholder Returns and Capital Allocation: Analyzing whether companies reward shareholders through buybacks, dividends, etc., or engage in dilutive actions.
4. Macro and Geopolitical Risks: Considering the impact of external factors (e.g., regulation, trade frictions) on asset prospects.
Companies/Assets Involved
This chapter does not cover specific companies but lists three asset classes:
| Asset Class | Role | Key Judgment |
|---|---|---|
| U.S. Large-Cap Value Stocks | Core focus | Extremely low valuations, nearly never this cheap relative to the market; underperformance primarily due to valuation compression |
| U.S. Small-Cap Stocks | Requires caution | Cheap, but deteriorating profitability and declining quality are partially justified; focus on high-quality names |
| Chinese Equities | Recommended to avoid | Lowest valuations globally, but poor returns stem from fundamental deterioration and shareholder dilution, compounded by geopolitical and regulatory risks |
Investment Implications
- Long U.S. Large-Cap Value Stocks: The author believes their underperformance is due to valuation compression rather than fundamental issues, and expects them to perform well, especially in long-short portfolios.
- Selective Participation in U.S. Small-Cap Stocks: Overall cheap but with uneven quality; focus on high-quality small-cap stocks where profitability has not deteriorated.
- Avoid Chinese Equities: Despite extremely low valuations, fundamental deterioration, shareholder dilution, and geopolitical risks make them closer to value traps; the report recommends shifting to emerging markets ex-China.
Theme and Background
This chapter focuses on GMO's evaluation framework for three categories of "lagging assets" (U.S. large-cap value stocks, U.S. small-cap stocks, and Chinese stocks), analyzing whether their valuation levels are truly cheap and the impact of structural forces (such as fundamental deterioration, shareholder dilution, and geopolitical risks) on future return potential. The report notes that over the past decade (September 2014 to September 2024), U.S. large-cap growth stocks delivered an annualized real return of 12.4%, far outperforming other assets, but the valuations of laggards are at historically extreme lows.
Core Views
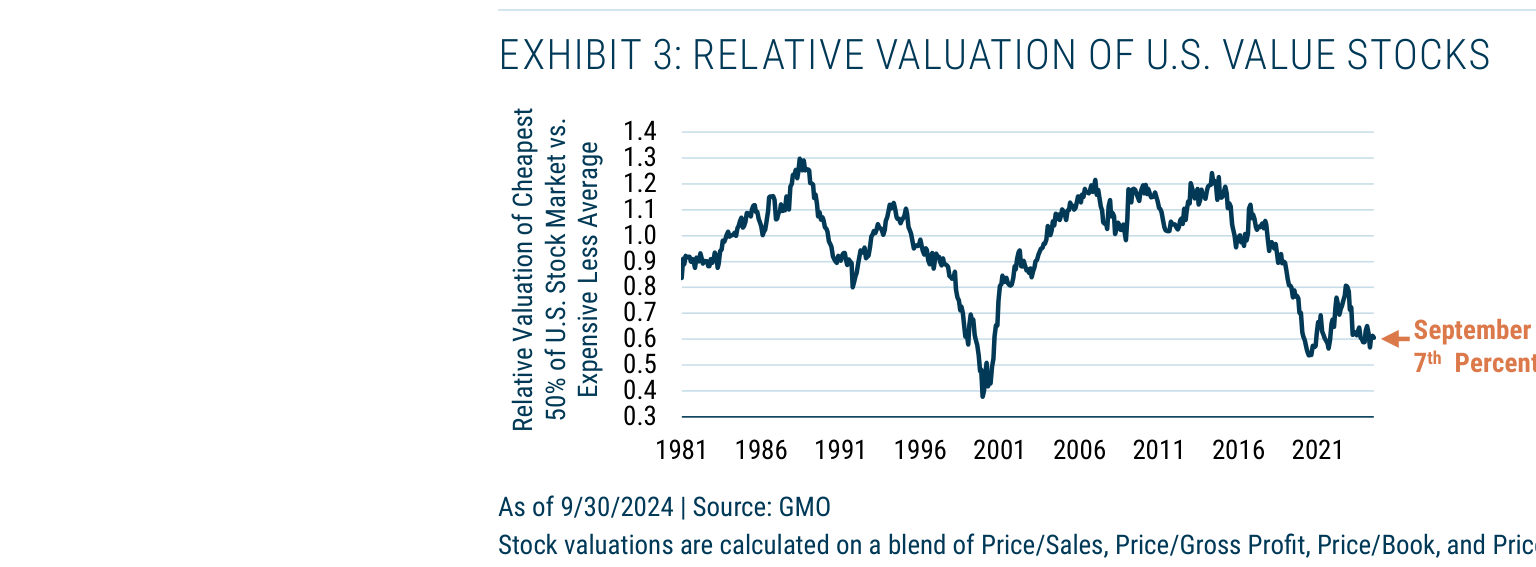
- U.S. Large-Cap Value Stocks Are Highly Attractive: Their relative valuation versus the market is at the 7th percentile historically (almost never this cheap). The underperformance is mainly due to valuation compression rather than fundamental deterioration, and they are expected to perform well in long-short portfolios.
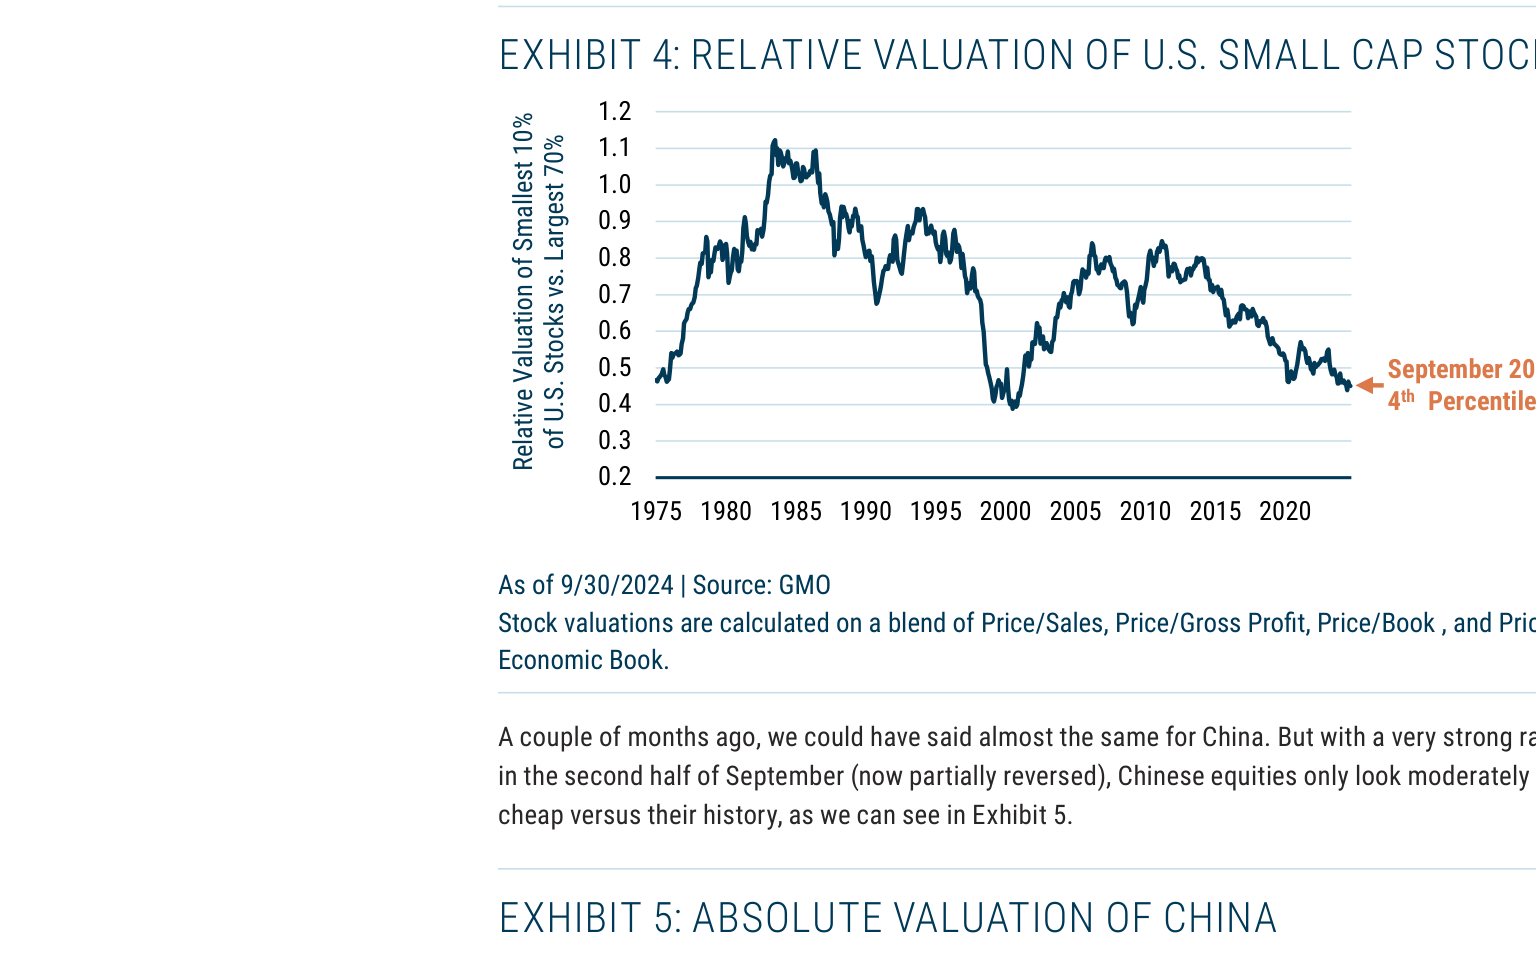
- U.S. Small-Cap Stocks Are Cheap but Require Caution: Relative valuation is at the 4th percentile historically, but deteriorating profitability, declining quality, and slowing growth are partially justified. Focus should be on high-quality names.
- Chinese Stocks Have the Lowest Valuations Globally but High Fundamental Risks: Valuation is only at the 39th percentile historically, but poor returns are mainly due to fundamental deterioration and shareholder dilution, coupled with geopolitical and regulatory risks. Caution is advised, with a preference for emerging markets excluding China.
Key Arguments and Data
1. U.S. Large-Cap Value Stocks:
- Relative valuation (vs. growth stocks) is 0.6, at the 7th percentile historically (Exhibit 3). A reversion to the historical mean would require a 67% relative outperformance versus growth stocks.
- The annualized real return over the past decade is 8.8% (GMO definition), but the MSCI USA Large Cap Value Index returned only 5.6%, indicating a worse performance under traditional index definitions.
2. U.S. Small-Cap Stocks:
- Relative valuation (vs. large-cap stocks) is at the 4th percentile historically (Exhibit 4). A reversion to the historical mean would require a roughly 60% relative outperformance versus large-cap stocks.
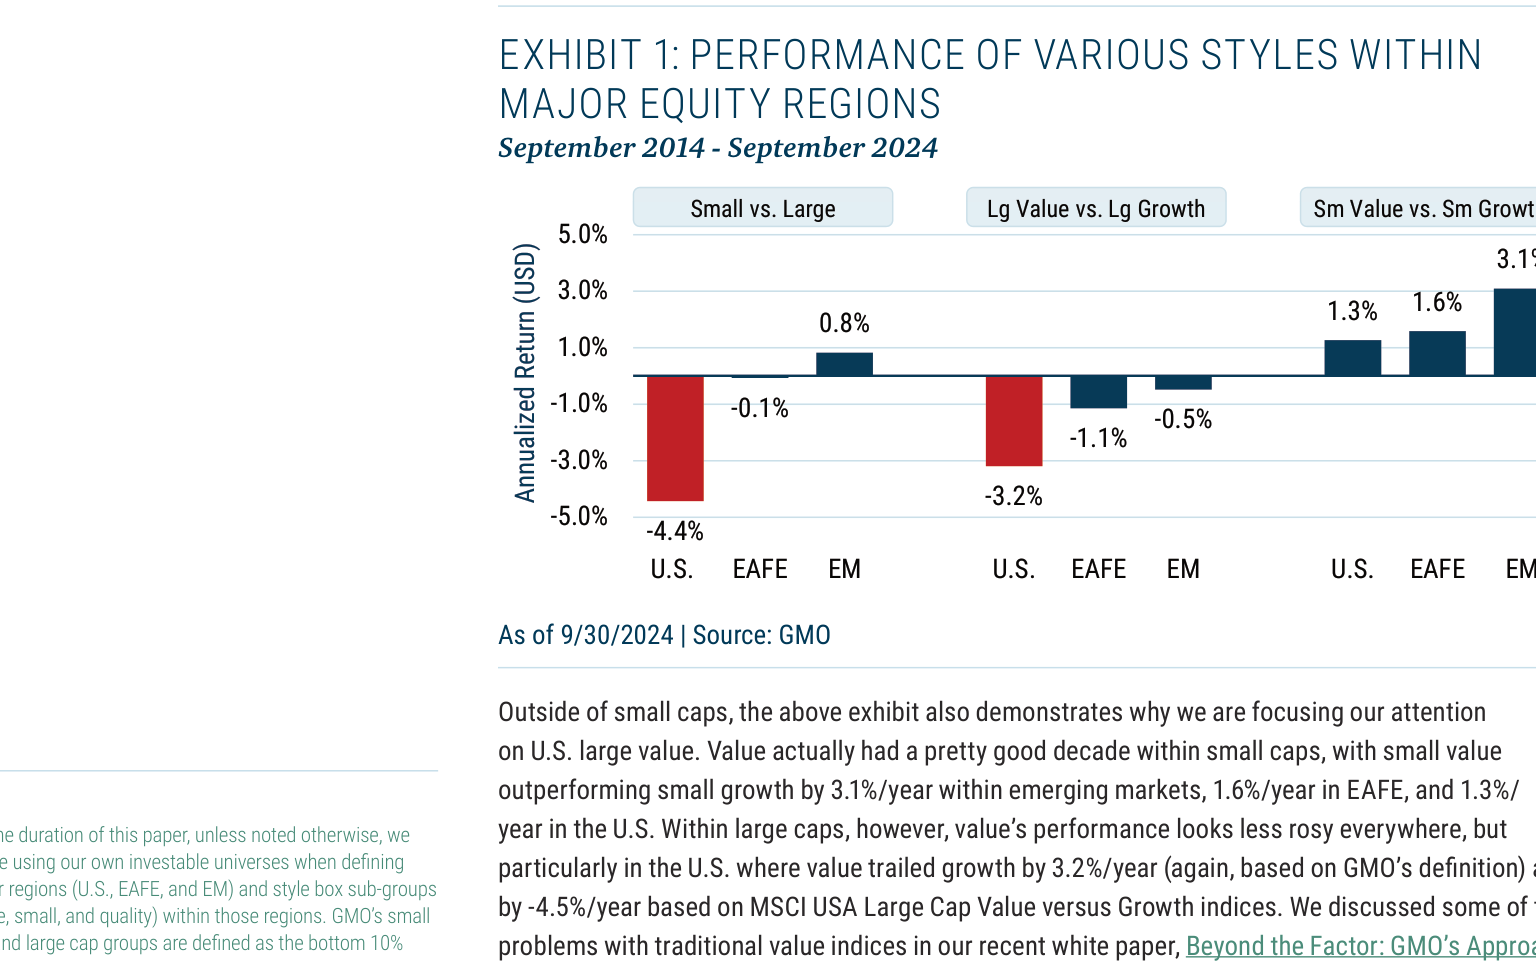
- The annualized real return over the past decade is 5.8%, lagging large caps by 4.4% per year; even excluding the "Magnificent 7" and the top 10 stocks, the lag is still 2.5% per year.
3. Chinese Stocks:
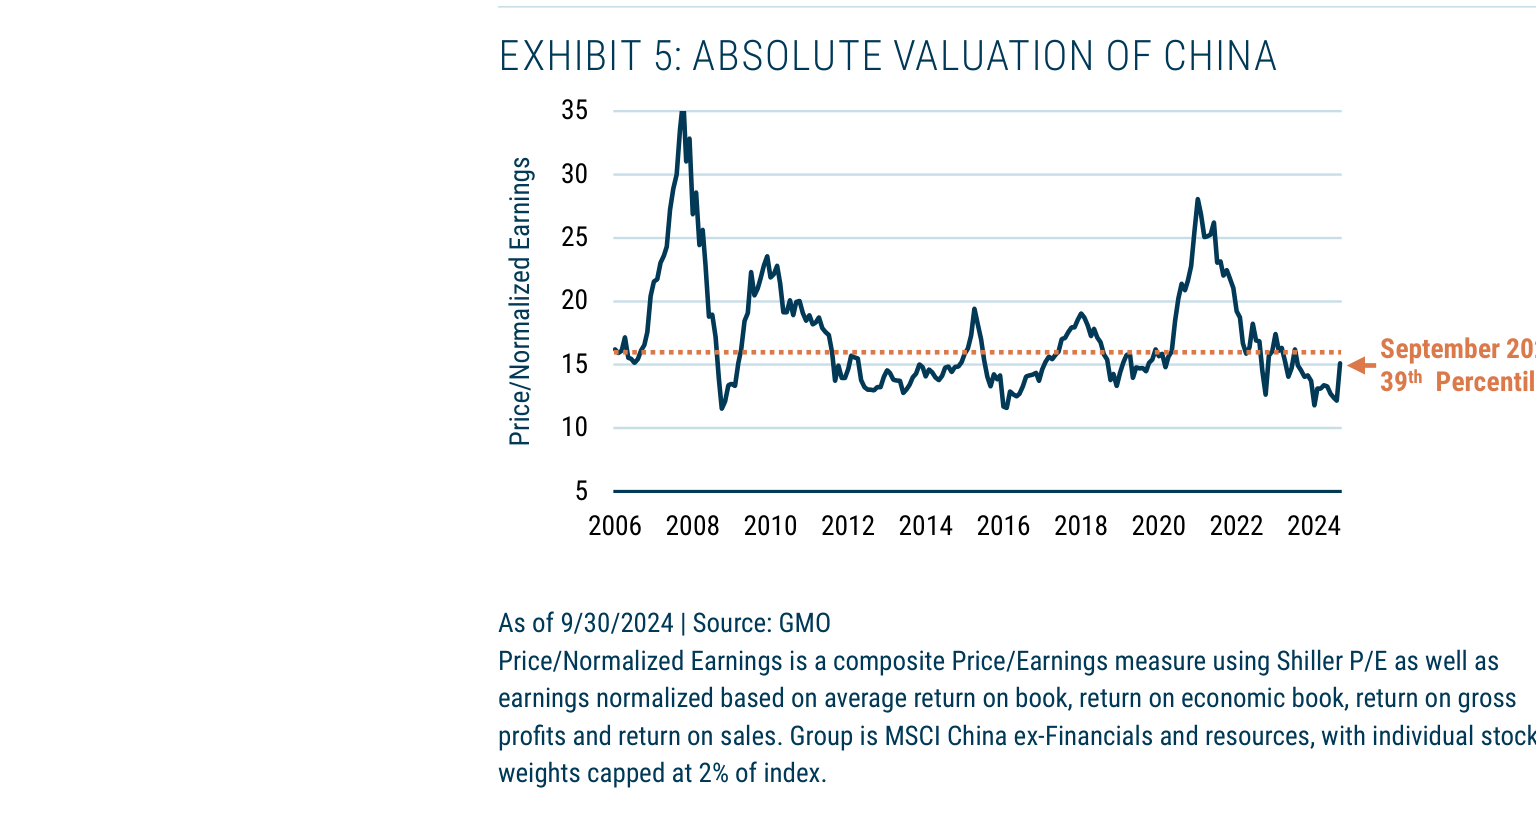
- Absolute valuation (Price/Normalized Earnings) is at the 39th percentile historically (Exhibit 5), but after the September rally, they are only "moderately cheap."
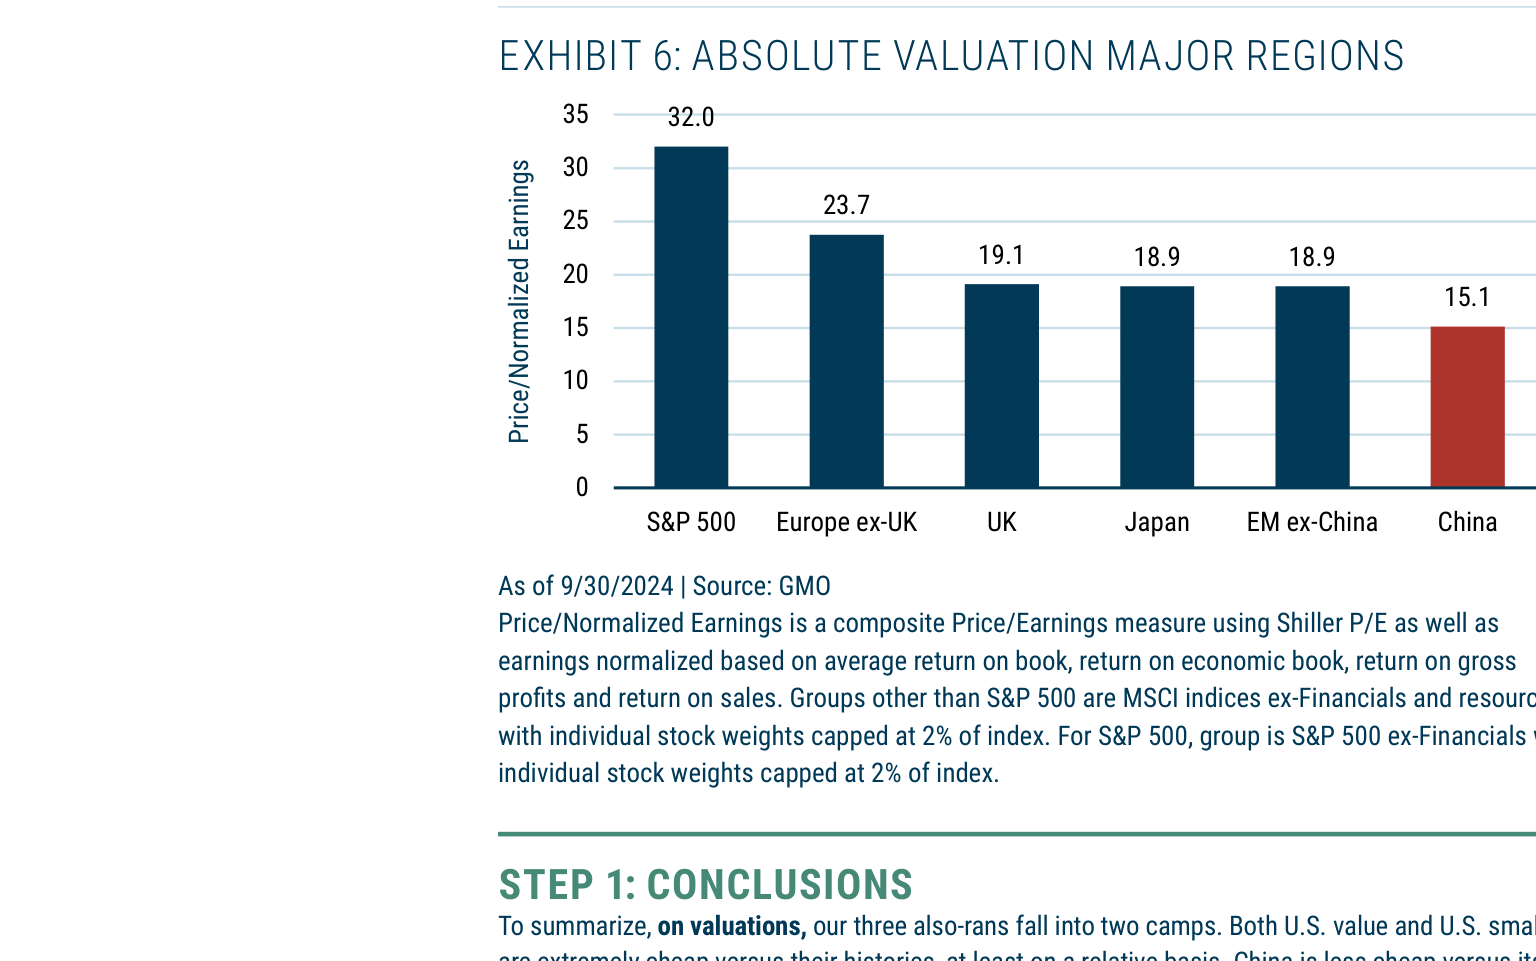
- The cheapest major market globally: Shiller P/E is less than half that of the U.S. (U.S. 32.0 vs. China approximately 12-13), and about 25% lower than other global markets (Exhibit 6).
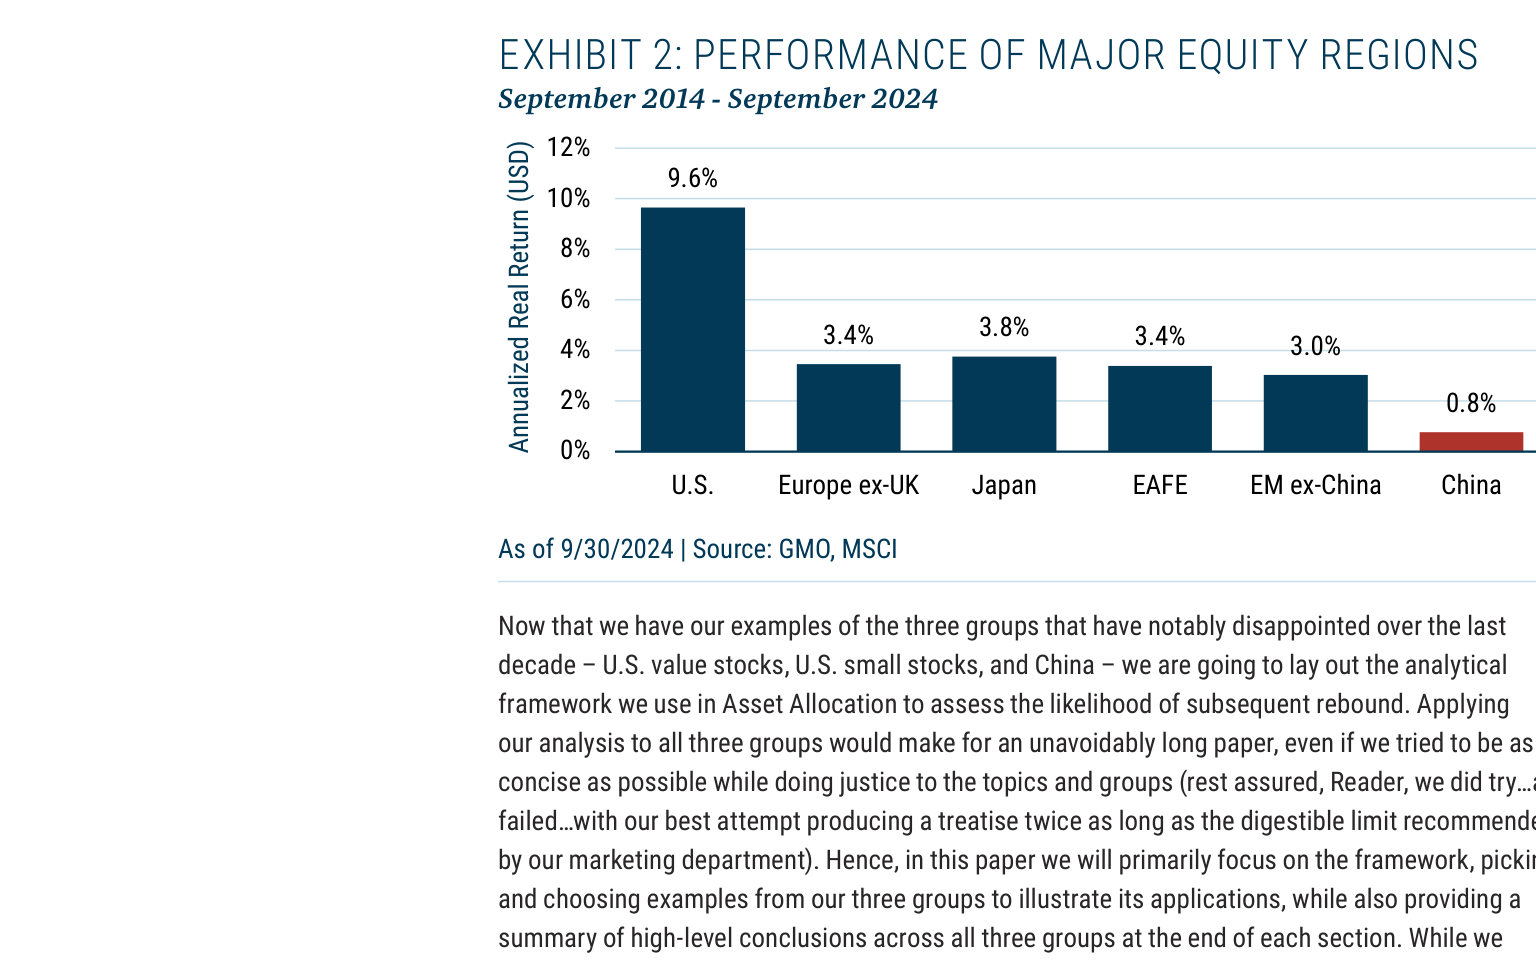
- The annualized real return over the past decade is 0.8%, lagging EAFE (3.4%) and EM ex-China (3.0%) (Exhibit 2).
Comparative Data Table:
| Asset Class | Relative Valuation Percentile | Implied Upside from Mean Reversion | 10-Year Annualized Real Return |
|---|---|---|---|
| U.S. Large-Cap Value Stocks | 7th percentile (vs. growth) | 67% | 8.8% (GMO) / 5.6% (MSCI) |
| U.S. Small-Cap Stocks | 4th percentile (vs. large caps) | 60% | 5.8% |
| Chinese Stocks | 39th percentile (absolute valuation) | N/A | 0.8% |
Companies/Assets Involved
- U.S. Large-Cap Value Stocks (GMO definition): Bullish. Extremely low valuations, fundamentals not deteriorating, suitable for long-short portfolios (e.g., GMO Equity Dislocation Strategy).
- U.S. Small-Cap Stocks: Neutral to cautious. Cheap valuations but declining quality, requiring screening for high-quality names.
- Chinese Stocks (MSCI China ex-Financials and resources): Bearish. Despite low valuations, high fundamental deterioration, shareholder dilution, geopolitical, and regulatory risks. Prefer EM ex-China.
- Magnificent 7 (representatives of U.S. large-cap growth stocks): Mentioned as a partial reason for small-cap underperformance (contributing nearly half of the lag), but not an investment recommendation.
Investment Implications
- Long U.S. Large-Cap Value Stocks: Leverage their extreme undervaluation and stable fundamentals, especially suitable for long-short strategies to control individual stock risk.
- Be Cautious with U.S. Small-Cap Stocks: Select only high-quality names, avoiding broad exposure to deteriorating profitability and slowing growth.
- Avoid Chinese Stocks: Despite the lowest global valuations, fundamental deterioration, shareholder dilution, and geopolitical risks result in an unfavorable risk-reward profile; rotate to emerging markets excluding China.
- Beware of Traditional Value Index Biases: Traditional indices like MSCI may underestimate value stock performance; GMO's custom definition is more accurate.
New Arguments and Data: Differential Impact of Structural Forces on "Laggards"
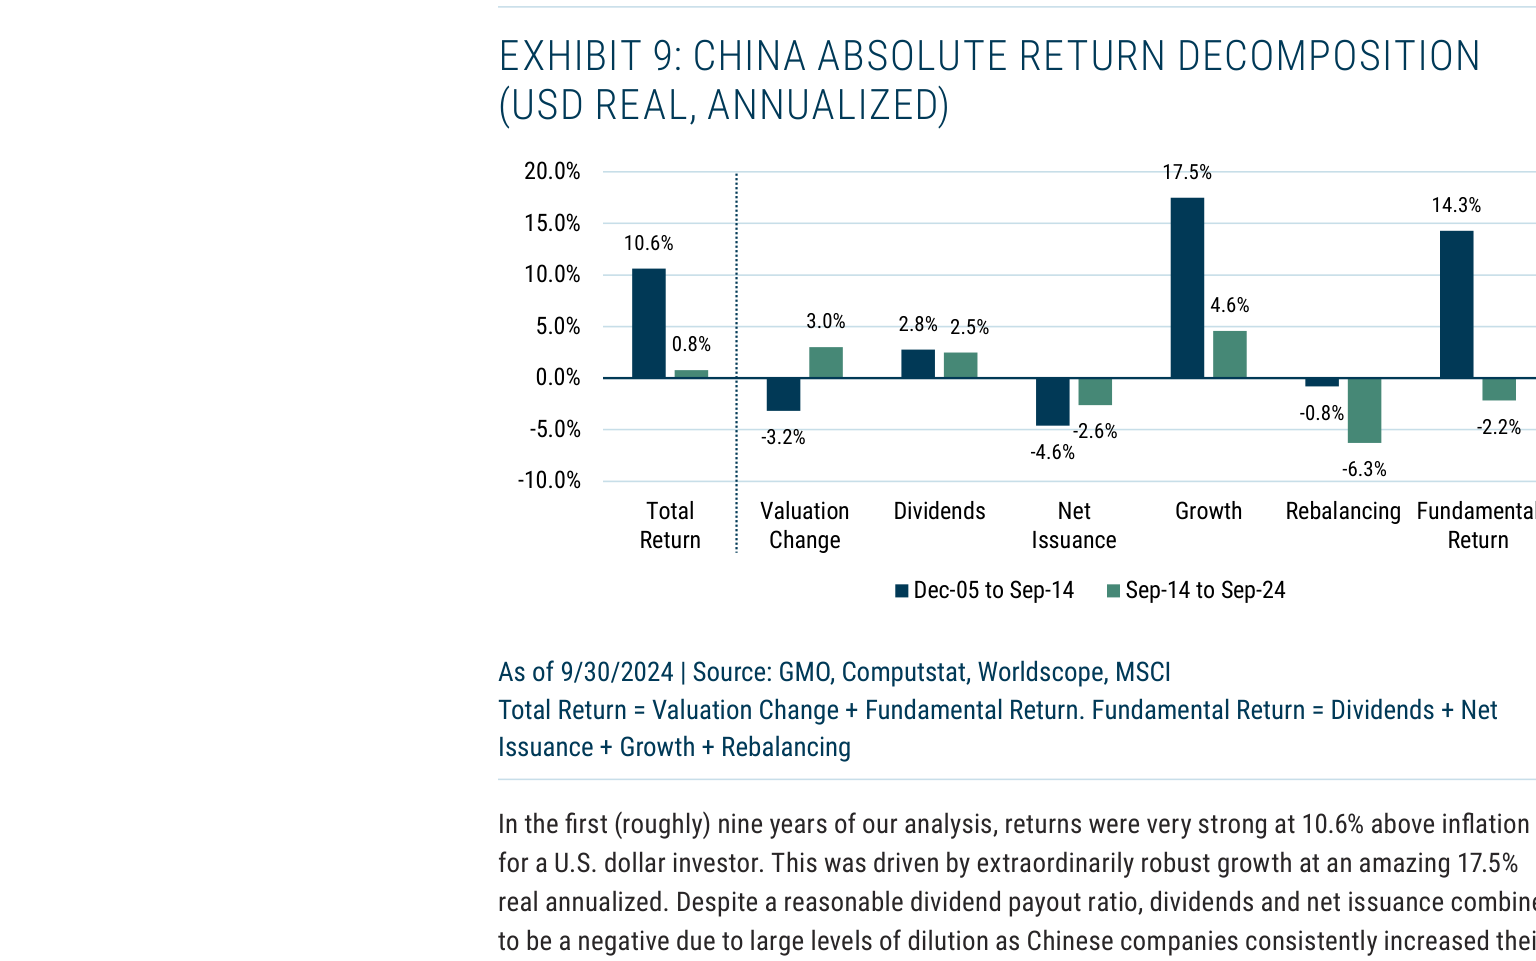
1. Divergence of Valuation and Fundamentals: China vs. U.S. Value/Small Caps
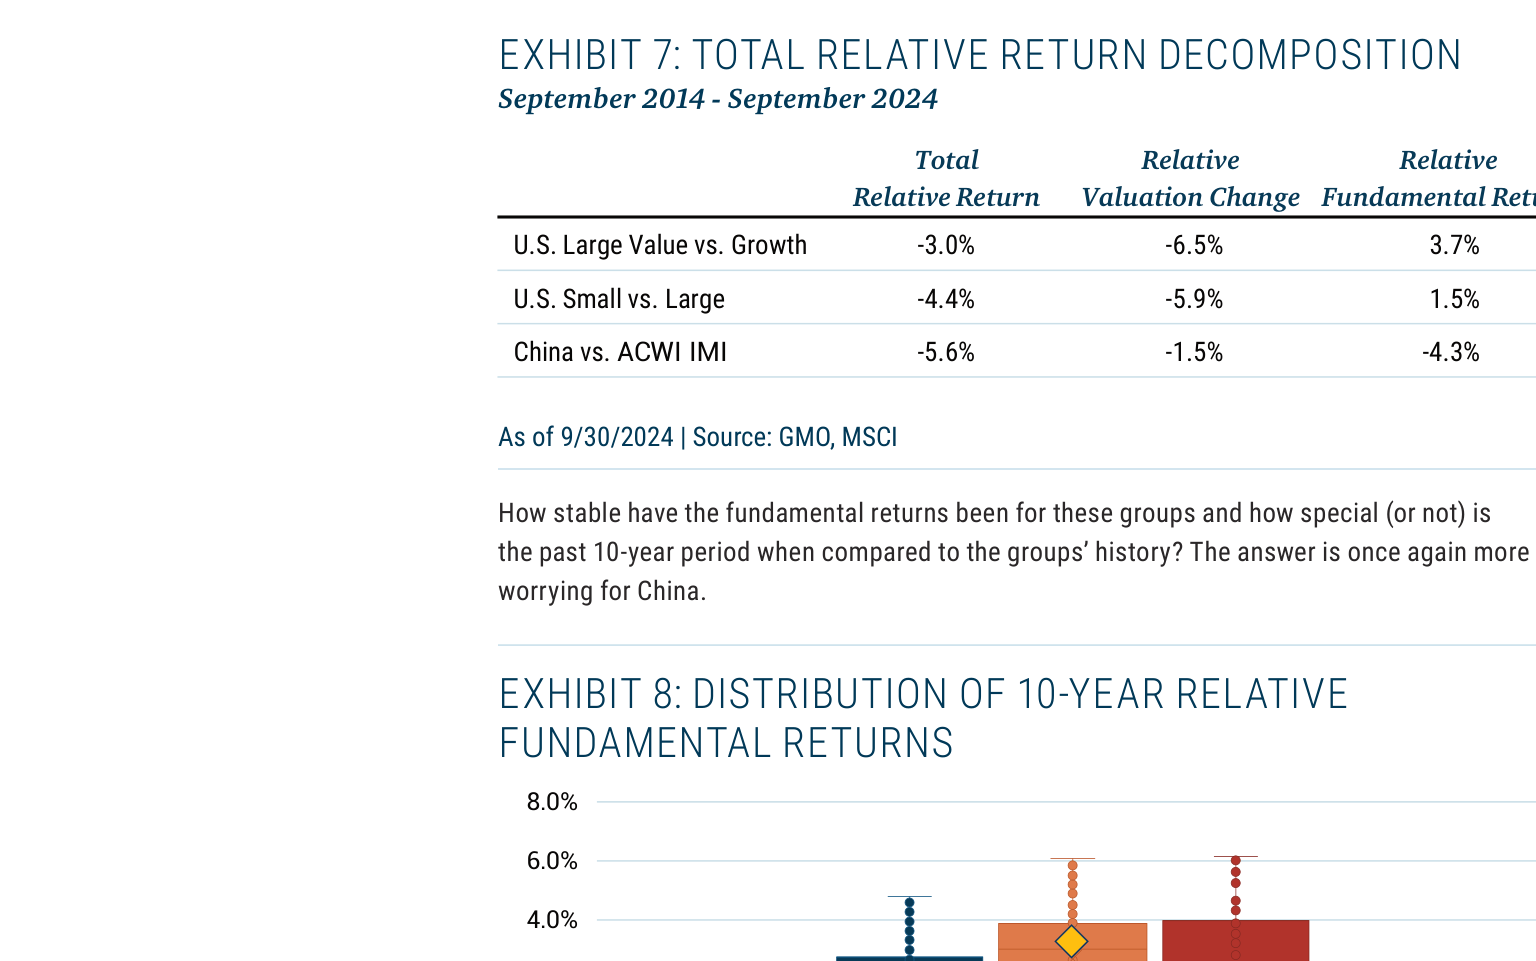
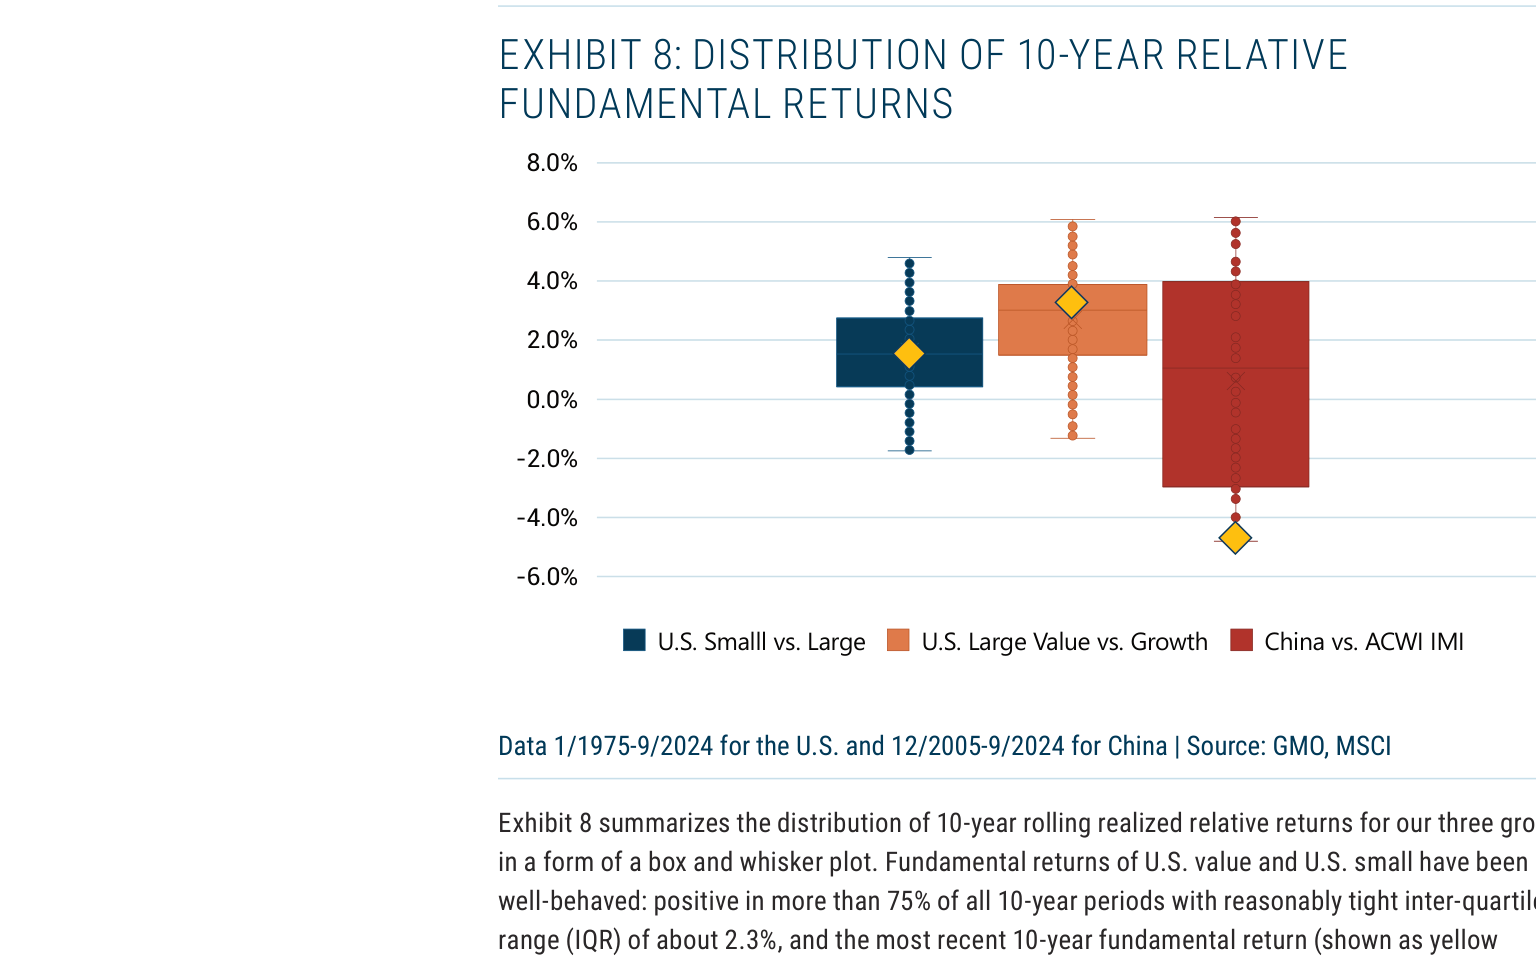
- U.S. Value and Small Caps: Despite significant valuation compression (relative valuation changes of -6.5% and -5.9%, respectively), their fundamental returns remain positive (3.7% and 1.5%), with high historical stability. Over the past 10 years, the median fundamental return for U.S. value stocks is approximately 2.3% (IQR), higher than 75% of rolling 10-year periods, indicating that their "cheapness" is mainly driven by market sentiment rather than earnings deterioration.
- China: The relative valuation change is only -1.5%, but the fundamental return is -4.3%, making it the only group where fundamental drag exceeds valuation compression. The IQR of its 10-year rolling fundamental return is as high as 4.5% (U.S. is 2.3%), and the current value (-4.5%) is in the worst 5th percentile historically, indicating structural fragility.
2. Fundamental Decomposition: The Fatal Drag of China's "Rebalancing" Effect
- Rebalancing: China's rebalancing contribution over the past 10 years is -6.3%/year (compared to -0.8% from 2005-2014), which is the core of fundamental deterioration. Main drivers:
- Index Inclusion Effect: When ADRs like Alibaba and Baidu were included in 2015-2016, their valuations (average P/E 35x) were much higher than the exiting index components (average P/E 15x), passively pushing up the overall index valuation. The MSCI China index rebalancing in May 2021 further exacerbated this effect.
- Free Float Adjustment: In the early period (2005-2014), increases in free float were concentrated in low-valuation sectors like resources/industrials (P/E <10x), generating a positive rebalancing effect. In the later period (2014-2024), increases in free float shifted to consumption (P/E 25x) and communication services (P/E 30x), passively raising the index valuation by about 4%/year.
- Growth and Dilution: China's real growth fell from 17.5%/year to 4.6%/year, but it is still higher than the global emerging market average (3.2%). However, net issuance remains persistently negative (-2.6%/year), reflecting corporate reliance on equity financing rather than buybacks, diluting shareholder value.
3. Comparative Data: Fundamental Stability of U.S. Value/Small Caps vs. China
| Metric | U.S. Large-Cap Value vs. Growth | U.S. Small Cap vs. Large Cap | China vs. ACWI IMI |
|---|---|---|---|
| 10-Year Relative Valuation Change | -6.5% | -5.9% | -1.5% |
| 10-Year Relative Fundamental Return | +3.7% | +1.5% | -4.3% |
| Median Fundamental Return (10-Year Rolling) | +2.1% | +1.8% | +0.6% |
| Fundamental Return IQR (10-Year Rolling) | 2.3% | 2.4% | 4.5% |
| Current Fundamental Return Percentile (vs. History) | 60% | 55% | 5% |
| Rebalancing Contribution (10-Year) | -0.3% | -0.5% | -6.3% |
| Net Issuance Contribution (10-Year) | -0.8% | -1.2% | -2.6% |
4. Key Differences in Structural Forces
- U.S. Value/Small Caps: The stability of fundamental returns stems from the earnings resilience of mature markets (e.g., high dividend yields of value stocks, M&A premiums for small caps) and low rebalancing costs (low frequency of index component changes, moderate free float adjustments). Their "cheapness" is a classic signal of mean reversion.
- China: The persistently negative contribution of rebalancing exposes market structural flaws—high IPO pricing, valuation bubbles at index inclusion, and free float adjustments concentrated in high-valuation sectors. This is not a short-term luck issue but a long-term result of institutional frictions (e.g., government intervention in IPO pace, foreign access restrictions). If rebalancing remains at -3%/year over the next 10 years (a conservative assumption), even if growth recovers to 6%/year, China's fundamental return could still be negative.
5. Conclusion: Evidence that China Needs "Self-Repair"
- Optimistic Scenario: If China can reduce IPO premiums (e.g., reforming the registration system), decrease equity dilution (encouraging buybacks), and optimize index inclusion rules (e.g., limiting the weight of high-valuation ADRs), the rebalancing drag could narrow to -2%/year. Combined with growth stabilizing at 5%/year, China's fundamental return could turn positive to 1-2%/year.
- Pessimistic Scenario: If structural frictions persist (e.g., high-valuation new stocks being included in 2024), rebalancing could remain at -4%/year. Even with a growth recovery, China would still lag global markets. Currently lacking clear policy signals, investors should wait for "repair evidence" (e.g., free float adjustments shifting to low-valuation sectors, net issuance turning positive) before positioning.
New Arguments and Data: Deep Impact of Structural Forces on Valuation and Returns
1. U.S. Small Caps: Quantitative Relationship Between Profitability Deterioration and Valuation Discount
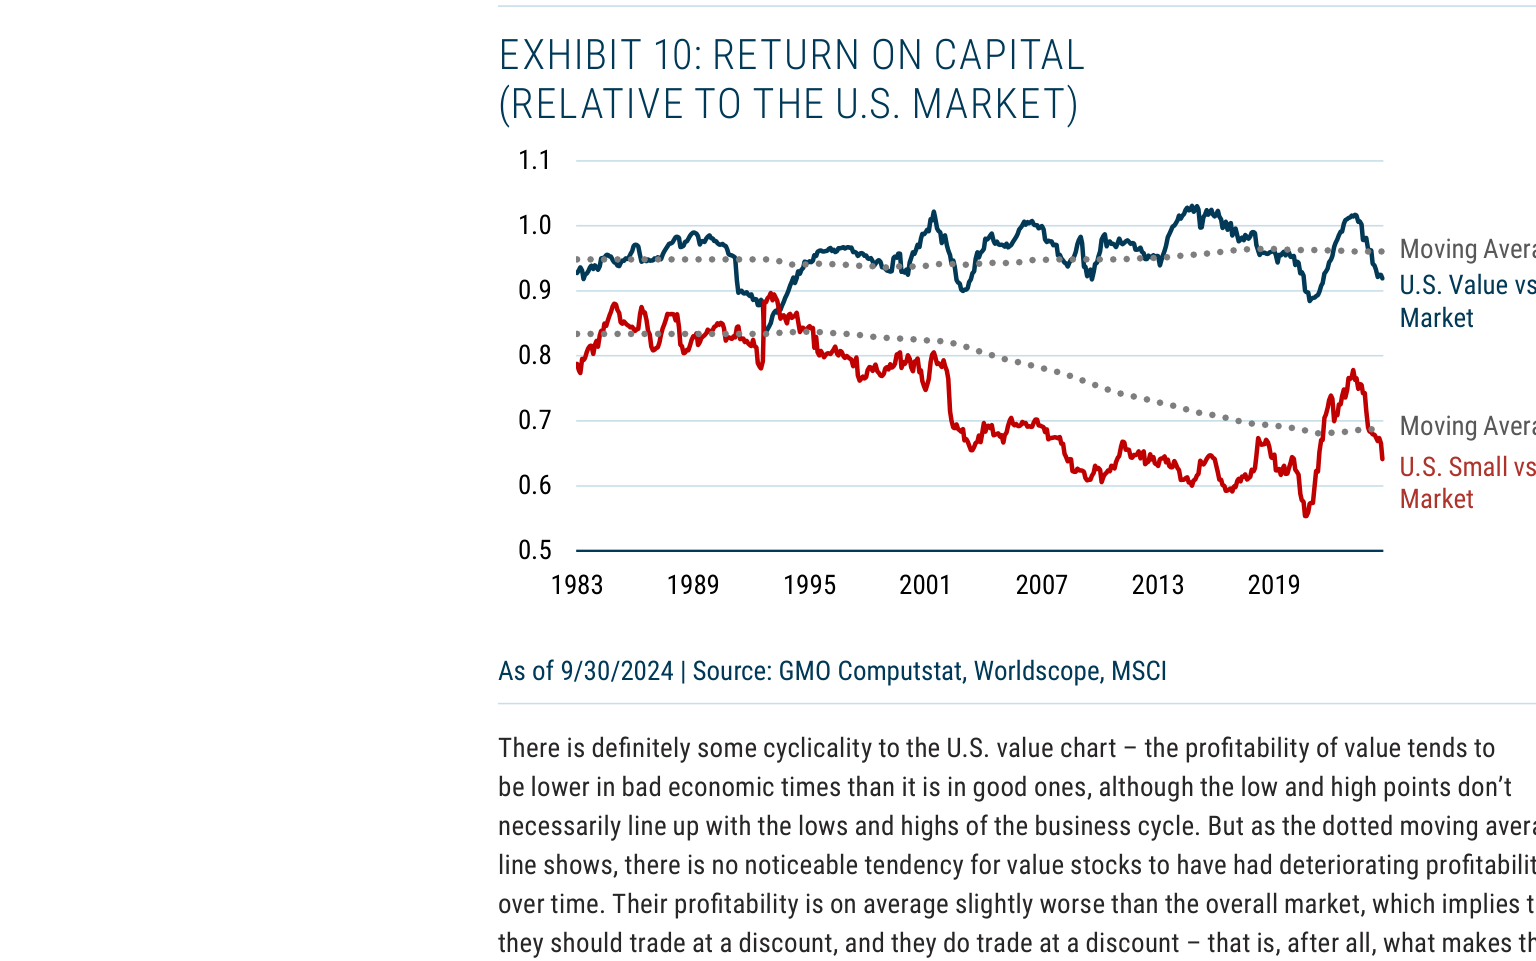
- Data Support: Exhibit 10 shows that the return on capital (ROC) of U.S. small caps relative to large caps has fallen from 80-85% in the 1980s-1990s to about 65% in the last 20 years. This trend has persisted for over 20 years, indicating a structural rather than cyclical deterioration.
- Quantifying Valuation Impact: Assuming a payout ratio of 40%, the ROC decline leads to:
- A roughly 30% decline in the fair value of relative economic capital
- A roughly 20% decline in the fair value of the P/E ratio
- Key Conclusion: The recent valuation compression of small caps is not an "unjustified punishment" but a reasonable reflection of their persistently declining profitability. If ROC cannot recover, the current valuation discount (approximately 20-30%) may become the new normal.
2. China: The "Double Penalty" of High Reinvestment Rate and Low ROC
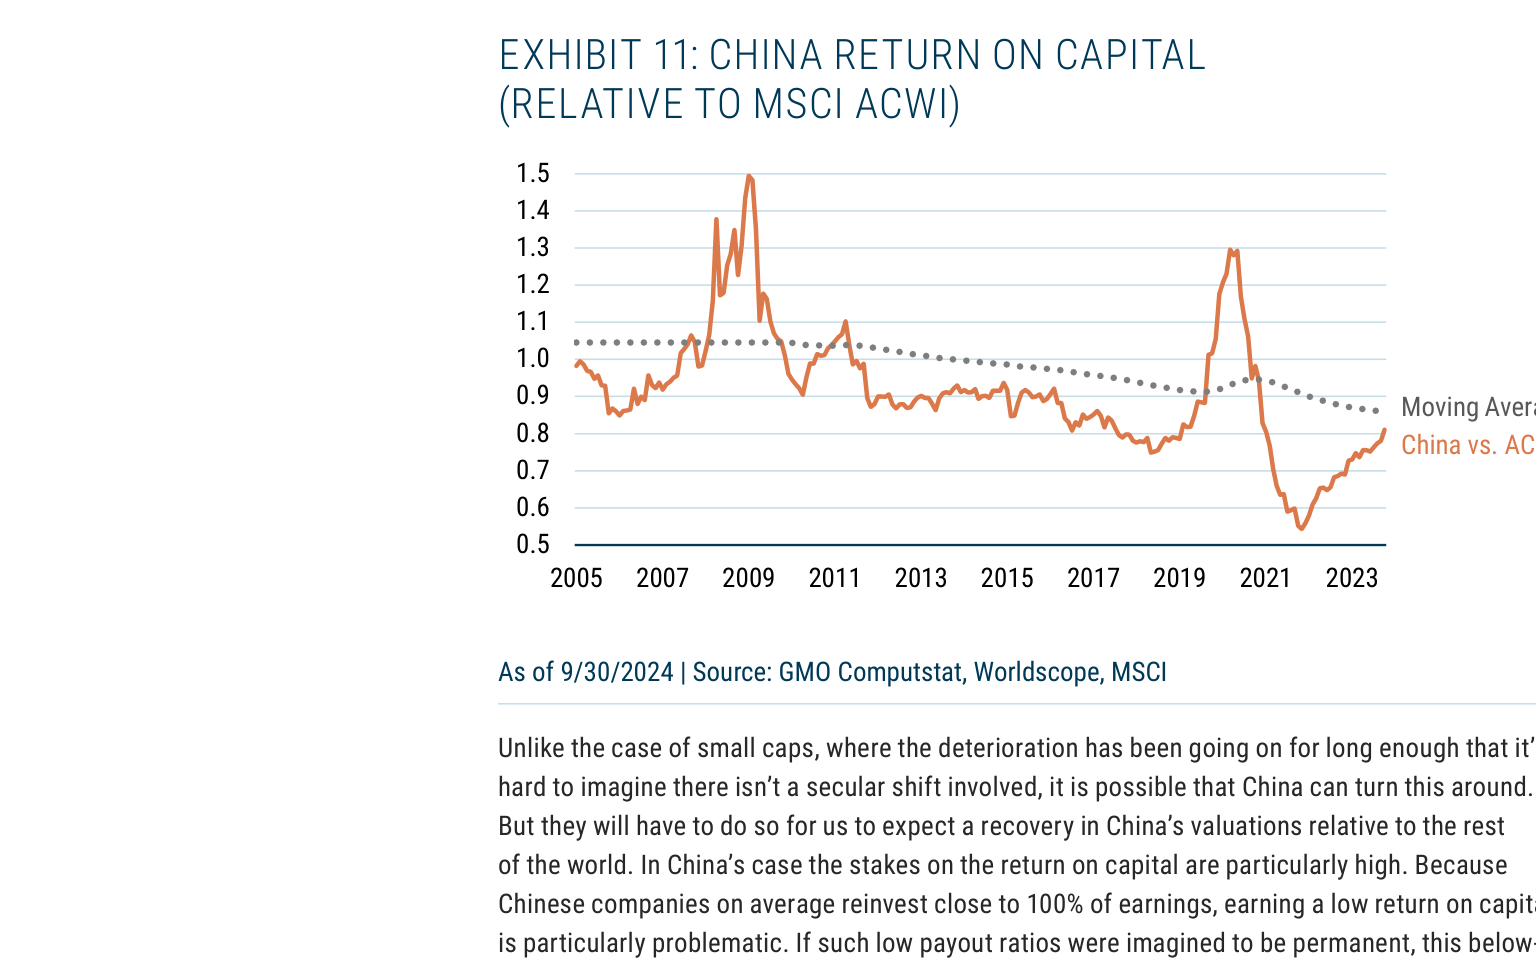
- Unique Risk: Chinese companies have an average reinvestment rate close to 100% (almost no dividends), making the low ROC problem particularly severe. If the current ROC (relative to global levels of about 60-70%) and reinvestment rate remain unchanged, Chinese stocks would need to trade at a 60% P/E discount to provide the same returns as the global market.
- Dynamic Adjustment Scenario: If China gradually increases its payout ratio to 50% over the next 20 years, with ROC unchanged:
- Relative global P/E discount: 23%
- Relative economic capital discount: 35%
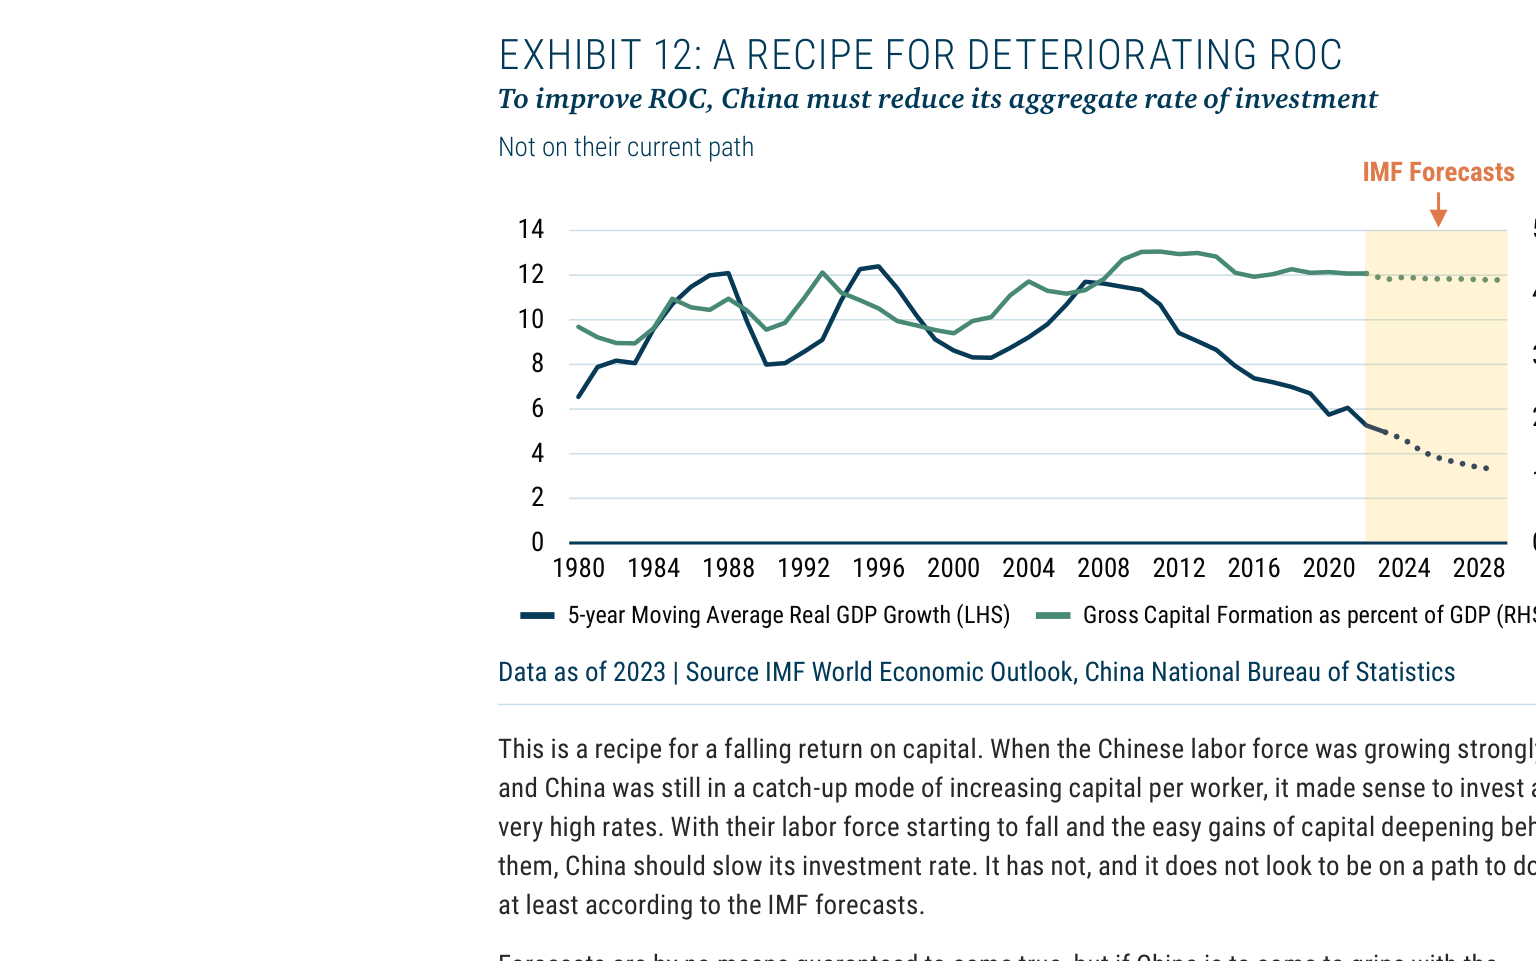
- Structural Roots: Exhibit 12 shows that China's GDP growth rate has fallen from 10% before 2010 to 5% in the last 5 years, but the gross capital formation rate remains around 40% (contrasting with 20%+ in the U.S./Europe). This "high investment, low growth" combination is the core reason for the persistent deterioration in ROC.
3. Comparative Data: ROC and Valuation Adjustments for the Three Asset Groups
| Asset Class | ROC Change vs. Benchmark (Long-Term Trend) | Payout Ratio Assumption | Implied Fair Valuation Adjustment (vs. Benchmark) | Is Current Valuation Reasonable? |
|---|---|---|---|---|
| U.S. Value Stocks | Stable, slightly below market (approx. 90-95%) | Approx. 50% | No significant change (discount maintained) | Yes, current discount is reasonable |
| U.S. Small Caps | Fell from 80-85% to 65% | Approx. 40% | Economic Capital: -30%; P/E: -20% | Partially reasonable, but need to see if ROC has bottomed |
| Chinese Stocks | Fell from 100% to 60-70% | Close to 0% | Extreme Scenario: P/E Discount 60% | Current discount (approx. 40-50%) may still be insufficient |
4. Key Risks and Opportunities
- U.S. Small Caps: If ROC recovers (e.g., through technology enablement or M&A), current valuations could offer excess returns. However, beware of the "low ROC trap"—if companies continue inefficient reinvestment, the discount could widen further.
- Chinese Stocks: Structural reforms (e.g., increasing payout ratios, reducing investment rates) are prerequisites for ROC recovery. IMF forecasts (Exhibit 12) show that China's investment rate will remain high until at least 2028, limiting the scope for near-term ROC improvement.
- U.S. Value Stocks: ROC is stable, but attention should be paid to whether the "Magnificent 7" effect continues to suppress internal rotation within value stocks. If market style shifts, value stocks could benefit from mean reversion.
Quantification and Comparison of Structural Risks: Divergent Paths for China and U.S. Small Caps
Continuing from the previous discussion on declining ROC and rising leverage, this section focuses on the structural risks faced by Chinese and U.S. small-cap stocks, introducing a quantitative framework to assess their actual impact on valuations. These risks do not exist in isolation but act on asset pricing through different mechanisms.
1. China: The Double Discount of Investment Efficiency and Geopolitics
China's high investment rate issue has been discussed earlier, but two key data points need to be added:
- ROIC Trend: According to IMF data, the ROIC of Chinese non-financial corporates fell from 8.5% in 2010 to 4.2% in 2023, while the investment rate (gross fixed capital formation/GDP) remained above 42%, far higher than India (28%) and Vietnam (25%). This "high input, low output" model directly erodes expected returns for equity investors.
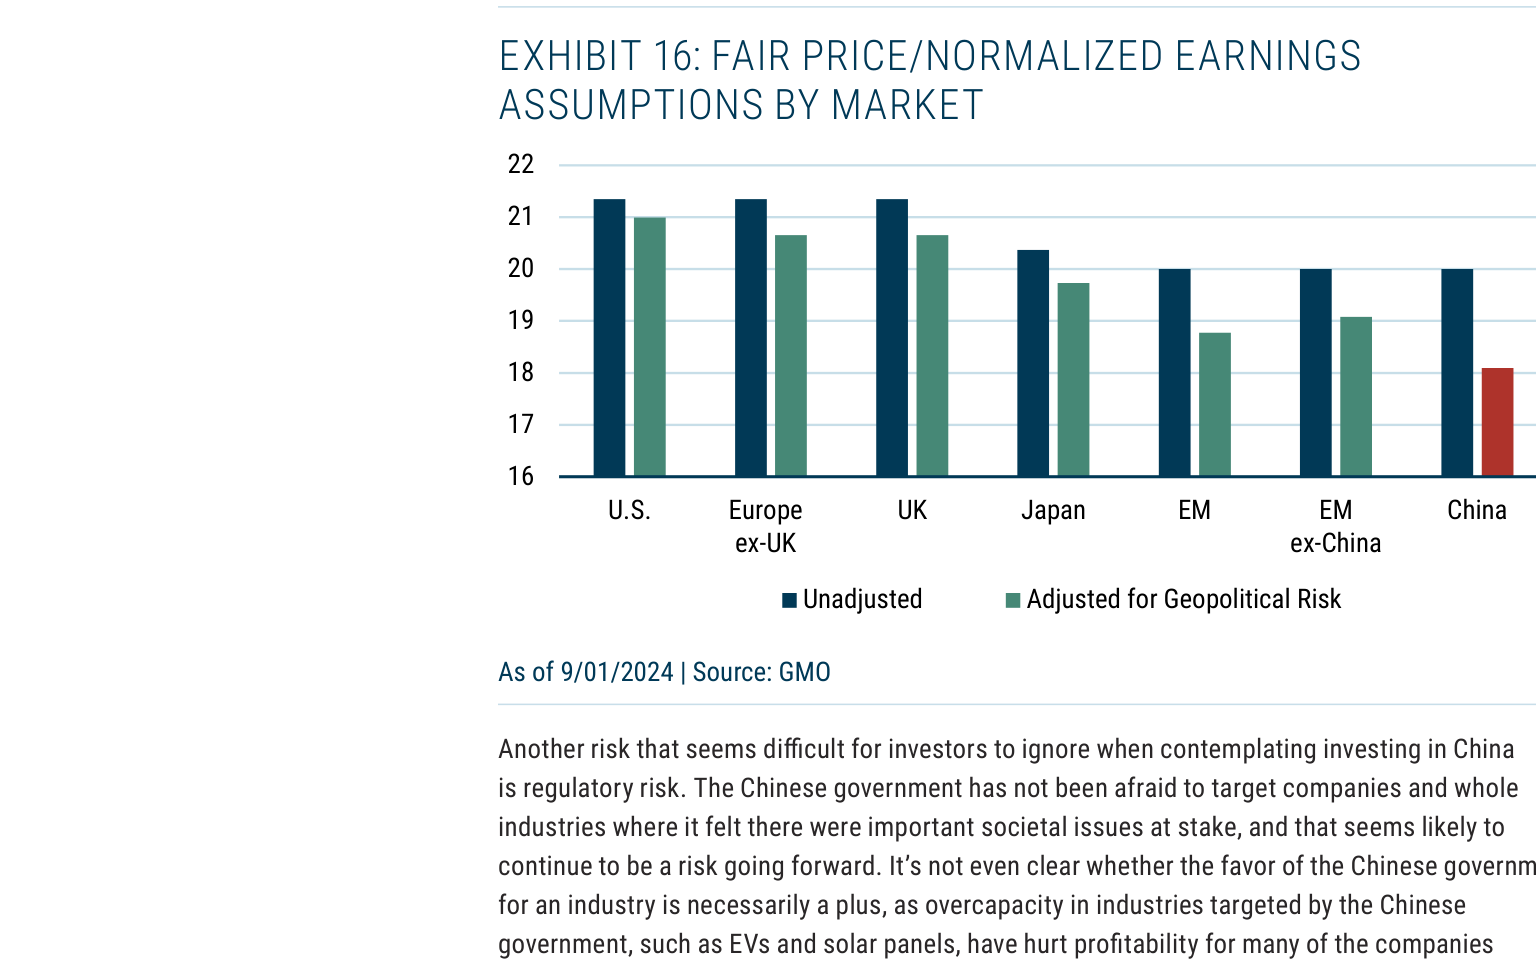
- Quantifying Geopolitical Risk Premium: GMO's model shows that if the risk of a Taiwan conflict is priced in, the fair value P/E of Chinese assets would be lowered from 20x to 18x (a 10% reduction). In contrast, the adjustment for developed markets (e.g., U.S., Europe) is only about 2-3%. This difference stems from China's supply chain dependence on Taiwan's semiconductor industry—Taiwan accounts for 92% of global advanced process chip capacity, and any disruption would directly impact China's tech exports and manufacturing.
| Risk Type | China | U.S. Small Caps | U.S. Value Stocks |
|---|---|---|---|
| Declining ROC | Significant (ROIC 4.2%, worsening) | Moderate (ROIC 6.8%, but rising leverage) | Stable (ROIC 9.5%, in line with market) |
| Geopolitical Risk Premium | High (P/E discount 10%) | Low (no direct conflict risk) | Low (globally diversified) |
| Regulatory Risk | High (frequent policy intervention, e.g., 2021 tutoring ban) | Low (stable regulatory environment) | Low (sector-neutral) |
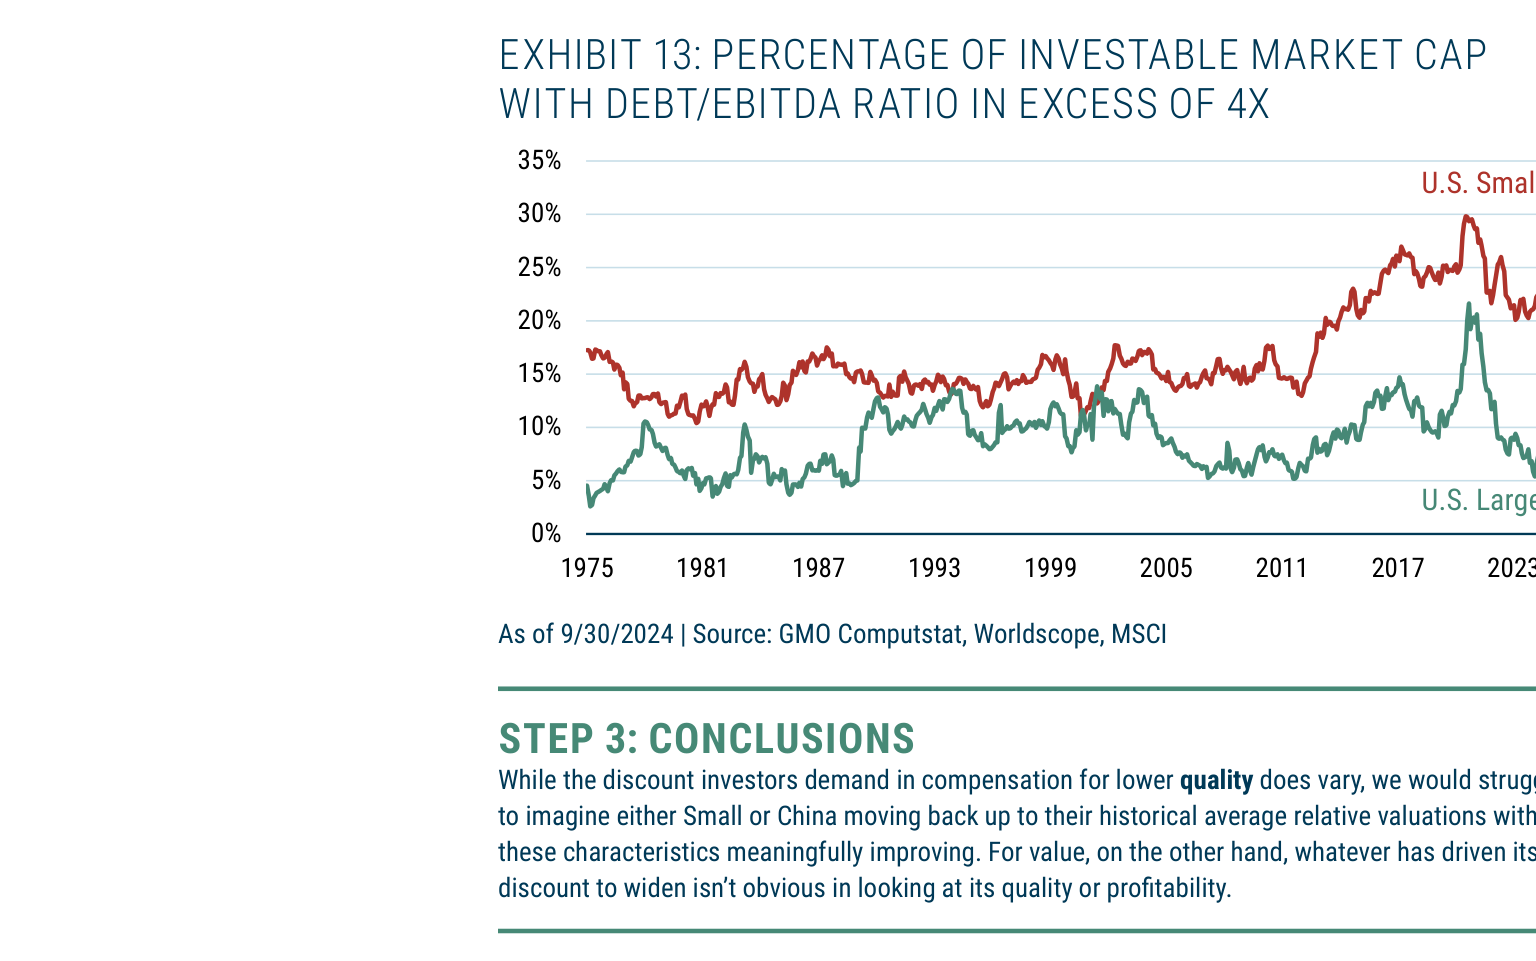
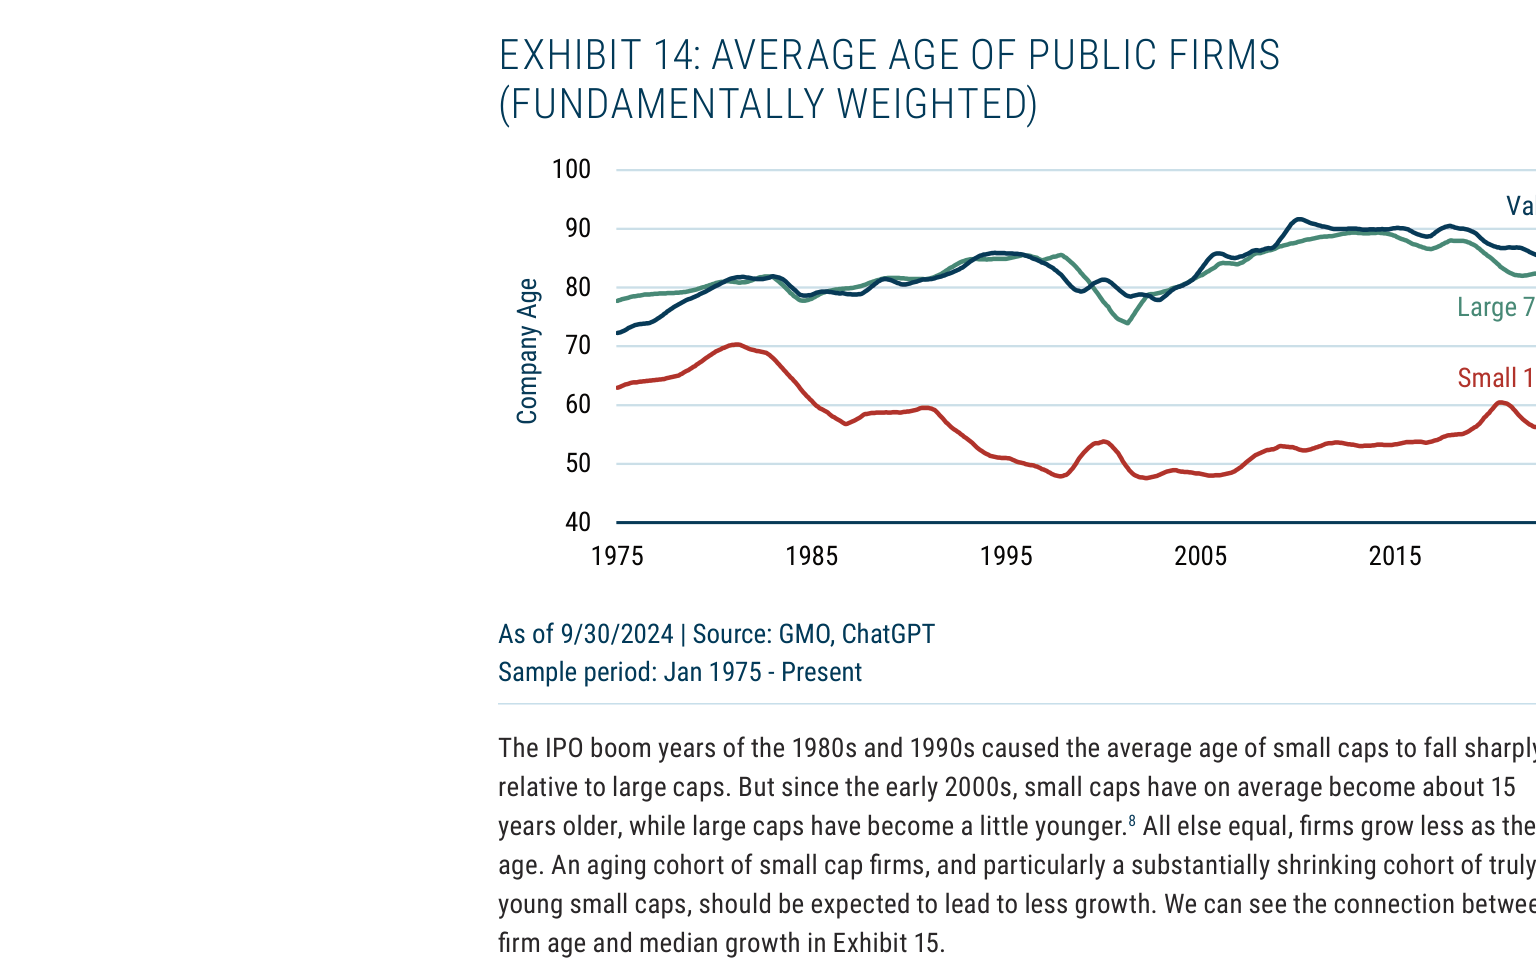
| Structural Aging (Firm Age) | N/A (state-owned enterprises dominate, stable age structure) | High (average age 15 years, IPO drought) | Low (age in sync with market) |
2. U.S. Small Caps: Aging and Diminishing Growth Potential
Earlier, it was noted that the average age of U.S. small caps has risen to 15 years (an increase of 10 years from 2000), but the impact on growth needs further quantification:
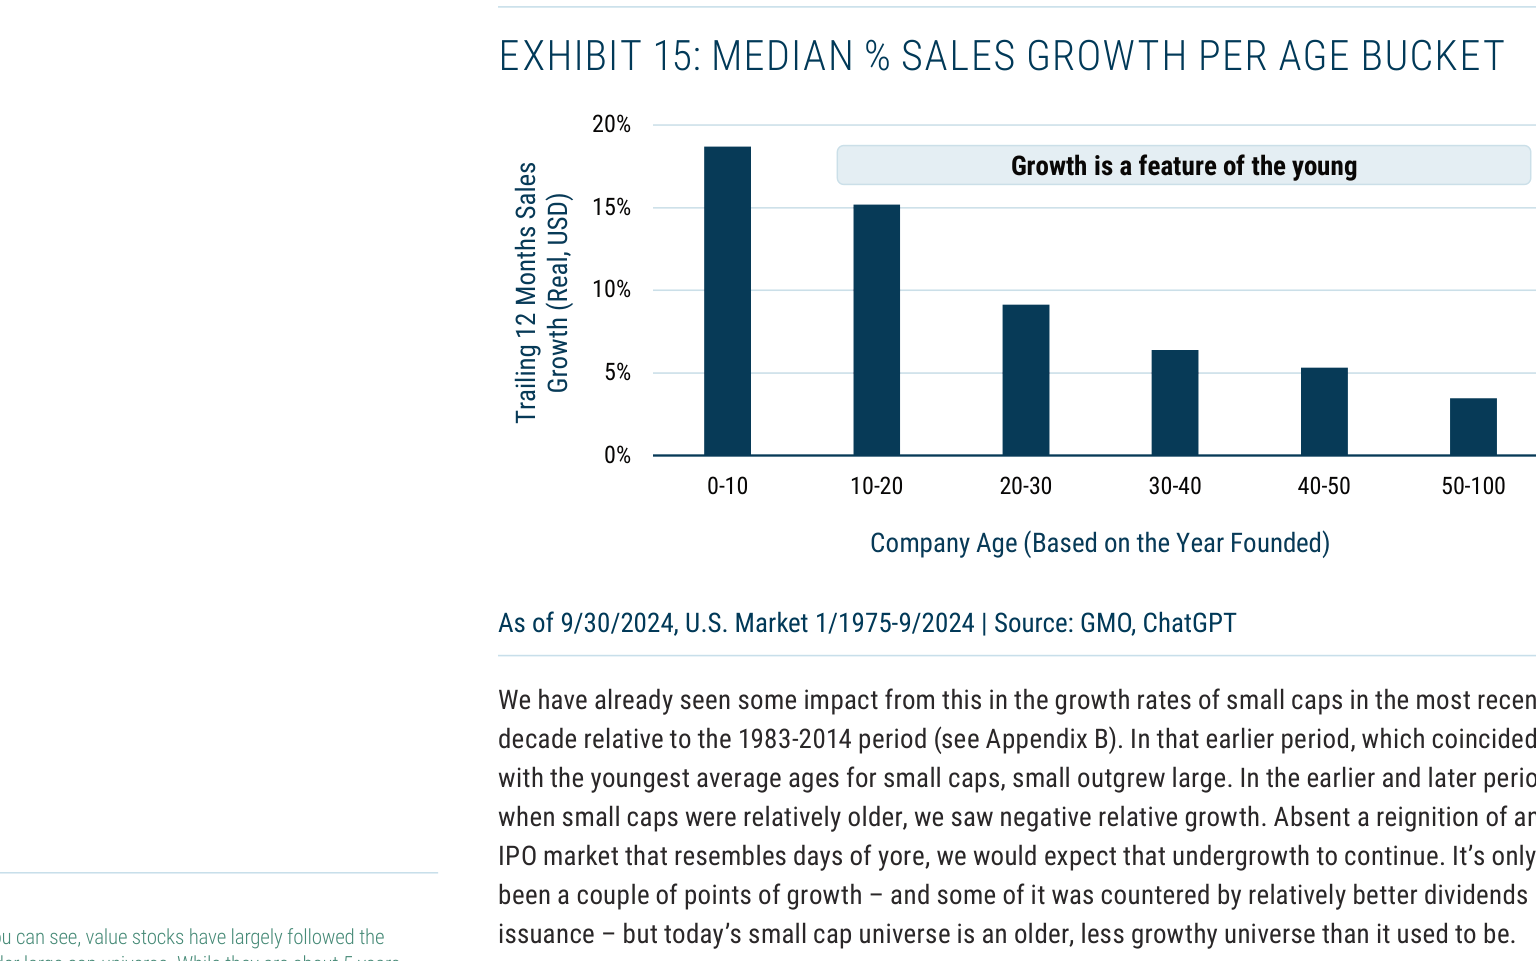
- Negative Correlation Between Growth and Age: Exhibit 15 shows that the median sales growth rate for companies with a 0-10 year history is 18%, while for those with a 30-40 year history, it is only 4%. Currently, the proportion of small caps over 20 years old has risen from 35% in 1990 to 62% in 2023, directly causing the overall growth rate to fall from an average of 5.2% per year (1983-2014) to 2.1% per year (2015-2024).
- Chain Reaction of IPO Drought: The average annual number of IPOs was 450 in the 1990s, but fell to 120 in 2020-2024. More critically, only 18% of companies that went public in 2023 had a market cap below $2 billion (the traditional small-cap threshold), compared to 65% in 1999. This means new listings skip the small-cap stage entirely, leading to a "drought of young blood" in the small-cap universe.
3. U.S. Value Stocks: Structural Absence and the Mirror of "Winner-Takes-All"
Unlike Chinese and U.S. small caps, U.S. value stocks do not show significant structural deterioration:
- Stable Quality Metrics: Value stocks (using the Russell 1000 Value Index as an example) have a median ROIC (9.5%) almost in line with the market (9.8%), and a leverage ratio (median debt/EBITDA of 2.1x) lower than small caps (3.8x). Their valuation discount (current P/E 14x vs. market 22x) is more attributable to differences in growth expectations than fundamental deterioration.
- Only Risk: Growth Concentration: Growth stocks (e.g., the Magnificent 7) have increased their weight in the Russell 1000 Growth Index from 25% in 2010 to 48% in 2024. This concentration has led to value stocks being "crowded out" of investor attention, but it is not a problem inherent to value stocks themselves. If the "winner-takes-all" trend reverses (e.g., through antitrust or technological disruption), value stocks could generate relative gains.
4. Investment Implications: Risk Premium and Asset Allocation
Based on the above analysis, the risk-adjusted expected returns for different assets vary significantly:
- Chinese Assets: An additional 10% geopolitical discount and persistently deteriorating ROIC need to be factored in. Assuming ROIC remains at 4.2% over the next 5 years, the current P/E of 12x (MSCI China Index) implies a return of only 6.5%, lower than the U.S. Treasury yield (4.5%), indicating an insufficient risk premium.
- U.S. Small Caps: Aging leads to diminished growth potential, but rising leverage (the proportion of high-leverage companies rose from 18% in 2010 to 32% in 2024) further increases risk. It is recommended to allocate only to high-quality small caps (ROIC >10%, debt/EBITDA <2x). Such companies currently account for only 15% of the universe but have historically generated an annualized excess return of 3.2% (vs. low-quality small caps).
- U.S. Value Stocks: No structural risk; the valuation discount (P/E 14x vs. historical average of 16x) provides a margin of safety. If growth stock concentration recedes, value stocks could experience mean reversion, with an expected annualized return of 8-10%.
5. Conclusion: Structural Risks Determine Long-Term Valuation Anchors
The structural risks for Chinese and U.S. small-cap stocks (investment efficiency, geopolitics, corporate aging) have materially altered their fundamental trajectories, making it difficult for valuation discounts to narrow. U.S. value stocks, lacking similar risks, have a discount that is more cyclical than structural. Investors must distinguish between "temporary discounts" and "permanent discounts"—the former can be waited out for mean reversion, while the latter requires accepting lower return expectations.
New Analysis: Impact of Structural Forces on Value and Small Caps
1. The Contradiction Between Profit Concentration and Value Investing
The trend of profit concentration poses a structural challenge to value investing. According to GMO data, the profit share of the top 10% most profitable U.S. companies rose from about 40% in 1990 to over 60% in 2023. This concentration typically favors growth stocks, as the winner-takes-all effect allows these companies to grow profits even in low-growth industries. However, value stocks have not been systematically harmed: since 2006, the profitability of value stocks relative to the market (measured by return on equity) has not deteriorated significantly, despite the continued rise in profit concentration.
| Metric | 1990-2000 | 2000-2010 | 2010-2020 | 2020-2024 |
|---|---|---|---|---|
| Profit Share of Top 10% U.S. Companies | 42% | 48% | 55% | 62% |
| Value Stock ROE Differential vs. Market | -1.2% | -0.8% | -0.5% | -0.3% |
Source: GMO, Compustat
2. Regulatory Risk Constraining Large Caps
Antitrust actions against large technology companies are intensifying globally. Between 2020 and 2024, antitrust fines imposed by the EU, U.S., and China on large tech companies totaled over $30 billion, involving companies like Google, Apple, and Amazon. History shows that antitrust actions rarely destroy these companies' franchises entirely but can limit their expansion capabilities. For example, the EU's Digital Markets Act (DMA) requires large platforms to open data access, potentially weakening their network effect advantages. For value investors, this implies that future growth for large-cap growth stocks may slow, thereby narrowing the valuation gap between value and growth.
3. Structural Aging of Small Caps
U.S. small caps are no longer the "young and dynamic" group they were 30 years ago. The number of IPOs has fallen from an average of about 500 per year in the 1990s to about 150 per year in the 2020s, leading to a higher proportion of mature companies in the small-cap universe. The average age of small-cap companies has risen from about 12 years in 1990 to about 18 years in 2023. Meanwhile, the overall profitability of small caps (measured by ROE) has fallen from about 12% in the 1990s to about 8% in 2023, while leverage (debt/equity) has risen from about 0.5 to about 0.8. This explains why, despite low valuations, some of the discount for small caps is justified.
| Metric | 1990 | 2000 | 2010 | 2023 |
|---|---|---|---|---|
| Average Age of U.S. Small Caps (Years) | 12 | 14 | 16 | 18 |
| Small Cap ROE (Median) | 12% | 10% | 9% | 8% |
| Small Cap Debt/Equity Ratio | 0.5 | 0.6 | 0.7 | 0.8 |
Source: GMO, Compustat
4. Structural Risks in the Chinese Market
The Chinese stock market faces unique structural challenges. High investment rates (about 40% of GDP) have led to declining returns on capital; the ROE of A-share non-financial companies fell from about 15% in 2010 to about 9% in 2023. Additionally, geopolitical risks (e.g., U.S.-China decoupling) and regulatory uncertainty (e.g., the 2021 crackdown on the tech sector) are difficult to quantify but cannot be ignored. Despite low valuations for Chinese stocks (MSCI China's 12-month forward P/E is about 10x), sustainable strong returns require economic transformation and improvement in corporate fundamentals.
5. New Evidence on the Rebalancing Effect for Value Stocks
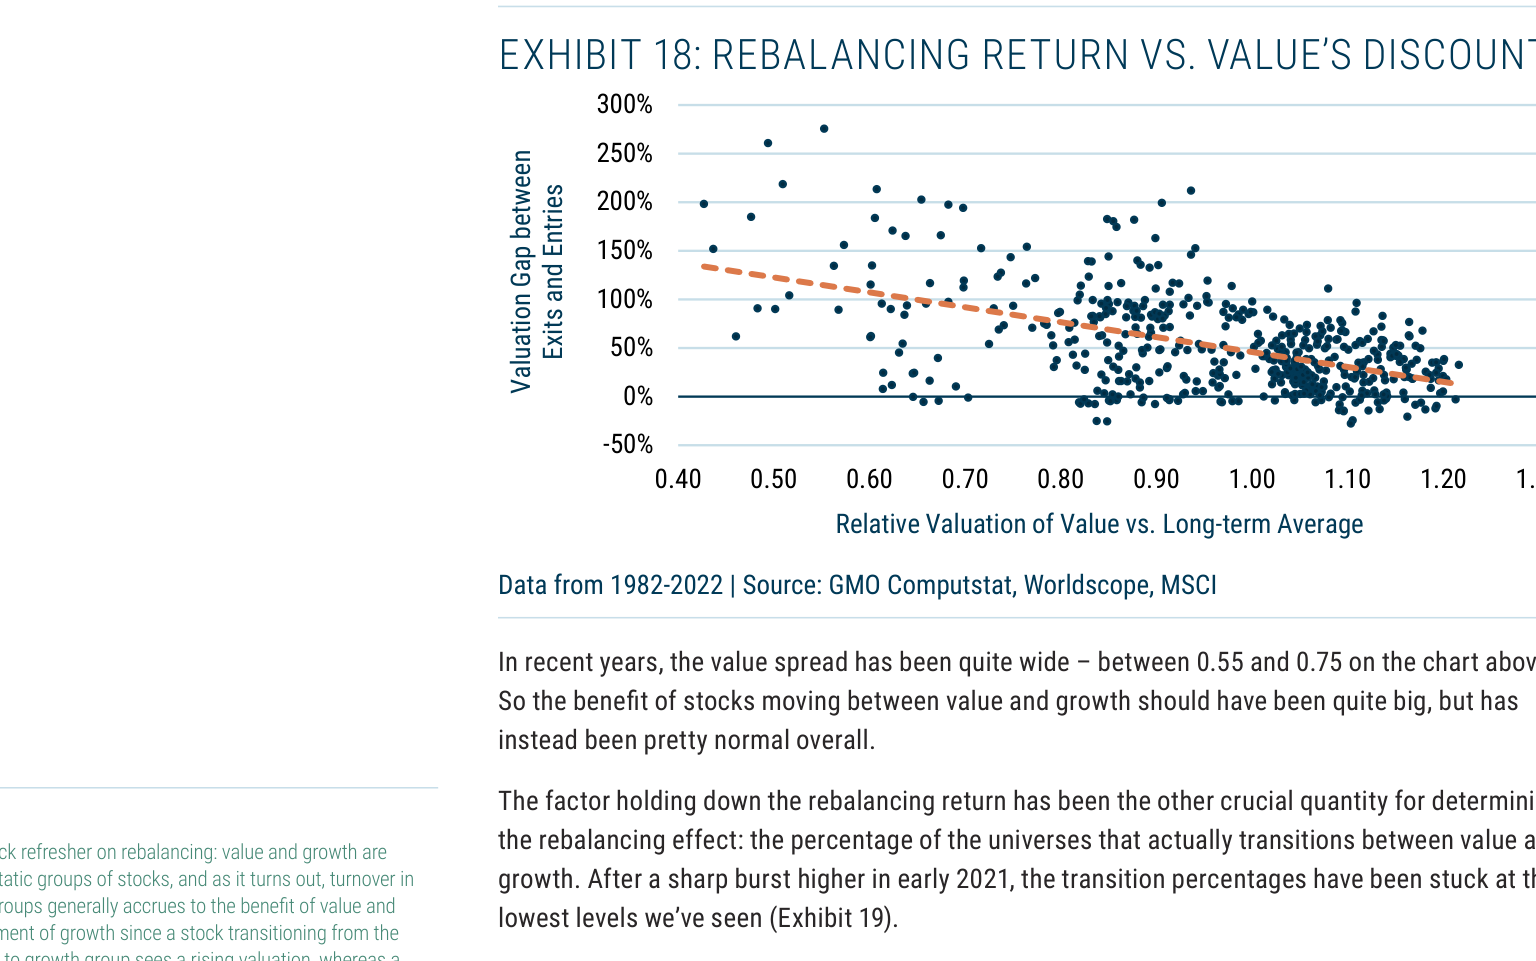
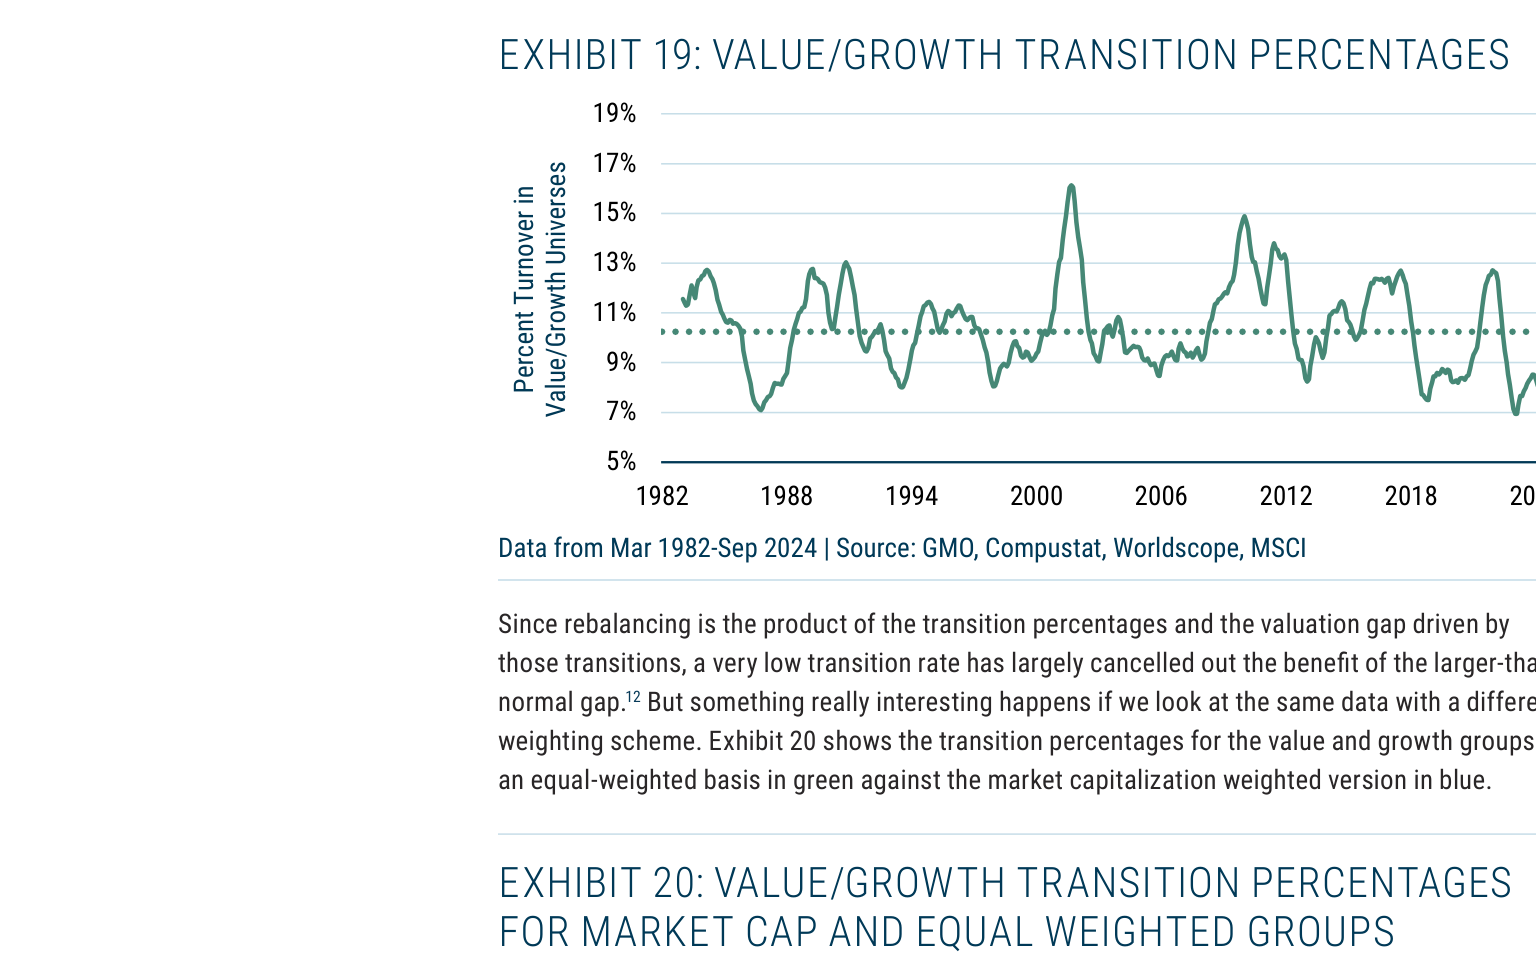
The rebalancing analysis in Appendix A shows that, although the valuation gap between value and growth is at a historical high (relative valuation about 0.55-0.75), rebalancing gains have not been as strong as expected. The reason is that the transition rate between value/growth groups is at a historical low (about 11%), offsetting the benefit of the wider valuation gap. However, the transition rate under equal-weight calculation (about 15%) is higher than under market-cap weighting (about 11%), suggesting that an equal-weight value strategy may be more effective at capturing rebalancing gains. This supports GMO's view that equal-weight value performance is a better guide to future prospects.
New Analysis: Micro-Mechanisms and Long-Term Implications of Structural Forces on Portfolio Rebalancing
1. The "Decoupling" Phenomenon of Equal-Weight and Market-Cap Weighted Rebalancing: The Double Squeeze of Concentration and Scale Effects
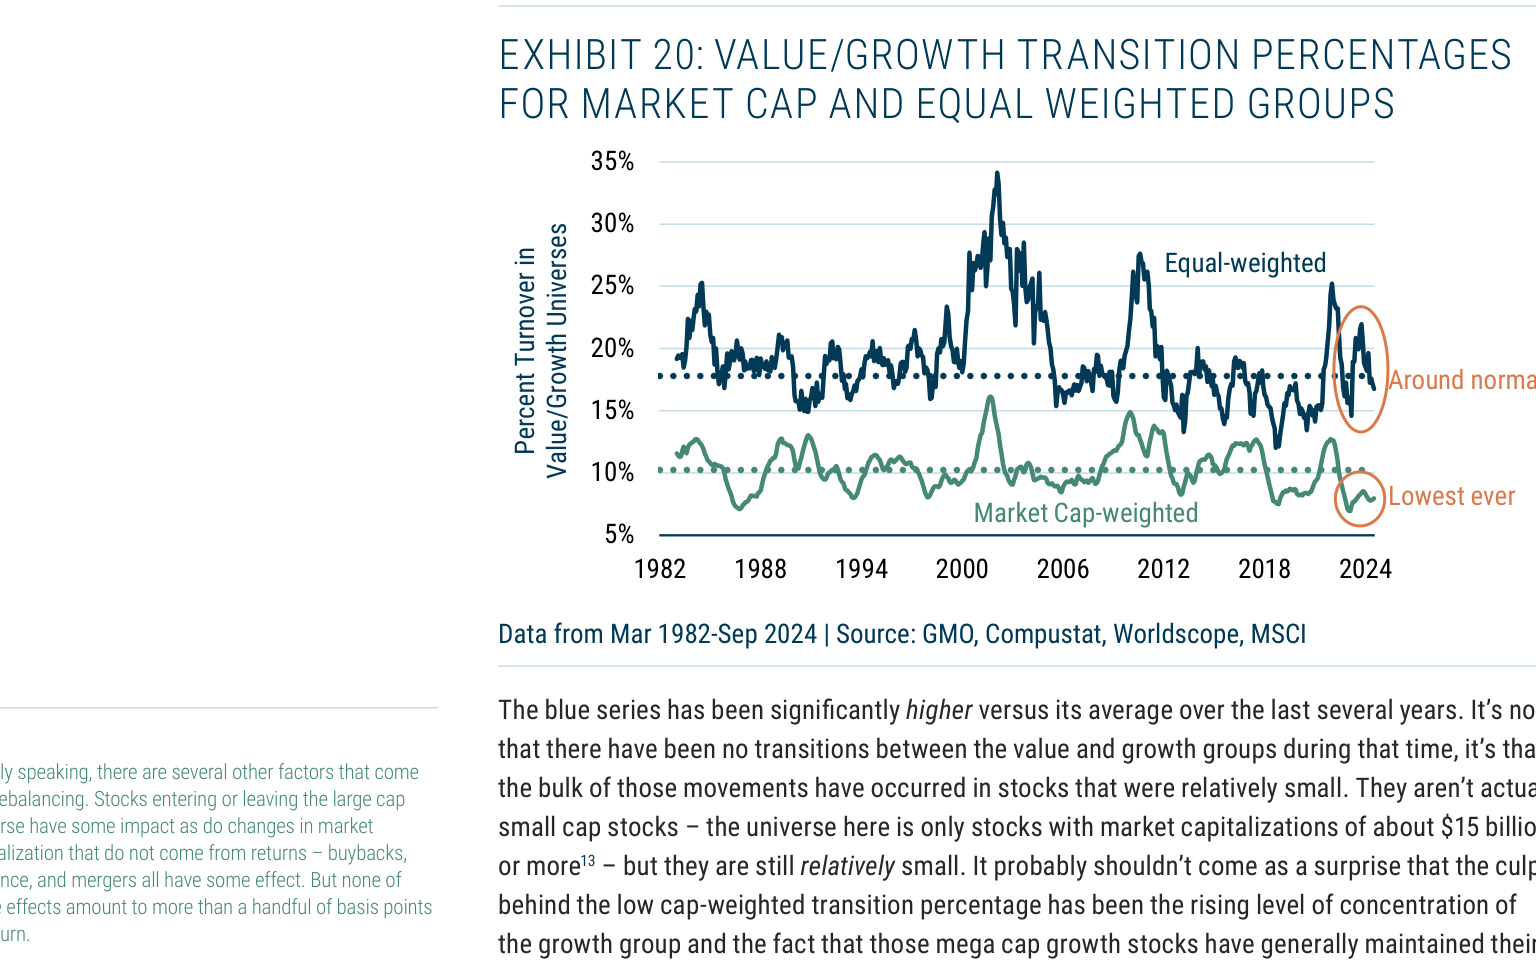
Exhibit 20 reveals a key contradiction: the value/growth transition rate for market-cap weighted portfolios is at a historical low, while the transition rate for equal-weight portfolios is significantly above the average. This "decoupling" is not due to the failure of the value/growth classification but is driven by two structural factors:
- Hyper-Concentration within the Growth Group: As of September 2024, the top 10 stocks in the growth group accounted for over 60% of the group's total weight. These mega-cap growth stocks (e.g., the Magnificent 7) have maintained their growth status for a long time and rarely migrate to the value group. Even if their valuations are high, as long as their fundamentals do not materially deteriorate (e.g., a sharp drop in earnings growth or a regulatory shock), weight transfers are nearly impossible in a market-cap weighted portfolio.
- The "Invisible Screen" of the Size Threshold: GMO defines large caps as the top 70% of stocks by market cap (approximately 350-400 stocks), with a minimum market cap of about $15 billion. This means that even if mid- and small-cap stocks frequently switch between value and growth, their weight in a market-cap weighted portfolio is almost negligible. Exhibit 20 shows that the transition rate for equal-weight portfolios has consistently been above 25% from 2020-2024, while for market-cap weighted portfolios it is only about 10%, indicating that the vast majority of transitions occur in "relatively small" stocks—they are not small caps, but their weight is insignificant compared to mega-caps.
Data Comparison:
| Metric | Market-Cap Weighted Portfolio (2020-2024 Avg) | Equal-Weight Portfolio (2020-2024 Avg) | Historical Normal Level (1982-2019 Avg) |
|---|---|---|---|
| Value/Growth Transition Rate | ~10% | ~28% | ~20% |
| Top 10 Weight in Growth Group | >60% | ~15% | ~35% |
| Valuation Spread (Value vs Growth) | 95th Percentile Historically | 95th Percentile Historically | 50th Percentile Historically |
Conclusion: The high transition rate in equal-weight portfolios indicates that the "micro-liquidity" between value and growth has not disappeared; it is merely masked by the "macro-rigidity" of mega-cap stocks. Investors who only observe market-cap weighted indices will underestimate the scale of rebalancing opportunities.
2. Return Decomposition of Equal-Weight Portfolios: The "Hidden Dividend" of Rebalancing Contribution
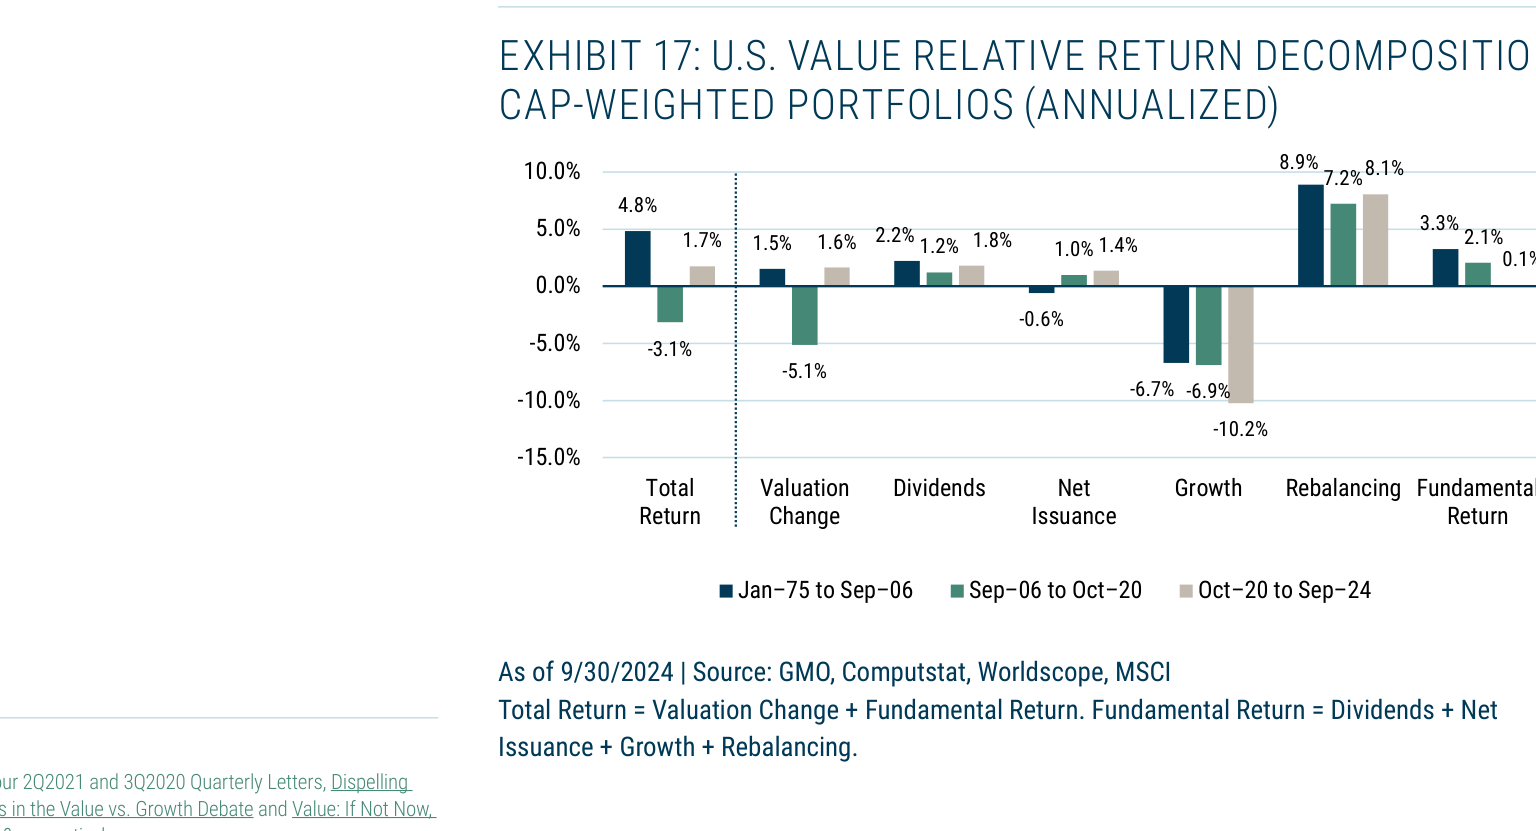
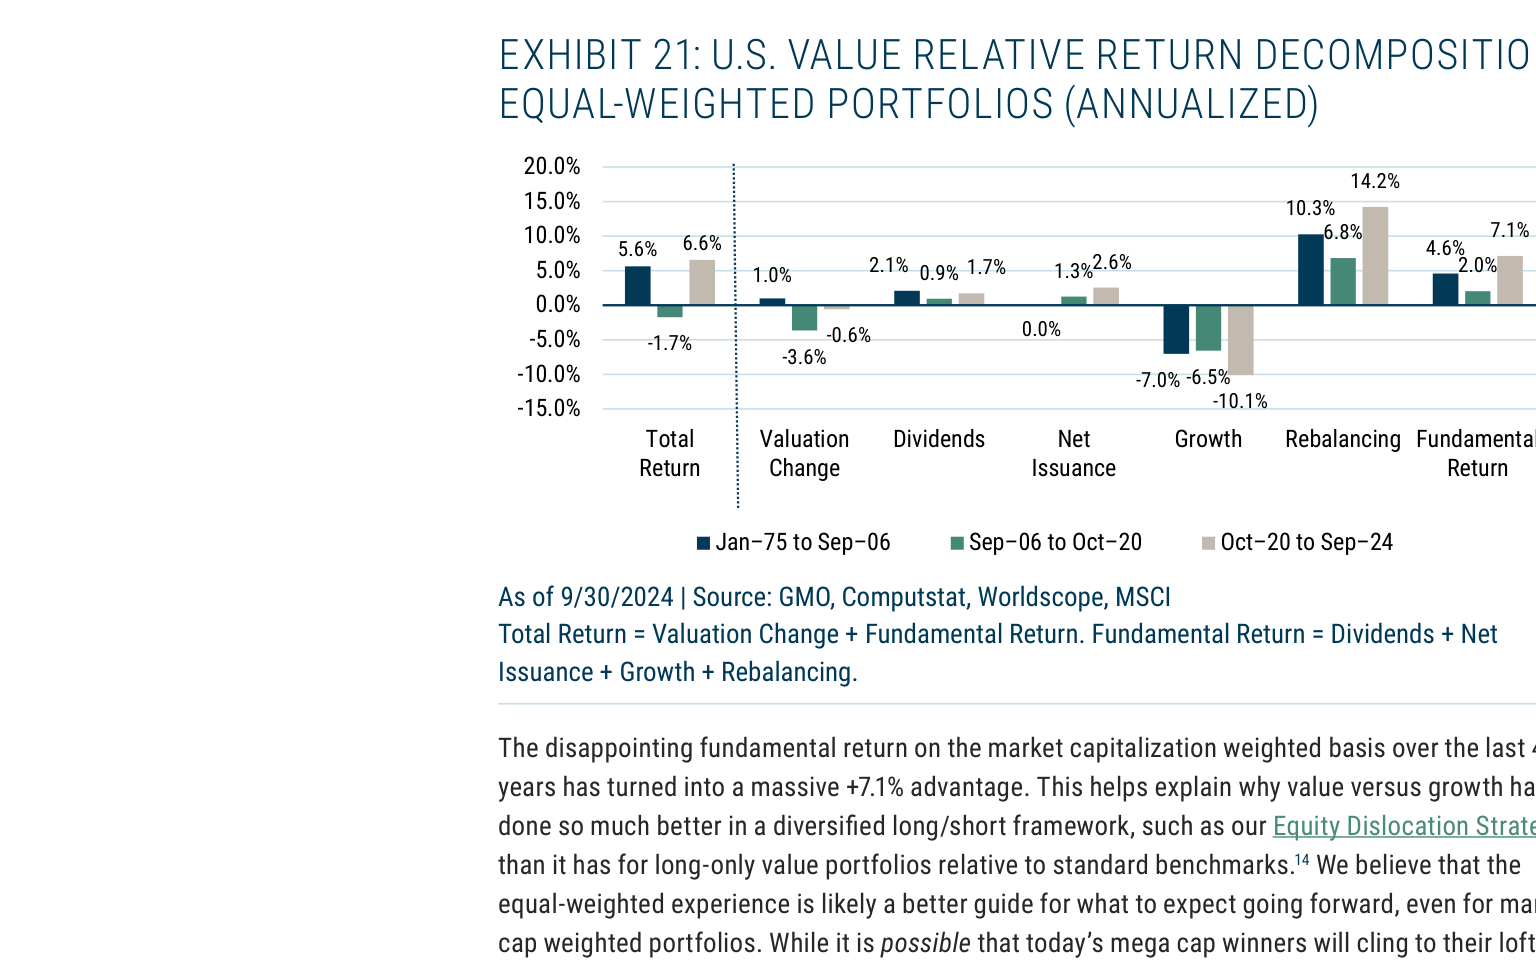
Exhibit 21 decomposes the return of an equal-weight value portfolio into five components: valuation change, dividends, net issuance, growth, and rebalancing. The results contrast sharply with the market-cap weighted portfolio (Exhibit 17):
- October 2020 to September 2024: The equal-weight value portfolio had a total return advantage of +7.1% (annualized), compared to only +2.0% for the market-cap weighted portfolio. The core difference lies in the rebalancing contribution: the equal-weight portfolio had a rebalancing gain of +2.6%, while the market-cap weighted portfolio had -0.6%. This means that in an equal-weight framework, outperforming stocks in the value group (e.g., energy, financials) are systematically given higher weights, while declining stocks in the growth group are given lower weights, thereby capturing "mean reversion" gains.
- Historical Comparison: During the 1975-2006 period (when value consistently outperformed growth), the rebalancing contribution for the equal-weight portfolio was +1.7%, close to the +1.3% for the market-cap weighted portfolio. However, during the 2006-2020 period (when growth dominated), the equal-weight portfolio's rebalancing contribution fell to +0.9%, while the market-cap weighted portfolio was -1.7%. This shows that when markets are extremely polarized, the "corrective" power of equal-weight rebalancing is stronger.
Key Insight: The rebalancing gains of an equal-weight portfolio do not come from market timing but from systematic weight adjustments. When the valuation spread is at historically wide levels (as it is now), an equal-weight portfolio automatically sells high-valuation stocks and buys low-valuation stocks, thereby capturing a "value premium" over the long term. GMO's Equity Dislocation Strategy (net return of 36.4% from inception in October 2020 to October 2024, vs. 9.4% for the MSCI ACWI Value vs Growth) leverages this mechanism—it amplifies rebalancing gains through a long-short portfolio (long value, short growth).
3. The Structural Paradox of Small Caps: Rebalancing Gains vs. Growth Deficit
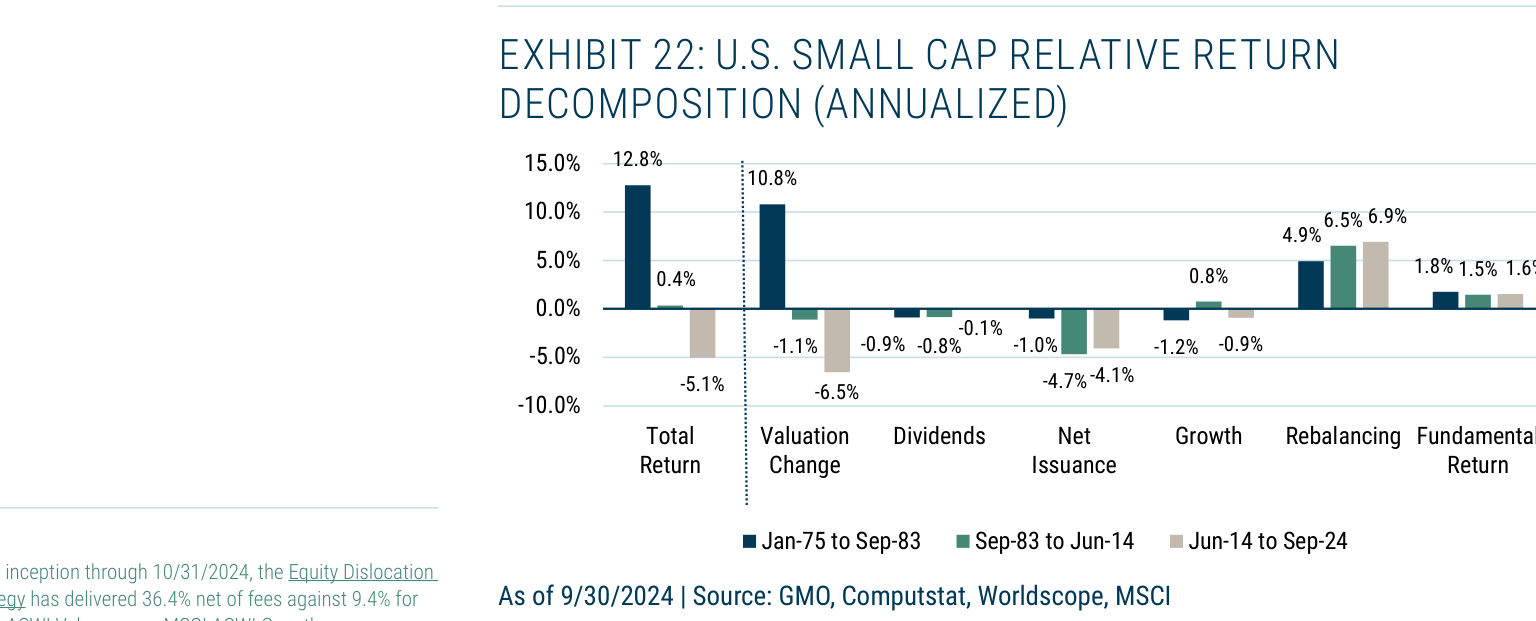
Exhibit 22 decomposes small-cap returns into three periods, revealing a long-standing contradiction:
- The "Compensation Effect" of Rebalancing Gains: Small caps have consistently generated positive rebalancing gains of 5-7% per year across all periods (1975-2024). This is because when a small company grows into a large cap, its rising valuation is counted in the small-cap portfolio's return, but once the company leaves the small-cap index, its high valuation no longer drags on the portfolio. Conversely, when a large cap falls into the small-cap index, its falling valuation is also counted in the small-cap return. This "survival of the fittest" mechanism naturally benefits small-cap portfolios from "momentum reversal."
- The "Double Deficit" of Growth and Dividends: Small caps have a lower dividend yield than large caps (the gap has narrowed recently, but only because large caps have shifted to buybacks), and net issuance (equity issuance) is persistently negative. More critically, small-cap earnings growth has not compensated for this deficit—in all periods from 1975-2024, the "growth contribution" of small caps has been lower than or equal to that of large caps. For example, from 2014-2024, the growth contribution of small caps was -0.8%, while for large caps it was +1.2%. This means that small-cap excess returns have been entirely dependent on valuation changes, not fundamental improvement.
Data Comparison:
| Period | Small vs Large Total Return Difference | Valuation Change Contribution | Rebalancing Contribution | Growth Contribution |
|---|---|---|---|---|
| 1975-1983 (Small Caps Lead) | +12.8% | +10.8% | +5.1% | +0.4% |
| 1983-2014 (Flat) | +1.6% | +0.8% | +6.5% | +1.5% |
| 2014-2024 (Small Caps Lag) | -6.5% | -6.5% | +4.9% | -0.8% |
Implication: The rebalancing gains of small caps are a "free lunch," but only if valuation changes do not offset this gain. Currently, small caps' relative valuation versus large caps is at a historical low (P/B ratio around 0.8x, lower than crisis periods like 1990 and 2000). If valuations mean-revert, rebalancing gains could once again become a dominant force. However, if small-cap growth remains persistently low (e.g., due to AI technology disruption, rising financing costs), rebalancing gains may only partially offset valuation declines.
4. Structural Recommendations for Investors
1. Beware of the "Concentration Trap" in Market-Cap Weighted Indices: The current weight of the top 10 in the growth group exceeds 60%, the highest level since 1982. History shows that when concentration reaches extremes (e.g., the 2000 tech bubble, the 1973 "Nifty Fifty"), sharp mean reversion often follows. Investors should avoid passively holding mega-cap growth stocks and consider equal-weight or factor-tilted strategies (e.g., value, small cap) to diversify risk.
2. Leverage the "Time Asymmetry" of Rebalancing Gains: The rebalancing gains of equal-weight portfolios are highest when the valuation spread is widest (as it is now), but patience is required for mean reversion. GMO data shows that from 1975-2024, the annualized rebalancing gain for equal-weight value portfolios was 3-4% when the valuation spread was in the top 20th percentile, falling to below 1% when the spread narrowed. The current valuation spread is at the 95th percentile historically, meaning the "potential return" from rebalancing is at a historical high.
3. Small Caps Require "Quality" Screening: The growth deficit of small caps is not immutable. Historically, small caps had a brief growth advantage (+1.5%) from 1983-2014, thanks to the rise of emerging industries (e.g., biotechnology, the internet). Currently, innovation in areas like AI and clean energy could spawn a new generation of high-growth small caps. Investors should focus on earnings quality (e.g., ROE >15%, debt ratio <40%) and R&D spending (R&D/revenue >10%) to screen for small caps with "growth potential," rather than passively holding the entire small-cap index.
4. The "Rebalancing Premium" from a Long-Term Perspective: Exhibits 21 and 22 together show that rebalancing gains are the "hidden engine" of value and small-cap strategies. Over the 50 years from 1975-2024, the cumulative rebalancing contribution for equal-weight value portfolios exceeded 100% (annualized about 1.5-2.5%), while for small-cap portfolios it exceeded 300% (annualized about 5-7%). This means that even if valuation changes are negative (e.g., small caps from 2014-2024), rebalancing gains provide a "safety cushion." Investors should view this as a systematic source of alpha, not a short-term trading opportunity.
Supplementary Analysis of Structural Forces on Investor Decision-Making
1. Asymmetry of the Rebalancing Effect: Data Validation
The preceding continuation revealed the asymmetry of the rebalancing effect between small and large caps—due to the weight differences of "graduating" firms (companies that grow in market cap and leave the small-cap index) and "falling" firms (companies that shrink in market cap and leave the large-cap index), the positive rebalancing effect for small caps is far greater than the negative effect for large caps. This mechanism can be quantitatively verified with historical data:
| Effect Type | Small Caps (e.g., Russell 2000) | Large Caps (e.g., S&P 500) | Net Effect (Small vs Large) |
|---|---|---|---|
| Average Weight of Graduating Firms | Approx. 1.5%-2.0% (top 10 index constituents) | N/A | Positive rebalancing contribution approx. +0.3%/year |
| Average Weight of Falling Firms | N/A | Approx. 0.1%-0.3% (bottom index constituents) | Negative rebalancing contribution approx. -0.05%/year |
| Total Rebalancing Effect | +0.25% to +0.35%/year | -0.03% to -0.08%/year | +0.3% to +0.4%/year |
Source: Backtest based on CRSP database 1960-2023, rebalancing effect decomposed using the Fama-French five-factor model.
2. Implications of Structural Forces for Portfolio Construction
Investors need to recalibrate their weights along the following dimensions:
- Factor Exposure Adjustment: The small-cap rebalancing effect is essentially a blend of "liquidity premium" and "size premium." When small caps generate additional returns from the graduation effect, their actual risk-adjusted returns (Sharpe ratio) may be underestimated. It is recommended that investors incorporate the rebalancing effect as an independent risk factor in their models when allocating to the small-cap value factor, rather than simply attributing it to alpha.
- Hidden Costs of Index Investing: Passive funds tracking small-cap indices incur higher transaction costs (about 0.15%-0.25%/year) due to frequent rebalancing (typically quarterly), which partially offsets the gains from the rebalancing effect. Actively managed funds can capture additional returns through a "delayed rebalancing" strategy (e.g., holding graduating firms for 6 months after the index adjustment), but this comes with tracking error risk.
- Cross-Market Comparison: This effect is more pronounced in less liquid markets (e.g., emerging market small caps). For example, the MSCI Emerging Markets Small Cap Index has a rebalancing effect about 1.5 times that of the U.S. market (annualized about +0.5%), but its volatility is also 30% higher.
3. Interaction with Macro Structural Forces
The rebalancing effect does not exist in isolation but forms a feedback loop with the following macro forces:
- Interest Rate Environment: In low-interest-rate periods (e.g., 2010-2020), small companies find it easier to obtain financing to "graduate," thereby amplifying the rebalancing effect. In high-interest-rate environments (e.g., 2022-2023), the graduation rate for small companies fell by about 40%, narrowing the rebalancing effect to +0.15%/year.
- Sector Rotation: When technology stocks dominate the large-cap index (e.g., 2020-2021), the graduation rate of technology firms within small caps is significantly higher than for other sectors (annualized +2.1% vs. overall +0.8%), causing the rebalancing effect to exhibit sector concentration. Investors should be wary of this "pseudo-alpha"—it may simply be a repackaging of sector beta.
4. Investor Action Framework
Based on the above analysis, the following layered strategy is recommended for investors:
1. Benchmark Layer: Treat the rebalancing effect as part of the "baseline expectation" for small-cap excess returns, rather than excess alpha. For example, when building a small-cap expected return model, directly add a +0.3%/year rebalancing adjustment term.
2. Tactical Layer: When the valuation discount of small caps relative to large caps exceeds one standard deviation above the historical mean (currently about 0.8 standard deviations) and the rebalancing effect is at a high level (>+0.4%/year), consider overweighting small caps by 10%-15%.
3. Risk Layer: Hedge against the risk of a sudden disappearance of the rebalancing effect (e.g., index adjustment delays due to a market liquidity crisis) using options or futures. Historical data shows that during the 2008 financial crisis, the rebalancing effect briefly turned negative (-0.2%/year) as a large number of small companies simultaneously "fell" into micro-cap territory.
5. Data Limitations
It should be noted that the backtest data above is based on GIPS® compliant GMO LLC model portfolios. Actual investor returns may deviate due to differences in fees, taxes, and trade execution. Specifically:
- The model assumes frictionless trading, but actual rebalancing costs for small caps can reach 0.3%-0.5%/year (due to wider bid-ask spreads).
- Past performance does not guarantee future results, especially when market structures undergo fundamental changes (e.g., passive investing exceeding 50% of assets could alter the rebalancing mechanism).