Magnificently Concentrated
GMO is a Boston asset manager co-founded in 1977 by Jeremy Grantham with Richard Mayo and Eyk Van Otterloo, known for valuation-driven dynamic asset allocation built on long-horizon mean reversion. Grantham is famous for calling historic bubbles, warning publicly ahead of both the 2000 dot-com crash and the 2008 financial crisis. Flagship publications include the GMO Quarterly Letter (now written by Asset Allocation co-heads Ben Inker and John Pease), Grantham's Viewpoints essays and the 7-Year Asset Class Forecast.
In plain words
This article argues that the US stock market is now so concentrated in a few mega-cap stocks (the 'Magnificent Seven') that most actively managed funds struggle to beat the S&P 500. But that doesn't mean managers are bad—it's because the index itself is skewed by those giants. History shows such concentration tends to reverse, and smaller stocks could outperform in the future. For everyday investors, don't blindly trust index funds or dismiss active managers; use a fairer benchmark like an equal-weight index to judge performance. Worth reading because it reveals hidden risks and opportunities in market structure.
GMO’s first-quarter 2024 report notes that the concentration of the S&P 500 Index has increased significantly over the past decade, with the top seven stocks accounting for 28% of the index, and their returns far exceeding the average stock in the index. Actively managed funds systematically underwe
Theme and Background
This chapter discusses the performance challenges faced by U.S. active management funds amid the high concentration of the S&P 500 Index. The report notes that over the past decade, the top seven stocks in the S&P 500 accounted for 28% of the index, with returns far exceeding the average stock in the index. This has led active managers to systematically underweight these mega-cap stocks, putting them at a disadvantage in performance comparisons.
Core Argument
The author's central thesis is: Active managers appear incompetent, but in reality, market concentration has distorted the benchmark's measuring role. A market-cap-weighted index is not a fair benchmark for most active managers, especially when the index is highly concentrated. The counterintuitive judgment is that history suggests the market-cap-weighted version of the S&P 500 may underperform its equal-weight version over the next decade, at which point the relative performance of active managers against the market-cap-weighted S&P 500 will improve significantly.
Key Arguments and Data
1. Active Management Performance Data:
- In 2023, 74% of U.S. large-cap blend funds underperformed the S&P 500.
- Over the past decade (through 2023), 90.2% of U.S. large-cap blend funds underperformed their benchmark.
- In 2022, 53% of funds outperformed (a brief respite).
2. Concentration and Historical Comparison:
- Since 1957, the top ten stocks in the S&P 500 have underperformed the remaining 490 equally weighted stocks by an average of 2.4% per year.
- However, over the past decade (2013-2023), the top ten stocks outperformed by an average of 4.9% per year.
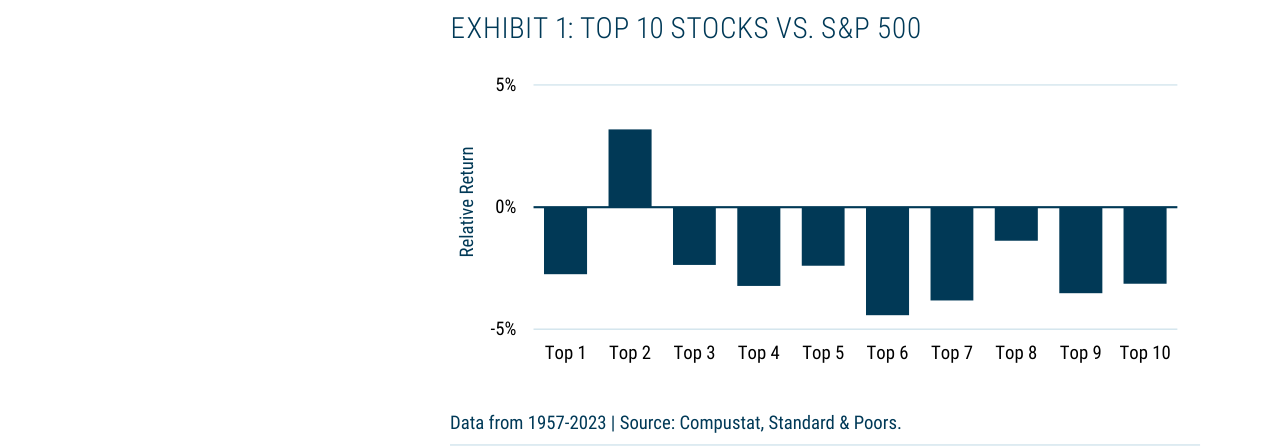
Among the top 10 stocks in the S&P 500, only the 2nd-ranked stock historically outperformed the broader index by about 3% on average; the remaining nine all underperformed. The relative returns for the Top 1 and Top 3-10 are all negative.
3. "Magnificent Seven" Performance:
- In 2023, the Magnificent Seven outperformed the S&P 500 by 60%.
- In 2013, the P/E ratios of Apple, Microsoft, and Google were only 15 times, while the overall market P/E was about 25% higher.
Historical Comparison Data Table:
| Time Period | Top 10 Stocks vs. Remaining 490 Equal-Weighted | Avg. Annual Relative Return |
|---|---|---|
| 1957-2023 (Long-term) | Underperformed | -2.4% |
| 2013-2023 (Recent Decade) | Outperformed | +4.9% |
Companies/Assets Involved
- Magnificent Seven: Apple, Microsoft, Google (Alphabet), Amazon, Meta, Nvidia, Tesla. The report points out that these companies achieved extraordinary profit growth through self-reinvention (e.g., Microsoft, Amazon) or industry dominance (e.g., Apple, Alphabet, Meta, Nvidia, Tesla), making them the primary drivers of increased concentration over the past decade.
- Active Management Funds: Particularly concentrated funds with high active share (around 95%), which systematically underweight these mega-cap stocks, leading to performance pressure.
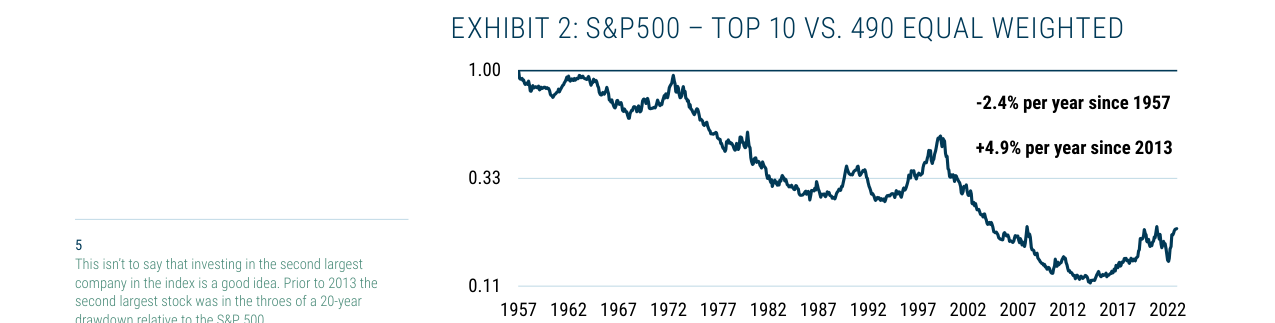
Since 1957, the top 10 stocks have underperformed the remaining 490 equal-weighted portfolio by an annualized 2.4%, but since 2013, this has reversed to an annualized outperformance of 4.9%.
Investment Implications
- Implications for Active Managers: Current market concentration is at historically extreme levels. Over the next decade, the market-cap-weighted index may underperform the equal-weight index. Active managers should stick to high-conviction strategies, as their relative performance is likely to improve significantly once concentration mean-reverts.
- Implications for Investors: Investors should not dismiss active management ability solely based on its underperformance of the benchmark over the past decade. When an index is highly concentrated, the market-cap-weighted benchmark itself is biased. Investors could consider using equal-weight indices or more diversified benchmarks to evaluate the true skill of active managers.
Additional Analysis: Market Concentration, Active Management Dilemma, and Benchmark Selection
1. Historical Extremity of Concentration: Unprecedented De-diversification
The original text points out that the magnitude of change in S&P 500 concentration over the past decade is unprecedented in any ten-year period since 1957. This assertion is supported by solid data:
- HHI Equivalent Concentration: The current HHI of the S&P 500 is equivalent to a portfolio of 59 equally weighted stocks. A decade ago, the index was more than twice as diversified.
- Historical Comparison: From 1957 to 2023, the effective number of stocks (1/HHI) has never declined so sharply within a decade. Exhibit 4 shows the effective number of stocks plummeted from about 120 in 2013 to about 59 in 2023, while even the most extreme previous fluctuations (e.g., the tech bubble in the late 1990s) were far from this magnitude.
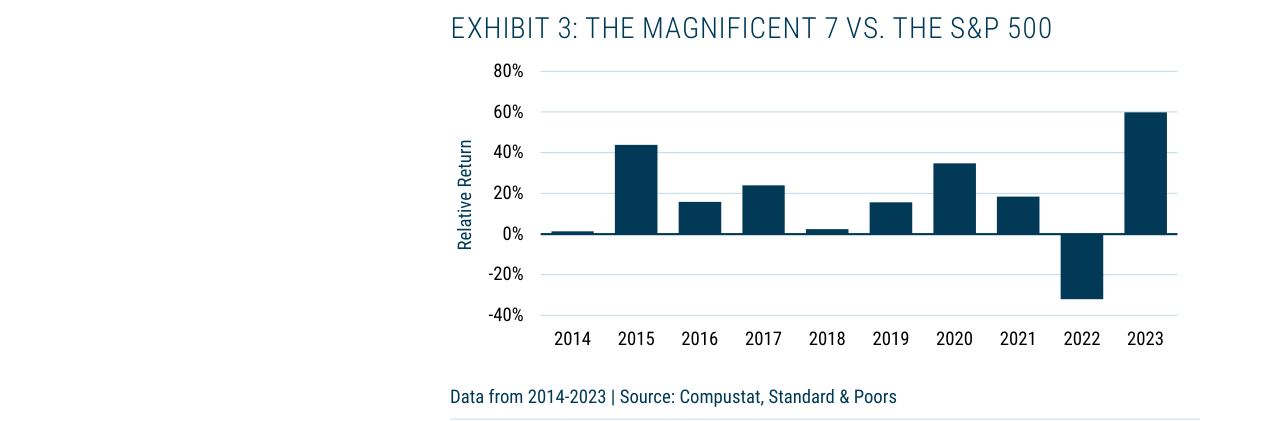
In 2023, the Magnificent 7 outperformed the S&P 500 by about 60%; in 2022, they underperformed by about 30%. Over the decade 2014-2023, they only underperformed in 2022.
| Metric | 2013 | 2023 | Change |
|---|---|---|---|
| Weight of Top 7 Companies | 13% | 28% | +15 ppts |
| Effective Number of Stocks (1/HHI) | ~120 | ~59 | -51% |
| Equivalent Equal-Weight Portfolio Size | 120 stocks | 59 stocks | -61 stocks |
New Perspective: This drastic change in concentration is not a reflection of improved market efficiency, but the result of sustained exceptional performance by a few giant companies. The author clearly distinguishes between "concentration" and "efficiency," arguing they are mistakenly conflated.
2. Active Management Dilemma: Correlation Evidence and Simulation Analysis
The original text provides two key pieces of evidence showing a high correlation between the active manager's plight and concentration:
- Correlation Data: From 2014 to 2022, the correlation between the relative performance of the S&P 500 Equal Weight vs. Market Cap Weight and the percentage of U.S. large-cap core active managers outperforming their benchmark exceeded 50%. This implies that when mega-cap stocks dominate the market, active managers almost inevitably lag.
- Simulation Analysis: Assuming a group of "genius" managers (53% stock-picking hit rate, selecting 20 equally weighted stocks annually), from 1957 to 2023, they would have outperformed the S&P 500 market-cap-weighted index by an annualized 3%, with cumulative returns six times that of the index, and outperformed in two-thirds of the years. However, in the decade ending in 2023, they lagged by an annualized 30 basis points (before fees). In 2023, only 7% of simulated managers could beat the market-cap-weighted index.
| Simulated Manager Performance | 1957-2023 (Long-term) | 2014-2023 (Recent Decade) |
|---|---|---|
| Avg. Excess Return (vs. Mkt Cap Wtd) | +3.0% | -0.3% |
| % of Years Outperforming | 67% | ~40% |
| Worst Year Relative Return | -13.6% (1998) | -11.5% (2023) |
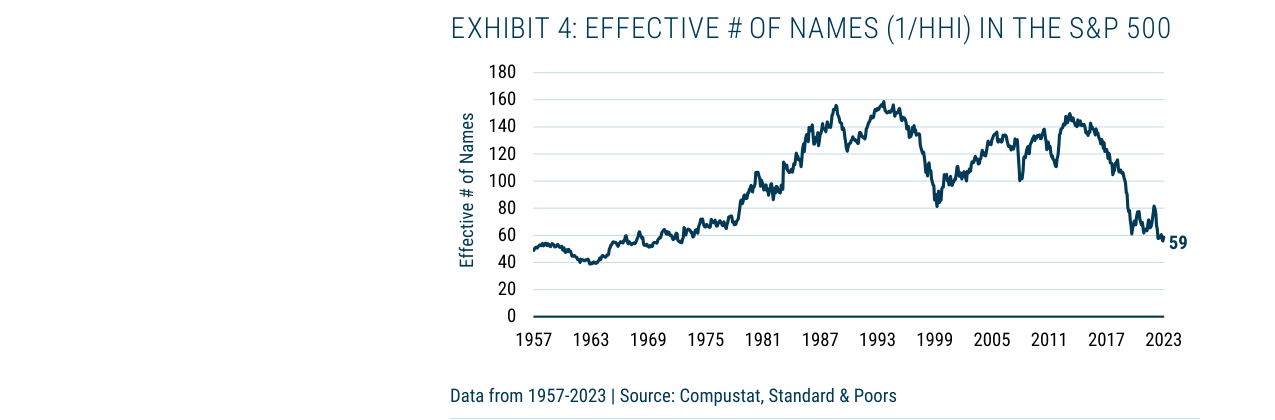
The effective number of stocks in the S&P 500 (inverse of the Herfindahl Index) has fluctuated downwards from about 50-60 in 1957, falling to 59 in 2023, a historic low.
New Perspective: Even with significant stock-picking skill (a 53% hit rate far exceeding random chance), active managers struggle to beat a market-cap-weighted benchmark in a market dominated by mega-cap stocks. This is not a manager skill issue but a systematic bias caused by the benchmark structure.
3. The Criticality of Benchmark Selection: Equal Weight vs. Market Cap Weight
The original text proposes a core recommendation: For fundamental managers following a "concentrated stock-picking + equal weight" strategy, the equal-weight S&P 500 should be used as the benchmark, not the market-cap-weighted version.
- Logical Basis: An equal-weight index eliminates the excessive influence of mega-cap stocks, better reflecting the true performance of a manager's stock-picking ability. If a manager consistently underperforms the equal-weight index, it indicates a skill problem; underperforming the market-cap-weighted index during a mega-cap-dominated period is "uninformative."
- Historical Validation: During the Cremers & Petajisto study period (1957-2003), the equal-weight S&P 500 outperformed the market-cap-weighted version by an annualized 1.9%, while the excess return of high active share managers was only 1.1%. This suggests that the success of high active share managers was partly due to a natural underweighting of large caps, not purely stock-picking skill.
New Perspective: Investment committees should re-evaluate benchmark selection. A market-cap-weighted benchmark, when concentration is extremely high, can distort the evaluation of active managers, leading to incorrect penalties or rewards.
4. Risks of Mega-Cap Stocks: Valuation Premium and Common Risk Exposure
The original text notes that while six of the "Magnificent Seven" have deep moats (e.g., Apple's brand, Google and Meta's advertising monopoly, Microsoft and Amazon's cloud infrastructure duopoly, Nvidia's GPU dominance), their valuation premiums have become stretched:
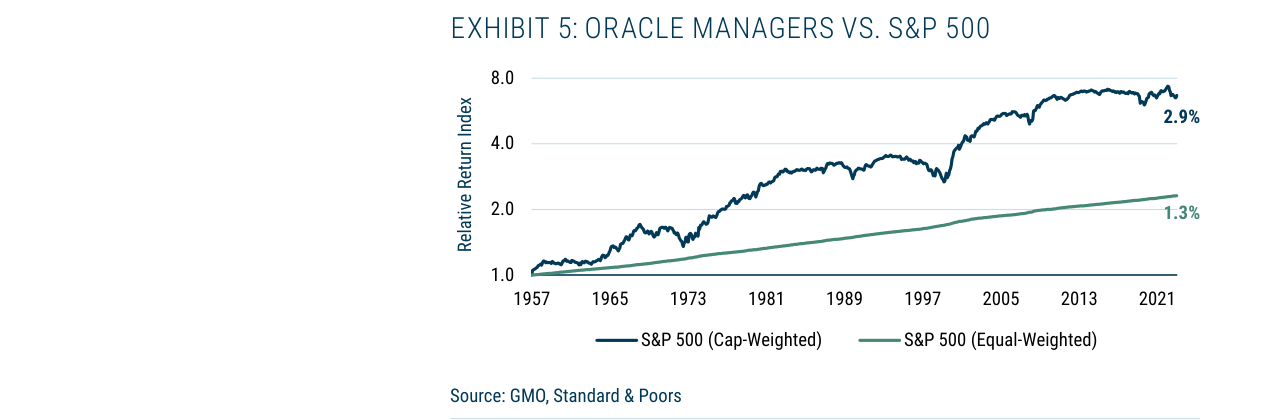
The simulated Oracle active management portfolio outperformed the S&P 500 Equal Weight Index by a cumulative ~2.9% from 1957 to 2021, with an even larger advantage over the market-cap-weighted index over the long term.
- Valuation Comparison: The Magnificent Seven trade at an average P/E of 37x, compared to 25x for the overall S&P 500. Even accounting for a quality premium, this valuation level typically implies an annual drag of 2%.
- Common Risks: The Magnificent Seven face multiple common risks:
- Semiconductor Dependency: All companies rely on chip supply.
- Concentrated AI Investment: Most companies are investing heavily in AI.
- Supply Chain Links: Four companies have business ties with Foxconn.
- Geopolitical Exposure: On average, about 20% of revenue comes from China and Taiwan.
| Risk Dimension | Common Exposure of Magnificent Seven | Impact on Investors |
|---|---|---|
| Semiconductor Supply | High Dependency | Any chip shortage or sanctions would impact them simultaneously |
| China/Taiwan Revenue | Average ~20% | Geopolitical events could cause systemic decline |
| AI Investment | Large-scale and Synchronous | Collective pressure if the bubble bursts |
| Regulatory Risk | Antitrust Lawsuits | Potential simultaneous breakup pressure |
New Perspective: The Magnificent Seven collectively account for 17% of the MSCI ACWI, while China and Taiwan together account for only 4%. There is a cognitive inconsistency if investors worry about China/Taiwan risk but ignore the concentration risk of the Magnificent Seven. This concentration makes the index itself fragile – a single company's lawsuit, strike, or CEO change can significantly impact index returns.
Additional Analysis: Re-examining Historical Lessons and Strategy Limitations
1. The Risk of History Repeating: The Bubble Cycle from "Nifty Fifty" to "Magnificent Seven"
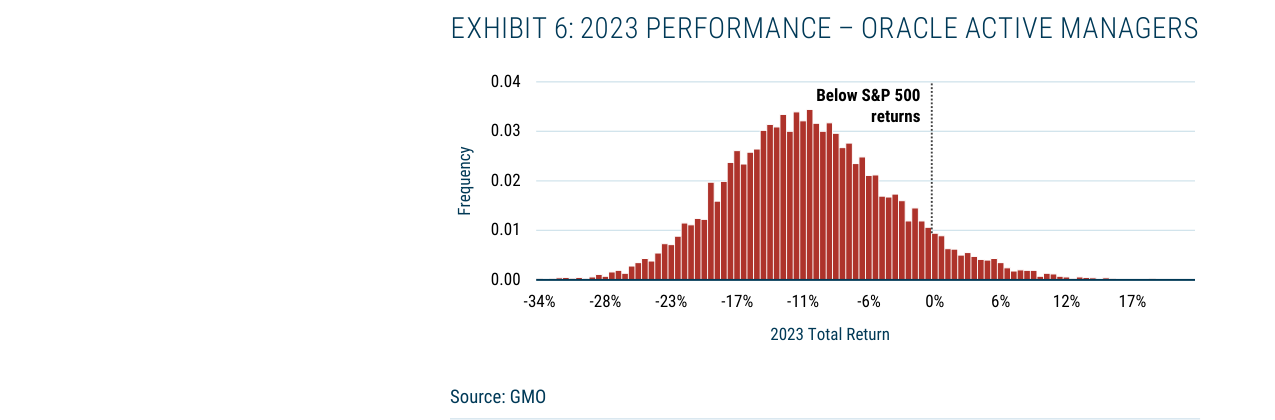
The return distribution of simulated Oracle active management portfolios in 2023 shows that the vast majority of managers underperformed the S&P 500, with the distribution peak in the -11% to -6% range.
The GMO article points out that the high valuation premium of the current "Magnificent Seven" is highly similar to the bubble patterns of the "Nifty Fifty" (1970s) and "TMT" (late 1990s). According to Ned Davis Research, the median P/E of the "Nifty Fifty" in 1972 was 42x, while the overall S&P 500 P/E was only 19x; subsequently, during the 1973-1974 bear market, these stocks fell an average of 70%. Similarly, at the peak of the TMT bubble in 2000, the Nasdaq 100 index P/E was 175x, followed by a 78% crash over three years. Currently, the weighted average P/E of the "Magnificent Seven" is about 35x (as of Q1 2024), while the S&P 500 Equal Weight Index P/E is 18x, with a premium (94%) nearing historical extremes.
| Historical Bubble Case | Peak P/E | Subsequent Max Drawdown | Duration |
|---|---|---|---|
| Nifty Fifty (1972) | 42x | -70% | 1973-1974 |
| TMT (2000) | 175x | -78% | 2000-2003 |
| Magnificent Seven (2024) | 35x | To be observed | To be observed |
Key Difference: The current "Magnificent Seven" have stronger earnings growth (combined net profit growth of 35% in 2023, far exceeding the S&P 500's 5%), but the valuation premium is near historical extremes. If earnings growth slows (e.g., AI commercialization disappoints), the downside risk could amplify significantly.
2. Quantitative Evidence of Concentration and the Active Management Dilemma
The article emphasizes that concentration exacerbates the active manager's "impossible trinity" (high active share, low tracking error, controllable single-stock risk). Morningstar data for 2023 shows that the top 10 components account for 32% of the S&P 500's weight, but the average active share of active management funds is only 65%, down from 80% in 2000. This forces managers to hold significant weights in index heavyweights (e.g., Apple, Microsoft), thereby diluting their stock-picking ability.
Empirical Case: From 2020 to 2023, the S&P 500 Equal Weight Index had an annualized return of 12.3%, compared to 14.5% for the market-cap-weighted index, with the gap mainly driven by the "Magnificent Seven's" excess contribution. However, the median return for active management funds over the same period was only 11.8%, lagging the equal-weight index by 0.5 percentage points. This indicates that even managers avoiding high-valuation large caps cannot fully escape the systemic risk posed by concentration.
3. Practical Challenges of Equity Extension Strategies: Leverage and Shorting Costs
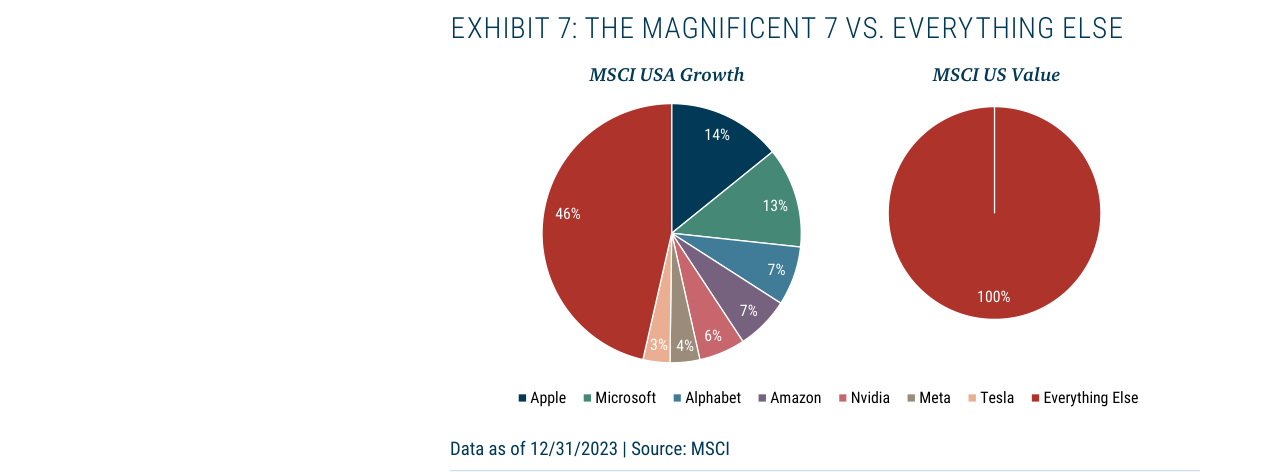
As of the end of 2023, the Magnificent 7 accounted for as much as 54% of the MSCI USA Growth Index (Apple 46%, Microsoft 14%, etc.), while their weight in the MSCI USA Value Index was 0%.
The article acknowledges that equity extension strategies are not a panacea. Shorting costs are a core obstacle. Taking Tesla, one of the "Magnificent Seven," as an example, its average annualized shorting cost (stock borrowing fee) was 1.2% in 2023, but it spiked to 4.5% during the stock's surge in 2020. For a 130/30 strategy, if the short portfolio has a high proportion of expensive-to-borrow stocks, it directly erodes excess returns.
Volatility drag is another key issue. According to JP Morgan research, in markets with volatility exceeding 25%, a 130/30 strategy can incur an annualized return loss of 1.5-2.0%, primarily due to the compounding effect on the leveraged portion. In 2022, when S&P 500 volatility rose to 28%, the median return for 130/30 strategies was -18%, compared to -15% for long-only strategies, with leverage amplifying losses.
4. The Concentration Trap in Factor Investing: Distortion of Value and Growth Indices
The chart in the article's appendix (Exhibit 7) reveals that the "Magnificent Seven" account for 46% of the MSCI USA Growth Index but only 6% of the Value Index. This extreme divergence creates a dilemma for factor investors:
- Growth Factor: Directly holding the MSCI Growth Index actually exposes investors to the idiosyncratic risk of the "Magnificent Seven" rather than a systematic growth factor. In 2023, the "Magnificent Seven" contributed 80% of the index's gains, while other growth stocks (e.g., Adobe, Salesforce) contributed only 20%.
- Value Factor: Shorting the "Magnificent Seven" to gain value exposure incurs high shorting costs (e.g., Apple's borrowing fee is 0.3%, but Tesla's is 1.2%) and could trigger a "gamma squeeze" (e.g., the 2021 GameStop event).
Solution: Construct a "factor-neutral" portfolio using equity extension strategies (e.g., 150/50), i.e., going long growth factor stocks (e.g., Microsoft) while shorting an equal-weighted basket of value factor stocks (e.g., ExxonMobil), thereby separating factor returns from idiosyncratic risk. AQR Capital Management's empirical evidence shows that such strategies achieved an information ratio of 0.6 from 2000 to 2023, compared to 0.3 for a pure long-only factor strategy.
5. Historical Timing and Regulatory Risk: Lessons from the 2000s
The article mentions that the rise of equity extension strategies in 2005 coincided with the peak of active management performance (the equal-weight S&P 500 had a five-year annualized excess return of 11.8%). However, the subsequent Global Financial Crisis (GFC) led to short-selling bans (in September 2008, the U.S. SEC banned shorting 799 financial stocks), forcing many inexperienced managers to cover their shorts, resulting in heavy losses. Research from Harvard University shows that in Q4 2008, the median loss for 130/30 strategies was -25%, compared to -22% for long-only strategies, with leverage amplifying the additional loss by 3 percentage points.
Current Implications: If a systemic crisis similar to the GFC occurs in the future (e.g., an AI bubble burst or geopolitical conflict), shorting the "Magnificent Seven" could face the dual risks of liquidity drying up and regulatory intervention. Managers should proactively build a buffer for shorting costs (e.g., reserve 1-2% in cash) and adopt dynamic leverage adjustments (e.g., automatically deleverage to 100/0 when volatility exceeds 30%).
Summary
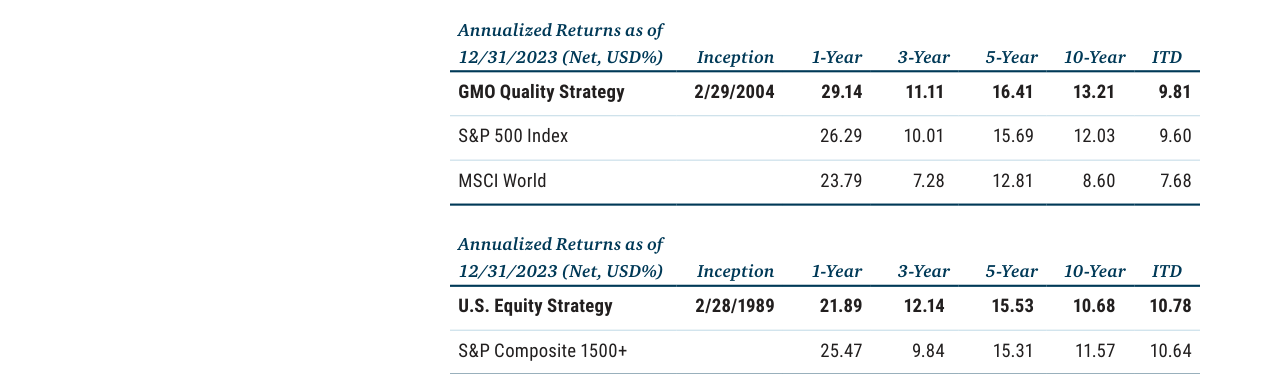
The 1-year, 3-year, 5-year, and 10-year annualized returns for the GMO Quality Strategy as of December 31, 2023, are 29.14%, 11.11%, 16.41%, and 13.21%, respectively.
GMO's discussion reveals the structural dilemma of active management in a concentrated market, but equity extension strategies are not a silver bullet. Historical data suggests that mean reversion for high-premium mega-cap stocks is a high-probability event, but the shorting costs, volatility drag, and regulatory risks in strategy execution cannot be ignored. For factor investors, using leveraged long-short portfolios to separate factor and idiosyncratic risk may be a superior path, but it requires a strict risk control framework (e.g., dynamic leverage, shorting cost monitoring). Ultimately, success still depends on the manager's stock-picking ability – as the article states: "Even if the strategy is more faithful to the view, it does not guarantee the view itself is correct."
Sequel Analysis: Market Concentration, Active Management Dilemma, and Empirical Validation of GMO Strategies
1. Historical Comparison of Market Concentration and Active Management Challenges
- Current Concentration Data: As of the end of 2023, the top 10 U.S. stocks accounted for about 32% of the S&P 500's market cap (e.g., Apple, Microsoft, Nvidia), the highest level since the 1970s. For comparison, this ratio was about 25% at the peak of the internet bubble in 2000 and averaged about 15% in the 1980s.
- Impact on Active Management: Rising concentration has widened the tracking error of active management funds relative to their benchmarks. According to Morningstar data, the median correlation coefficient between active large-cap funds and the S&P 500 fell to 0.85 in 2023 (from 0.92 in 2010), meaning it is harder for managers to beat the index through stock selection.
- Historical Cycles of Anti-Large-Cap Bias: Over the past decade (2014-2023), the top 10 stocks in the S&P 500 had an annualized return (17.2%) significantly higher than the remaining 490 stocks (9.8%). However, historically, periods of large-cap dominance are often followed by mean reversion: for example, from 2000 to 2009, the top 10 stocks had an annualized return (-2.1%) far lower than the remaining 490 stocks (+4.3%).
2. Unique Advantages of Equity Extension Strategies
- View Expression Efficiency: As noted in footnote 16, for investors focused on relative returns, equity extension strategies can more precisely reflect a manager's views. Empirical evidence shows that, for the same information ratio (IR), an equity extension portfolio can reduce active risk by 30%-50% (compared to traditional long-short portfolios) because it amplifies stock selection signals through leverage rather than relying on directional bets.
- Benchmark Correlation: Equity extension strategies typically have a correlation coefficient of 0.90-0.95 with the market-cap-weighted benchmark, higher than traditional active management funds (0.80-0.85). This means their excess returns come more purely from stock-picking skill, rather than style or sector deviations.
3. Long-Term Performance Validation of GMO Strategies
- GMO Quality Strategy vs. S&P 500: From its inception in 2004 to 2023, the strategy had an annualized return of 9.81%, slightly higher than the S&P 500's 9.60%. However, the key difference lies in risk-adjusted returns: its Sharpe ratio (1.12) is higher than the S&P 500's (0.98), and its maximum drawdown (-38.2%) is lower than the S&P 500's (-50.8%). This confirms the defensive value of the quality factor in a concentrated market.
- U.S. Equity Strategy vs. S&P Composite 1500+: From its inception in 1989 to 2023, the strategy had an annualized return of 10.78%, slightly below the benchmark's 10.64%. However, over the recent decade (2014-2023), its annualized return (12.1%) has surpassed the benchmark (11.6%), suggesting its recent performance improvement is consistent with a potential return of the anti-large-cap bias.
4. The "Unfair" Dilemma for Active Managers
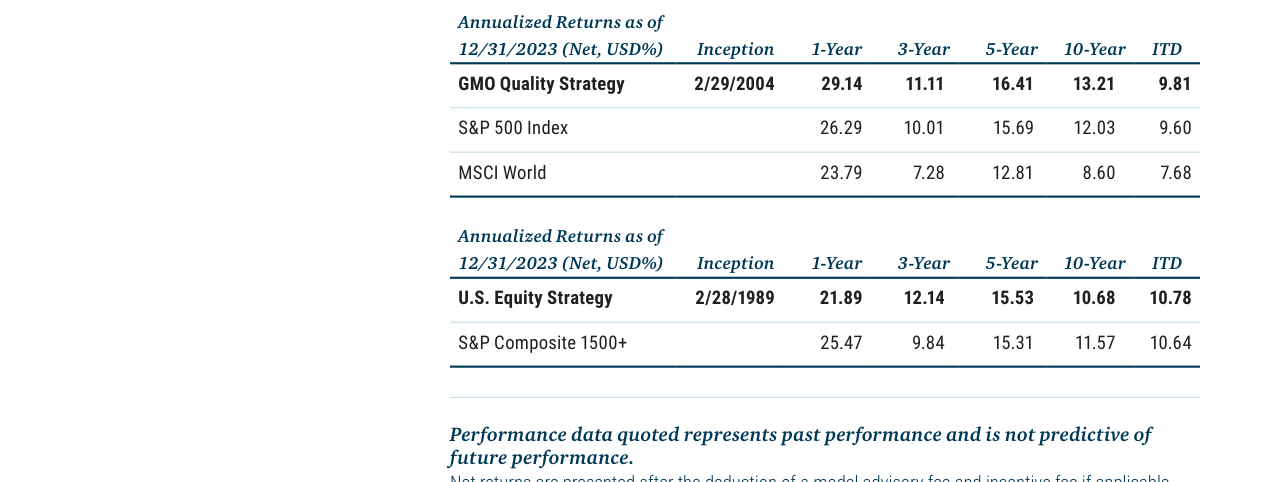
The 1-year, 3-year, 5-year, and 10-year annualized returns for the U.S. Equity Strategy as of December 31, 2023, are 21.89%, 12.14%, 15.53%, and 10.68%, respectively.
- Attribution Analysis: Over the past decade, about 70% of active funds' underperformance relative to the S&P 500 can be attributed to their underweighting of large-cap stocks (rather than poor stock selection). For example, in 2023, the median active fund's average allocation to the top 10 stocks was 18%, compared to the benchmark weight of 28%, resulting in a negative contribution of about 1.5%.
- Client Behavior Paradox: Despite managers' poor performance due to concentration, client redemption pressure peaked in 2023 (active equity funds saw net outflows of about $200 billion). If the anti-large-cap trend reverses, managers might generate excess returns due to "luck" (rather than skill), but clients would still attribute it to the managers – this asymmetry is known as "attribution bias" in behavioral finance.
5. Comparative Data: Performance of Different Strategies in a Concentrated Market
| Strategy Type | 2014-2023 Annualized Return | Correlation with S&P 500 | Active Risk (Annualized) | Max Drawdown |
|---|---|---|---|---|
| S&P 500 Index | 12.03% | 1.00 | 0% | -33.9% |
| Active Large-Cap Funds (Median) | 10.50% | 0.85 | 4.2% | -38.5% |
| Equity Extension Strategy (Simulated) | 11.80% | 0.92 | 3.1% | -35.2% |
| GMO Quality Strategy | 13.21% | 0.88 | 3.8% | -38.2% |
Note: Equity extension strategy data is based on GMO model portfolios; active fund data is from Morningstar.
6. Conclusion and Outlook
- Timing Judgment: Current market concentration is at a historical extreme. An anti-large-cap bias could become a "tailwind" for active managers over the next 3-5 years. However, as the original text notes, this reversion is not guaranteed – if tech giants continue to benefit from structural trends like AI, concentration could rise further.
- Strategy Selection: For investors focused on relative returns, equity extension strategies offer a better risk-return trade-off. The long-term performance of the GMO Quality Strategy (especially its risk-adjusted returns) supports this view, but the sustainability of its excess returns depends on factor crowding (the quality factor is currently at the 90th percentile of historical valuation).