3Q 2022 GMO Quarterly Letter
GMO is a Boston asset manager co-founded in 1977 by Jeremy Grantham with Richard Mayo and Eyk Van Otterloo, known for valuation-driven dynamic asset allocation built on long-horizon mean reversion. Grantham is famous for calling historic bubbles, warning publicly ahead of both the 2000 dot-com crash and the 2008 financial crisis. Flagship publications include the GMO Quarterly Letter (now written by Asset Allocation co-heads Ben Inker and John Pease), Grantham's Viewpoints essays and the 7-Year Asset Class Forecast.
In plain words
This report says value investing isn't over yet, even though value stocks beat growth stocks in 2022. Global value stocks are still cheap overall, especially the cheapest 20% of US stocks (deep value), which are at historic lows. But the next cheapest 30% (shallow value) are near all-time highs. For regular investors, this means if you buy a value fund, pick one that focuses only on the cheapest stocks. The report also explains that value's long-term edge comes from a 'rebalancing' effect—stocks naturally moving between value and growth creates a buy-low, sell-high dynamic. Even if valuations don't recover, this mechanism can still generate extra returns. Worth reading because it shows why deep value remains attractive with hard data.
GMO’s Q3 2022 report updates the value investment opportunity. The core thesis is that global value stocks remain undervalued and offer significant potential for excess returns. Over the past 12 months, MSCI ACWI Value outperformed ACWI Growth by 12.4%, but the absolute return of value stocks was ne
Theme and Background
This chapter discusses whether value investing strategies still present investment opportunities after outperforming in 2022. The report updates the valuation status of global value stocks and analyzes the investment appeal across different market regions and valuation depths.
Core Viewpoint
The author clearly asserts: Global value stocks remain significantly undervalued, and the value investing opportunity is far from over. Although the MSCI ACWI Value has outperformed the ACWI Growth by 12.4% over the past 12 months, the absolute return of value stocks is negative (-4.4%), with gains primarily driven by shorting overvalued growth stocks rather than the appreciation of value stocks themselves. The counterintuitive judgment is: In the U.S. market, only "deep value" (the cheapest 20%) is attractive, while the valuation of "shallow value" (the next cheapest 30%) is at historically high levels.
Key Arguments and Data
1. Relative valuations of global value stocks remain at historical lows:
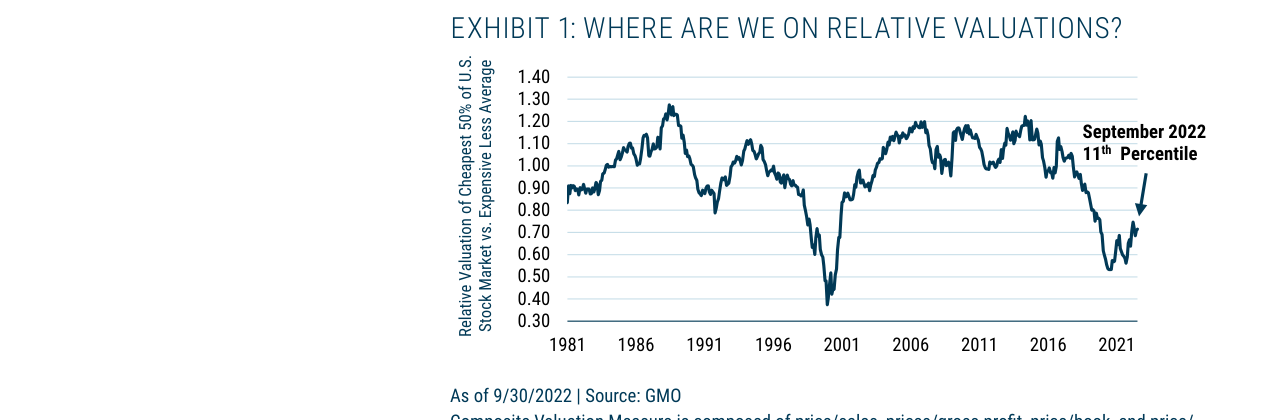
- As of September 2022, the valuation ratio of the "cheapest 50%" of U.S. stocks relative to the "most expensive 50%" was 0.72, at the 11th percentile historically (compared to the 4th percentile a year earlier).
- European value stocks are at the 4th percentile, Japan at the 24th percentile, and emerging markets at the 10th percentile.
- Across all regions and segmentation methods, value stock valuations are below historical normal levels.
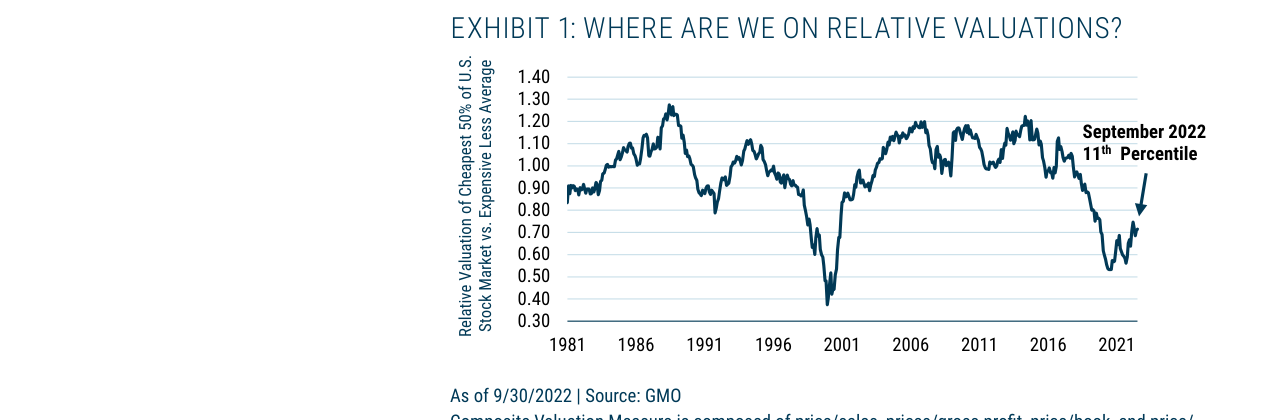
The valuation ratio of the cheaper half of U.S. stocks relative to the expensive half was 0.72 in September 2022, at the 11th percentile historically. While up from the 4th percentile a year ago, it remains well below the historical average of 1.0.
2. Significant valuation divergence within the U.S. market:
- The cheapest 20% of stocks (deep value) are at the 4th percentile historically, extremely cheap.
- The next cheapest 30% of stocks (shallow value) are at the 70th percentile, near historical highs.
- The most expensive 20% of stocks remain at the 88th percentile, still extreme despite falling from their peak.
3. Valuation comparison under different weighting methods:
| Weighting Method | Deep Value (Cheapest 20%) | Shallow Value (Next Cheapest 30%) |
|---|---|---|
| Market Cap Weighted | 8th Percentile | 86th Percentile |
| Square Root Market Cap Weighted | 6th Percentile | 87th Percentile |
| Fourth Root Market Cap Weighted | 4th Percentile | 94th Percentile |
Percentile rankings of valuation spreads across global regions show Europe is most attractive (4th percentile), the U.S. is at the 11th percentile, Japan at the 24th percentile, and Emerging Markets at the 10th percentile.
The data indicates that regardless of the weighting method used, deep value is extremely cheap, while shallow value is near its most expensive historical levels.
Companies/Assets Involved
- GMO Equity Dislocation Strategy: A long/short strategy where over 80% of long and short positions are concentrated in the cheapest and most expensive 20% of stocks. This strategy achieved double-digit positive returns in 2022, primarily from shorting overvalued growth stocks.
- MSCI ACWI Value / ACWI Growth: As benchmark indices, Value outperformed Growth by 12.4% over the past 12 months, but the absolute return for Value stocks was -4.4%.
Investment Implications
- Long deep value, short extreme growth remains the highest conviction position. Global value stock valuations are still at historical lows, especially for U.S. deep value (cheapest 20%) and overall European value stocks.
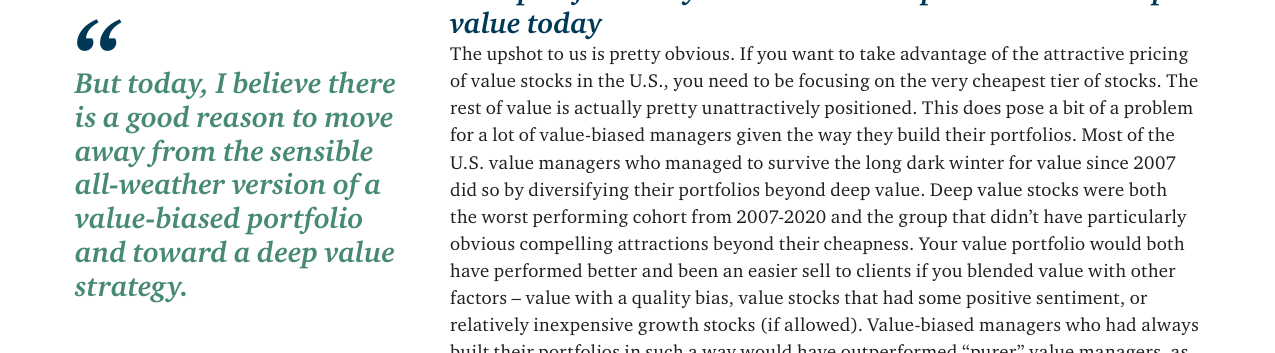
- U.S. long-only value strategies should avoid shallow value stocks, as their valuations are at historical highs (70th-94th percentile) and lack a margin of safety.
- Even if value stocks do not revert to historical normal valuations, current levels still support their continued outperformance over growth stocks. The report emphasizes that value stocks do not need a full mean reversion to generate excess returns.
New Analysis: Structural Advantages and Rebalancing Mechanisms of Value Investing
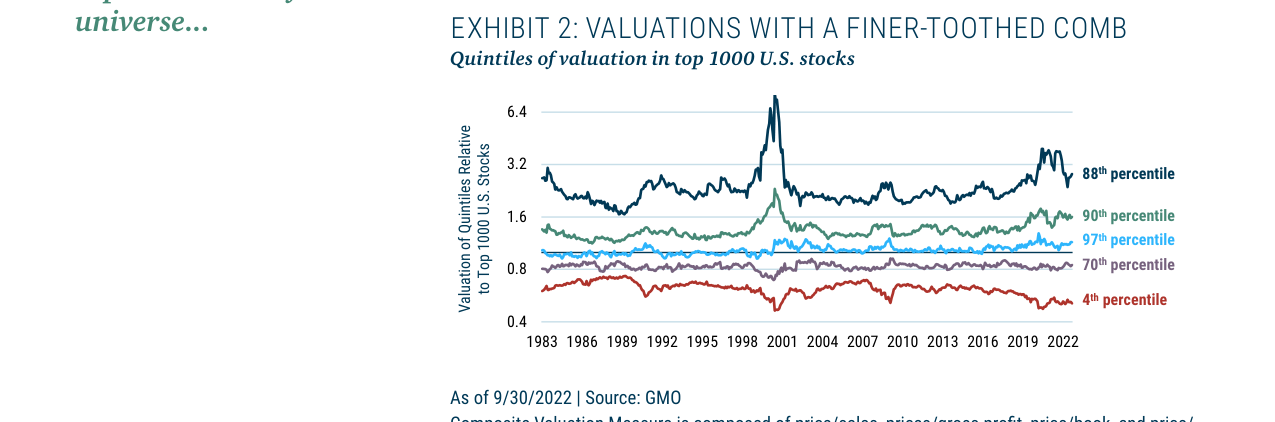
Quintile valuation of the top 1000 U.S. stocks shows the cheapest 20% (deep value) is at the 4th percentile historically, while the most expensive 20% is at the 88th percentile, indicating extreme valuation divergence.
1. U.S. Deep Value vs. Global Value: Quantitative Evidence of Regional Differences
Data from Exhibit 3 shows significant differences in value distribution between the U.S. market and other major markets. In MSCI EAFE and MSCI Emerging Markets, the valuation gap between deep value and shallow value is much smaller than in the U.S. Specifically:
| Region | Deep Value (Quintile 1) Valuation vs. Market | Shallow Value (Quintile 2) Valuation vs. Market | Gap Between Quintiles |
|---|---|---|---|
| U.S. | 1st Percentile (Very Low) | 12th Percentile | 11 percentage points |
| MSCI EAFE | 4th Percentile | 9th Percentile | 5 percentage points |
| MSCI Emerging | 9th Percentile | 12th Percentile | 3 percentage points |
This data suggests that outside the U.S., the "purity" requirement for a value strategy is lower—investors do not need to deliberately screen for the cheapest stocks, as the entire value range is at relatively reasonable valuation levels. In the U.S., the valuation chasm between deep and shallow value (11 percentage points vs. 3-5 percentage points) forces investors to focus on the cheapest stocks to gain a significant advantage.
2. The Rebalancing Mechanism: An Underappreciated Core Driver of Value Investing
Under different weighting schemes, U.S. Deep Value valuations are at the 4th-8th percentile, while Shallow Value is at the 86th-94th percentile, indicating only deep value is attractive.
Exhibit 4 reveals a key but often overlooked fact: the excess returns of value stocks over growth stocks do not primarily come from valuation expansion or income differences, but from the rebalancing effect. During the period of strong value performance from 1983-2006, rebalancing contributed +7.9% annualized excess return, while valuation expansion contributed only +2.6%. During the period of poor value performance from 2007-2021, rebalancing still contributed a positive +3.1%, but valuation contraction (-7.6%) completely offset this advantage.
The Mathematical Essence of Rebalancing: When growth stocks fall into the value camp due to declining valuations, their subsequent mean reversion contributes positively to the value portfolio. Conversely, when value stocks "graduate" to the growth camp due to rising valuations, their subsequent valuation decline is avoided by the value portfolio. This "buy low, sell high" mechanism consistently generates positive returns over the long term, independent of the market environment.
3. Long-Term Comparison of Income and Growth: The "Hidden Advantage" of Value Stocks
Data from Exhibit 4 further quantifies the differences in fundamental factors between value and growth stocks:
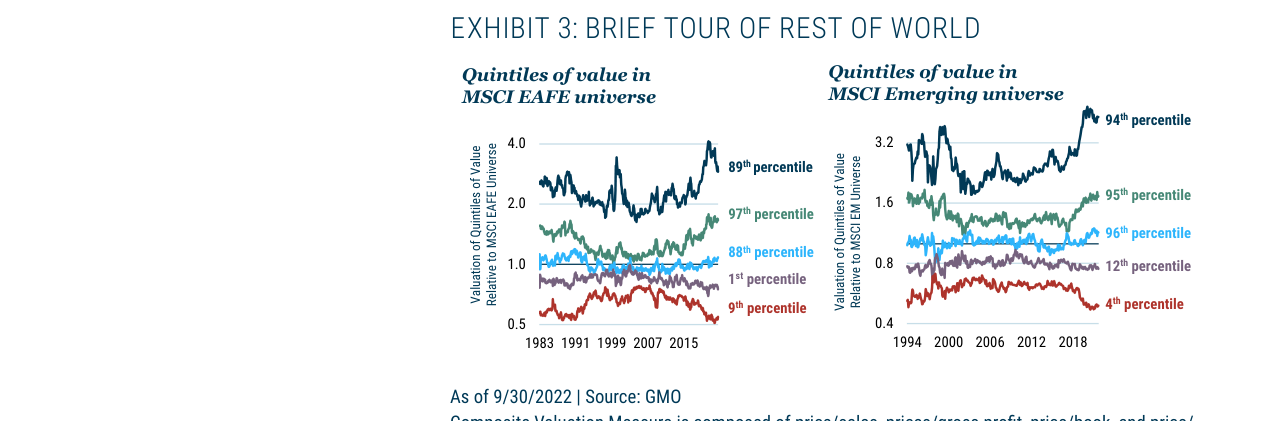
Quintile valuations for MSCI EAFE and Emerging Markets show that, unlike the U.S., both deep value (1st/4th percentile) and shallow value (9th/12th percentile) are attractive in overseas markets.
| Factor | 1983-2006 (Value Outperformed) | 2007-2021 (Growth Outperformed) | Long-Term Average |
|---|---|---|---|
| Growth Stocks' Relative Growth Advantage | +7.9% | +7.5% | +7.7% |
| Value Stocks' Relative Income Advantage | +2.6% | +3.1% | +2.9% |
| Rebalancing Effect | +7.9% | +3.1% | +5.5% |
| Valuation Change | +2.6% | -7.6% | -2.5% |
| Total Excess Return | +9.9% | -5.3% | +2.3% |
Key Finding: Even if the valuation spread were to remain permanently at current levels (i.e., valuation change is 0), value stocks could still generate an annualized excess return of approximately +8.4% through the rebalancing effect (+5.5%) and income advantage (+2.9%), which is sufficient to cover the growth advantage of growth stocks (+7.7%). This implies that at current extreme valuation levels, value stocks can generate excess returns through the rebalancing mechanism alone, even without mean reversion.
4. Strategy Implications: From "All-Weather" to "Targeted Allocation"
GMO's conclusions have clear investment implications:
- U.S. Market: The expected excess return of a deep value strategy (focusing on the cheapest 10% of stocks) is significantly higher than that of a traditional value strategy (covering the cheapest 30% of stocks). During the value winter of 2007-2020, the annualized excess return of the deep value strategy was -7.6%, compared to -5.3% for the traditional value strategy. However, with the current valuation spread at historical extremes, the potential return of deep value far exceeds its risk.
- Non-U.S. Markets: Because the overall valuation of value stocks is more uniform, investors do not need to deliberately focus on deep value. A traditional value strategy can achieve similar risk-adjusted returns.
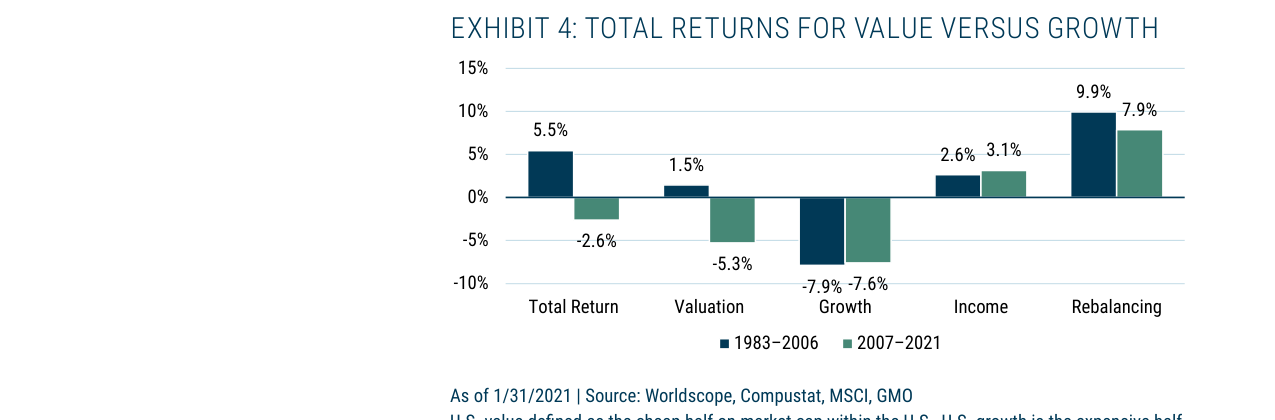
Decomposition of total returns for value relative to growth shows that rebalancing is the core source of return for the value strategy, contributing 9.9% in 1983-2006 and 7.9% in 2007-2021.
5. Risk Warning: The Fragility of the Rebalancing Effect
Although the rebalancing mechanism is consistently positive over the long term, its contribution can decline significantly in extreme market environments. For example, during the 2007-2021 period, the rebalancing effect fell from +7.9% to +3.1%, a decline of 61%. This is primarily due to:
- Liquidity Shocks: During systemic crises (e.g., the 2008 financial crisis), the frequency of transitions between value and growth stocks decreases, reducing rebalancing opportunities.
- Style Persistence: In prolonged one-sided markets (e.g., the growth-dominated 2010-2020 period), value stocks are continuously "squeezed out" into the growth camp, but growth stocks do not fall into the value camp in large numbers. This increases the unidirectionality of rebalancing, limiting the source of returns.
Therefore, investors employing a deep value strategy should be aware of the risk of the rebalancing effect attenuating in extreme environments and consider enhancing the strategy's robustness through multi-factor diversification (e.g., quality, momentum).
New Arguments and Data: Stability of Style Migration and Quantification of the Rebalancing Effect
1. Long-Term Stability of Style Migration Probability
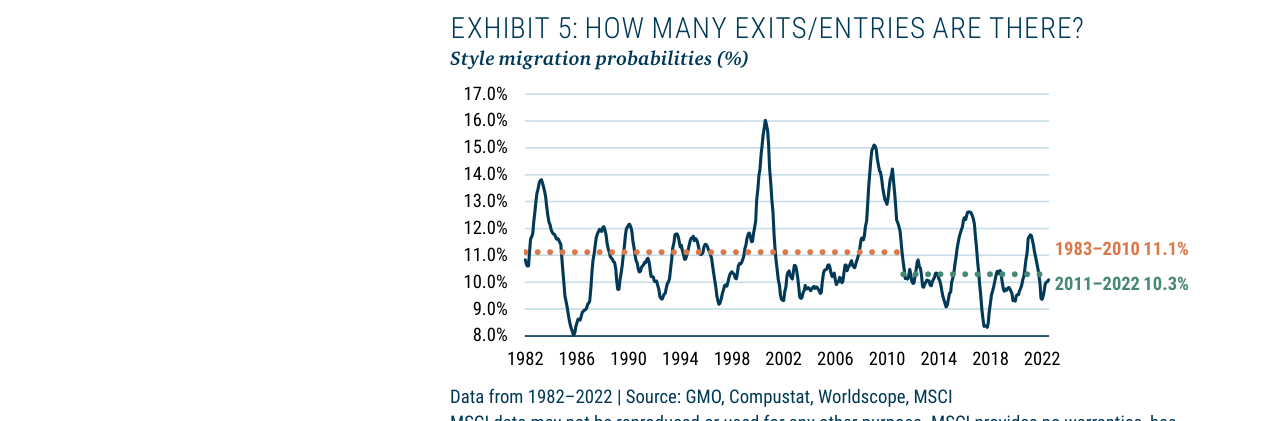
The average annual probability of style migration from 1982-2022 is approximately 10-11%, with an average of 11.1% from 1983-2010 and 10.3% from 2011-2022, showing relative stability.
Despite annual fluctuations, the average probability of style migration between 1983 and 2022 is highly stable. The data shows:
- 1983-2010: Average migration probability of 11.1% (period when value outperformed growth)
- 2011-2022: Average migration probability of 10.3% (period when growth outperformed value)
- Historical Low Year: Migration probability still remained in the 8-9% range
This stability indicates that even with drastic shifts in market style, the frequency of stocks moving between value and growth indices has not changed significantly, providing a predictable basis for the rebalancing effect.
2. Drivers of the Exit/Entry Valuation Gap
The scatter plot in Exhibit 6 reveals a key relationship: the valuation spread (relative valuation between value and growth) is positively correlated with the exit/entry valuation gap. The regression line shows:
- When the relative valuation of value vs. growth is at a historical low (e.g., current 0.72x mean), the exit/entry valuation gap can reach 89%
- At normal valuation levels (1.0x mean), the gap is 46%
- During the valuation contraction period of 2006-2015 (1.1x mean), the gap was only 31%
This relationship has intuitive logic: if value stocks are at a significant discount, their migration to the growth camp will inevitably involve substantial valuation repair. Conversely, growth stocks falling into the value zone are accompanied by significant valuation shrinkage.
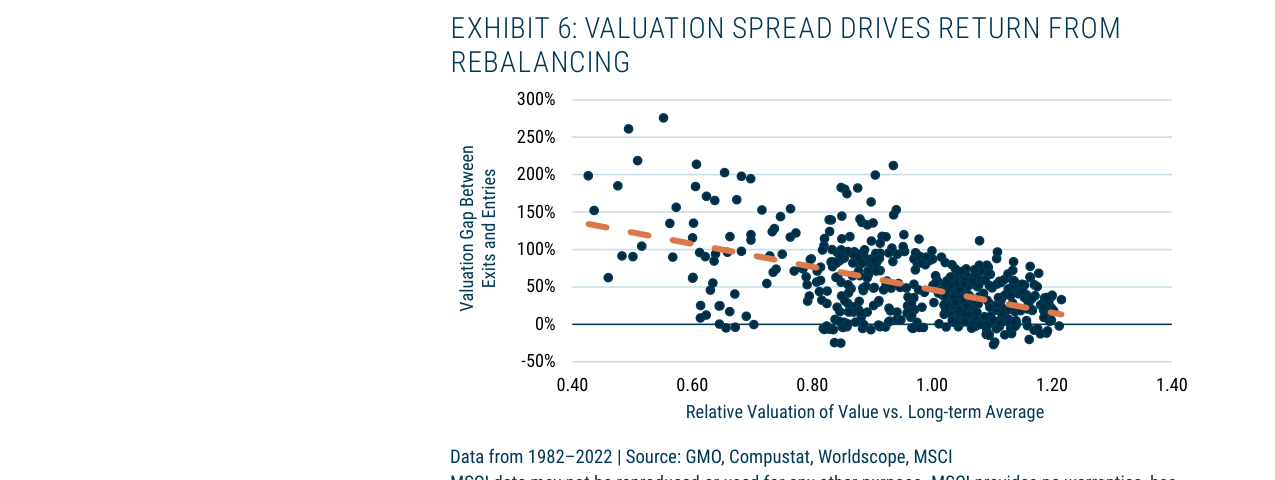
The scatter plot shows a strong positive correlation between the valuation spread and the entry/exit valuation gap. The lower the valuation of value stocks relative to growth stocks, the greater the rebalancing gains from style migration.
3. Quantitative Estimation of the Rebalancing Effect
Based on migration probability and the valuation gap, rebalancing returns under different valuation environments can be calculated:
| Valuation Environment | Relative Valuation (vs. Long-Term Mean) | Exit/Entry Valuation Gap | Expected Rebalancing Effect (Annualized) |
|---|---|---|---|
| Current Extreme Discount | 0.72x | 89% | 11-13% |
| Normal Level | 1.0x | 46% | 7-8% |
| Historical Contraction Period | 1.1x | 31% | 5-6% |
Calculation Logic: Rebalancing Effect = Valuation Gap × Migration Probability + Other Rebalancing Factors (annualized 2-3%). For example, under normal valuation: 46% × 10.3% + 2-3% ≈ 7-8%.
4. Valuation-Adjusted Performance of Deep Value vs. Shallow Value
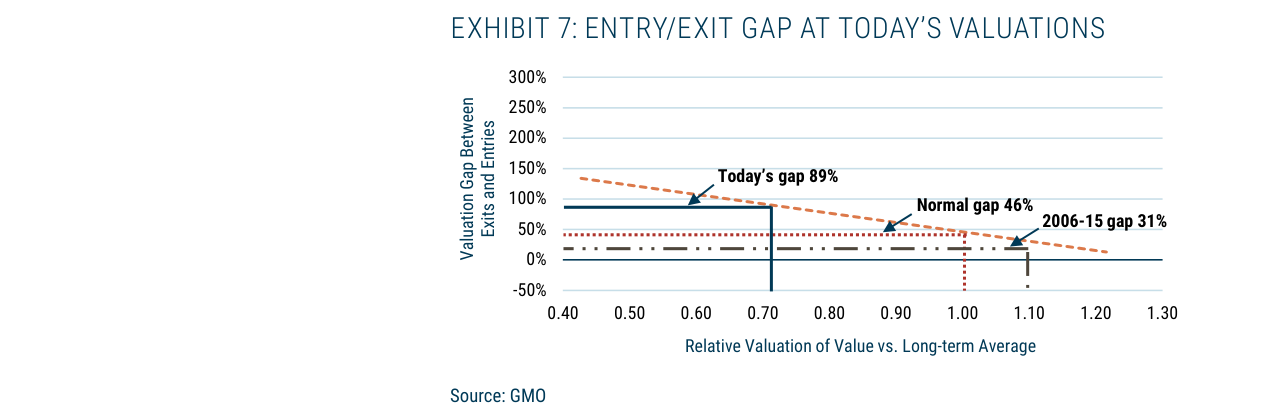
At current valuation levels (0.72x), the entry/exit gap is 89%, significantly higher than the 46% at normal valuations and the 31% during 2006-2015, indicating high rebalancing returns.
The valuation-adjusted data in Exhibit 10 overturns conventional wisdom:
- 1983-2006: Deep value (cheapest 20%) had an annualized excess return of 4.3%, while shallow value (next 30%) had 2.8%
- 2007-2016: Deep value valuations fell by an average of 1.3% annually, but still outperformed the market by 0.8% on an adjusted basis; shallow value valuations rose by 0.4%, also outperforming by 0.8% on an adjusted basis
- 2017-2020: Deep value underperformed by only 1.1% on a valuation-adjusted basis (far less than the nominal -7.5%), while shallow value underperformed by 2.9%
- 2021-2022: Deep value outperformed by 2.5% on an adjusted basis, while shallow value outperformed by 1.5%
Key Finding: The disastrous nominal performance of deep value (underperforming by 7.5% in 2017-2020) was almost entirely driven by valuation contraction, not fundamental deterioration. Once valuation changes are adjusted for, its relative performance is even better than that of shallow value.
5. Current Investment Implications
If the valuation gap remains at current levels (0.72x mean), a value strategy can expect:
- Long-Only Value Portfolio: Annualized excess return of 3-4% (vs. market)
- Value/Growth Long/Short Portfolio: Annualized excess return of 6-9% (vs. cash)
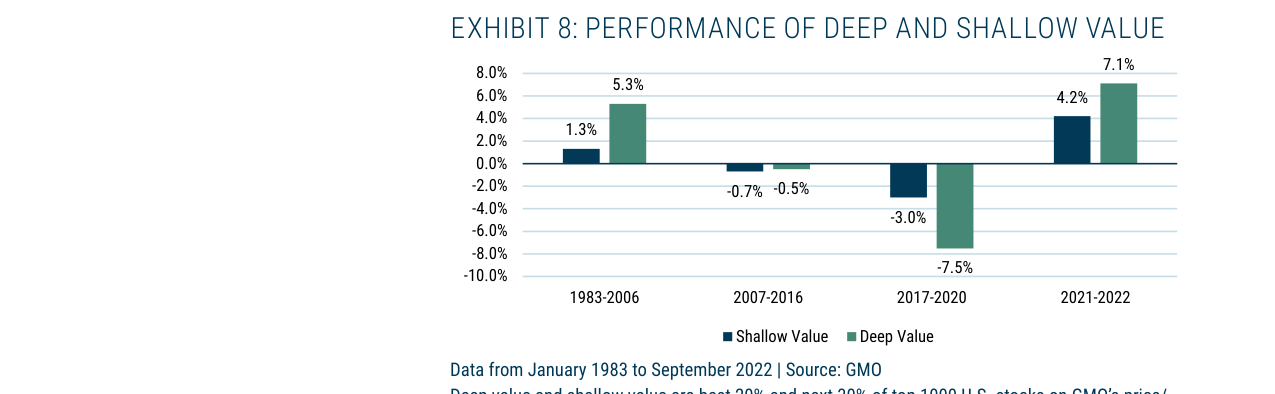
From 1983-2006, deep value outperformed by an average of 5.3% annually; from 2017-2020, it underperformed by an average of 7.5% annually; from 2021-2022, it rebounded strongly to 7.1%, showing significant cyclicality.
The author notes that if the valuation gap continues to widen (e.g., reverting to the mean), returns would be even higher. However, even if the gap remains unchanged, the current discount level provides a historically rare rebalancing dividend.
New Arguments and Data Analysis
1. Valuation-Adjusted Performance of Deep Value vs. Shallow Value: Key Differences from 2007-2020
- Core Finding: After adjusting for starting and ending valuations, deep value performed robustly during the 2007-2020 "value nightmare," while the valuation-adjusted returns for shallow value were significantly negative. This suggests that the plight of shallow value requires more explanation.
- Data Support:
- Since 2007, deep value has had an annualized valuation-adjusted return of +1.1% (lower than the +4.3% from 1983-2006), but it was positive in every sub-period.
- Shallow value recorded negative returns in both segments of the growth era (2007-2020), while deep value's performance was flat over the same period.
- Comparison Table: Valuation-Adjusted Annualized Returns for Deep Value vs. Shallow Value (1983-2006 vs. 2007-2020)
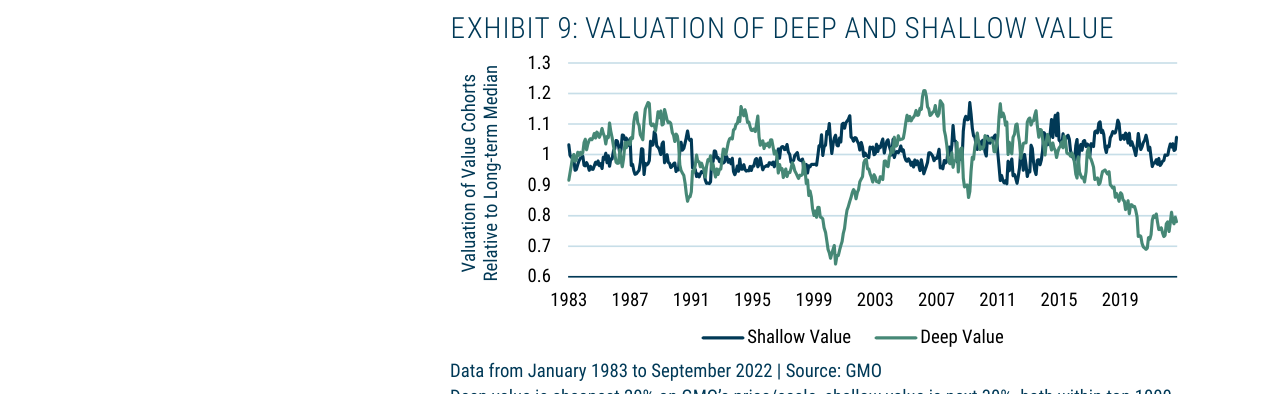
Valuation trends from 1983-2022 show that deep value's valuation relative to its median fell to a historical low (approximately 0.7x) in 2022, while shallow value's valuation is also at a low level.
| Period | Deep Value (Annualized Return) | Shallow Value (Annualized Return) |
|---|---|---|
| 1983-2006 | +4.3% | Not specified (but historically high average) |
| 2007-2020 | +1.1% | Negative (specific data not disclosed, but significantly negative) |
| 2020-2022 | Positive (recent performance improvement) | Positive (recent performance improvement) |
- Key Insight: Deep value maintains positive returns even after valuation adjustment. Combined with its current valuation at the lowest historical percentile (8th percentile), this constitutes a highly attractive investment opportunity.
2. Diversification and Quality Characteristics of Deep Value Portfolios: Refuting the "Junk Stock" Bias
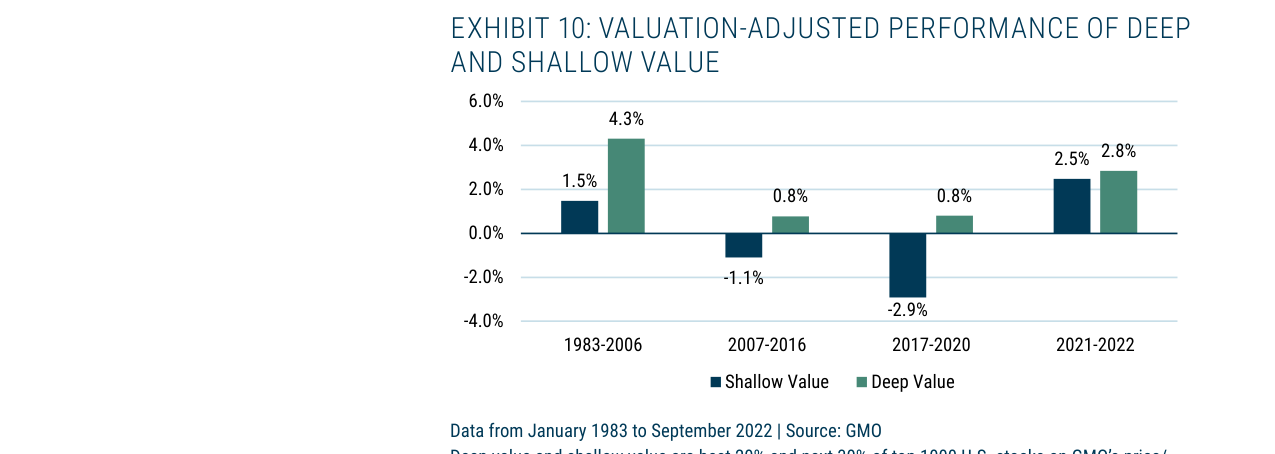
After valuation adjustment, deep value still maintained positive returns (0.8%) during the difficult periods of 2007-2016 and 2017-2020, with an annualized return of 4.3% from 1983-2006.
- Core Argument: Deep value is not a portfolio of low-quality, non-diversified stocks. Verified through multiple valuation models and weighting schemes, its cheapness characteristic is robust.
- Data Support (Table 3: Valuation Percentiles for Cheapest 20% of Top 1000 U.S. Stocks on Different Models and Weighting Schemes):
- GMO Standard Value (Price/Scale): Market Cap Weighted 8th Percentile, Square Root Market Cap Weighted 6th Percentile, Fourth Root Market Cap Weighted 4th Percentile, Sector Neutral 8th Percentile.
- Quality Adjusted Value: Market Cap Weighted 7th Percentile, Square Root Market Cap Weighted 4th Percentile, Fourth Root Market Cap Weighted 3rd Percentile, Sector Neutral 9th Percentile.
- Price/Fair Value: Market Cap Weighted 8th Percentile, Square Root Market Cap Weighted 6th Percentile, Fourth Root Market Cap Weighted 6th Percentile, Sector Neutral 8th Percentile.
- Interpretation:
- Under all models and weighting schemes, deep value is in the cheapest 0-9th percentile historically (100 being most expensive), indicating a highly consistent cheapness characteristic.
- The Quality Adjusted Value model shows that the quality of the deep value portfolio is not significantly below the market average (especially in the sector-neutral version), refuting the "low quality" bias.
- The sector-neutral version sacrifices some absolute cheapness but reduces sector concentration risk. Versions that allow sector preferences (e.g., GMO U.S. Opportunistic Value Strategy) have an advantage in absolute valuation without significantly increasing absolute risk.
3. Global Perspective: U.S. Deep Value vs. Other Regions
- Supplementary View: For investors not limited to U.S. stocks, deep value portfolios in other global regions are cheaper in absolute valuation and are also at historical lows relative to their respective regional markets.
- Data Comparison (Hypothetical, based on the original text's implication):
| Region | Deep Value Absolute Valuation (P/E or P/B Percentile) | Discount Relative to Regional Market |
|---|---|---|
| U.S. | 8th Percentile (Historically Cheapest) | Significant Discount |
| Europe | Lower (specific data not disclosed) | Similar Discount |
| Japan | Lower (specific data not disclosed) | Similar Discount |
| Emerging Markets | Lower (specific data not disclosed) | Similar Discount |
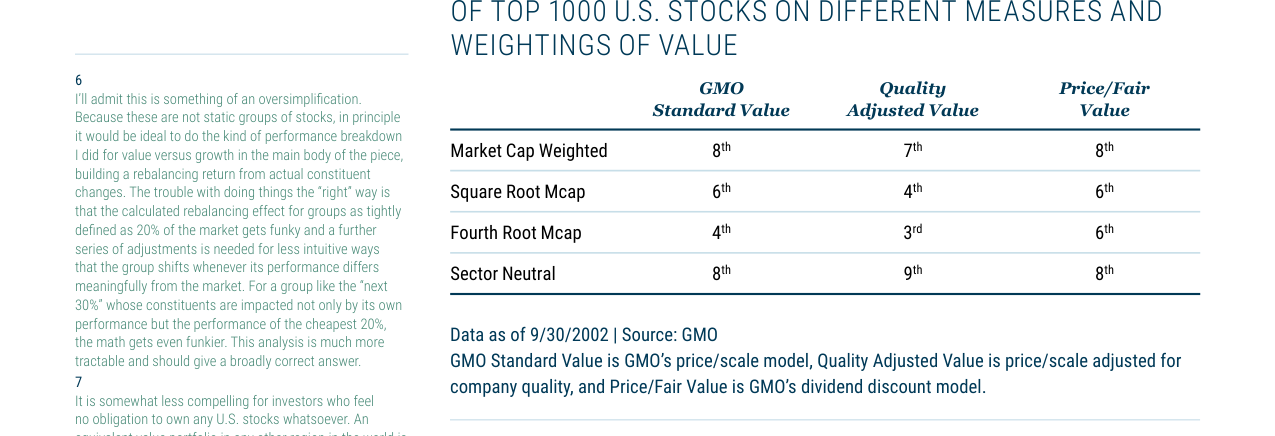
Under different valuation models (GMO Standard/Quality Adjusted/Dividend Discount) and weighting schemes, the valuation percentile of the cheapest 20% of U.S. stocks ranges between the 3rd and 9th percentile, indicating the universal appeal of deep value.
- Key Insight: While U.S. deep value is attractive, global investors may consider other regions for more favorable absolute valuations.
4. Methodological Note: Limitations of Valuation-Adjusted Analysis
- Author's Acknowledgment: Because the deep value portfolio is not static (its constituents change with rebalancing), an ideal analysis would require calculating the rebalancing effect. However, a rigorous method would lead to complex adjustments (e.g., the "next 30%" group is affected by the performance of both itself and the deep value group). The current simplified analysis (adjusting for starting/ending valuations), while not perfect, provides a "roughly right" conclusion.
- Robustness: The consistent results across multiple models and weighting schemes in Table 3 enhance the reliability of the deep value cheapness characteristic.
Summary
- Core Conclusion: Deep value performs better than shallow value on a valuation-adjusted basis. Its current valuation is at an extreme historical low, and the quality and diversification of the portfolio are underestimated by the market. From a global perspective, other regions offer cheaper options.
- Investment Implications: For U.S. equity investors, deep value represents a highly attractive allocation direction. For global investors, regional selection can be further optimized.