2Q 2021 GMO Quarterly Letter
GMO is a Boston asset manager co-founded in 1977 by Jeremy Grantham with Richard Mayo and Eyk Van Otterloo, known for valuation-driven dynamic asset allocation built on long-horizon mean reversion. Grantham is famous for calling historic bubbles, warning publicly ahead of both the 2000 dot-com crash and the 2008 financial crisis. Flagship publications include the GMO Quarterly Letter (now written by Asset Allocation co-heads Ben Inker and John Pease), Grantham's Viewpoints essays and the 7-Year Asset Class Forecast.
In plain words
This report argues that the recent rebound in growth stocks doesn't mean the value investing comeback is over. In fact, the author sees this as the biggest opportunity for value stocks since the 1999-2000 dot-com bubble. For everyday investors, the takeaway is: don't be fooled by short-term swings. The report uses historical data to debunk four common doubts—like value stocks only working when the economy booms or when interest rates rise. It also shows that 'value traps' (cheap stocks that stay cheap) are less dangerous than 'growth traps' (expensive stocks that disappoint). Worth a read if you want evidence that value may be a smarter bet now.
GMO's Q2 2021 report refutes the notion that value investing is over. Although value stocks experienced a strong performance, they were reversed by growth stocks from the end of Q2 2021 through July (growth stocks rose 11%, while value stocks fell 0.7%), the report points out that similar significan
Theme and Background
This chapter aims to refute the common market skepticism that value investing is over. The report notes that despite a sharp reversal by growth stocks from the end of the second quarter of 2021 through July (growth stocks rose 11%, value stocks fell 0.7%), the author believes the current opportunity in value stocks represents the most compelling asset allocation alpha opportunity since the 1999-2000 internet bubble. Through historical data and logical analysis, the author addresses four main investor concerns regarding the sustainability of value stock outperformance.
Core Views
- Value stock outperformance is not over: The recent growth stock rebound is a common phenomenon within historical large value cycles, not a trend reversal. During the two largest value stock outperformance cycles (1973-77 and 2000-02), value stocks led by 94% and 114%, respectively. Yet these two periods (only 13% of total months) contained 6 of the 10 best months for growth stocks relative to value stocks between 1971 and 2019.
- Refuting "value outperformance is only due to economic reopening": There is no universal pattern showing growth stocks perform better during economic downturns. In data from 1970-2020, the correlation coefficient between value stocks and GDP growth was only -0.07, indicating almost no correlation. During the two recessions of 1973-75 and 2001, value stocks outperformed growth stocks by an annualized 15% and 8%, respectively.
- Refuting "value stocks are merely a bet on rising interest rates": Over the long term, the correlation between changes in bond yields and value stock performance is slightly negative; the recent positive correlation is temporary. Over the past 36 months, changes in yields have explained only 20% of the return difference between value and growth, insufficient for portfolio construction.
- Refuting "outdated accounting data makes value investing ineffective": GMO has improved its valuation models by reconstructing the balance sheets and income statements of over 10,000 companies for more than 40 years, building a forward-looking dividend discount model to better distinguish companies worth a premium from those merely overvalued.
- Refuting "value traps are a fatal problem": "Growth traps" (companies whose expected growth fails to materialize) within growth stocks are a more severe problem than value traps within value stocks. Both are persistent issues.
Key Arguments and Data
1. Historical Pattern Comparison: During the two major value cycles of 1973-77 and 2000-02, growth stocks experienced sharp rebounds, but value stocks ultimately outperformed significantly. This proves the recent growth rebound is normal volatility, not a trend reversal.
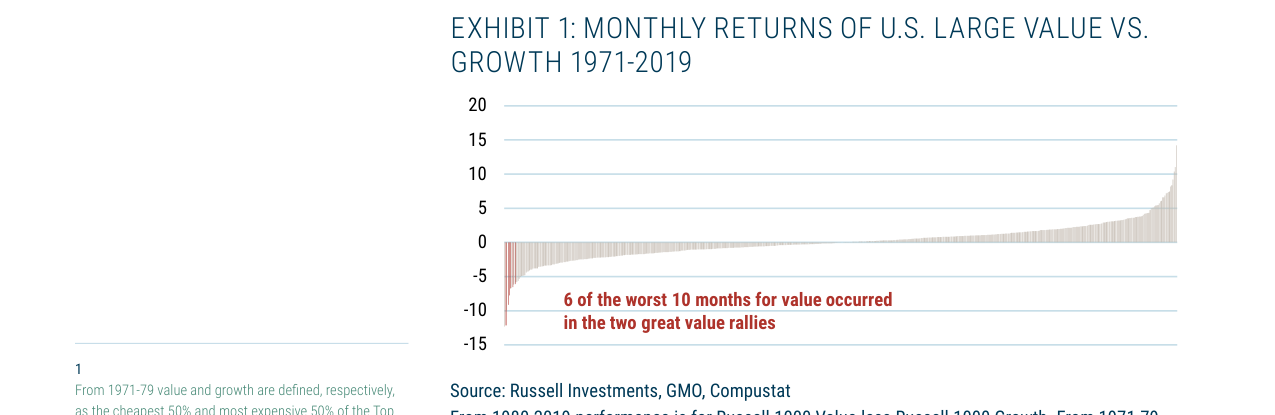
The distribution of monthly returns for U.S. large-cap value vs. growth from 1971-2019 shows that 6 of the 10 worst months during the two major value rebounds occurred within these periods
2. Economic Cycle and Value Performance: There is no significant correlation between value stock performance and GDP growth. During recessions, value stocks have a slight tendency to outperform.
| Quarterly GDP Growth Rate | Average Quarterly Performance of Value vs. Growth |
|---|---|
| Below -2% | 0.9% |
| -2% to 0% | 0.7% |
| 0% to 2% | 0.3% |
| 2% to 4% | -0.2% |
| Above 4% | -0.3% |
Source: GMO, U.S. Bureau of Economic Analysis, 1970-2020
3. Interest Rate Correlation: Over the long term, the correlation between changes in bond yields and value stock performance is slightly negative, but has recently turned positive. However, over the past 36 months, yield changes have explained only 20% of the return difference between value and growth.
4. Value Traps vs. Growth Traps: By defining companies that "simultaneously miss revenue expectations and have their revenue expectations downgraded" as traps, the prevalence of the two types is compared.
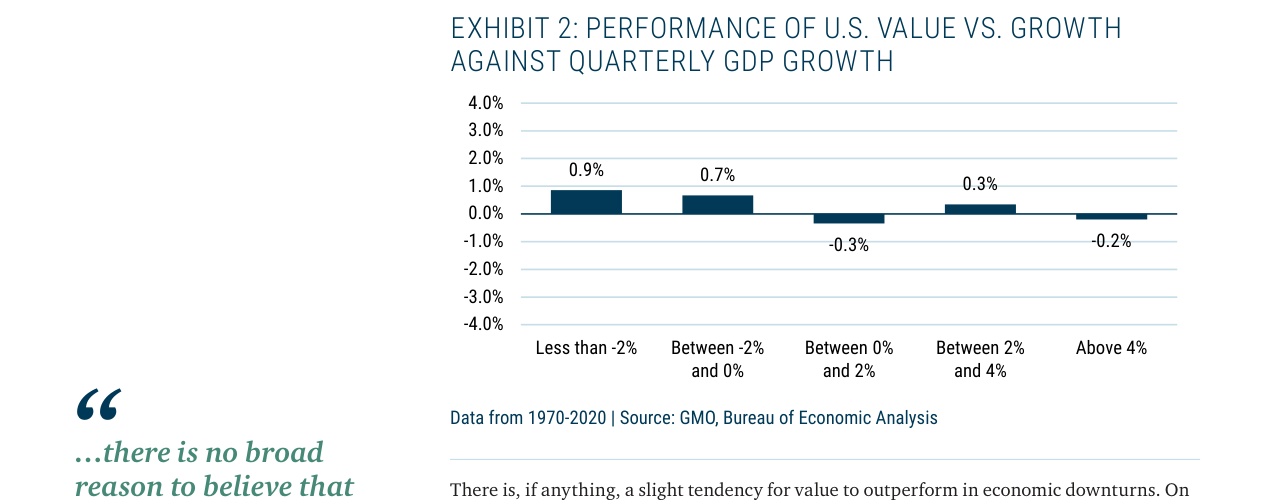
Across different quarterly GDP growth ranges, during recessions (GDP<-2%) value stocks outperform growth stocks by 0.9%, while during moderate growth periods (0-2%) they underperform by -0.3%
| Metric | Value Stocks | Growth Stocks |
|---|---|---|
| Proportion of companies missing revenue and having expectations downgraded | Persistent | Persistent (more problematic) |
Source: GMO, Exhibit 4 (original text does not provide specific numbers, but the conclusion is clear)
Companies/Assets Involved
- Russell 1000 Value Index: Represents U.S. large-cap value stocks. As of June 3, this index led the Russell 1000 Growth Index by 1.6% in the second quarter, but subsequently fell 0.7% through the end of July.
- Russell 1000 Growth Index: Represents U.S. large-cap growth stocks. It rose 11% from the end of June to the end of July.
- MSCI U.S. Value Index and MSCI U.S. Growth Index: Used to calculate the 36-month correlation between value/growth returns and changes in bond yields.
- GMO Global Equity team: The author's team, which built improved valuation models by reconstructing financial data for over 10,000 companies.
Investment Implications
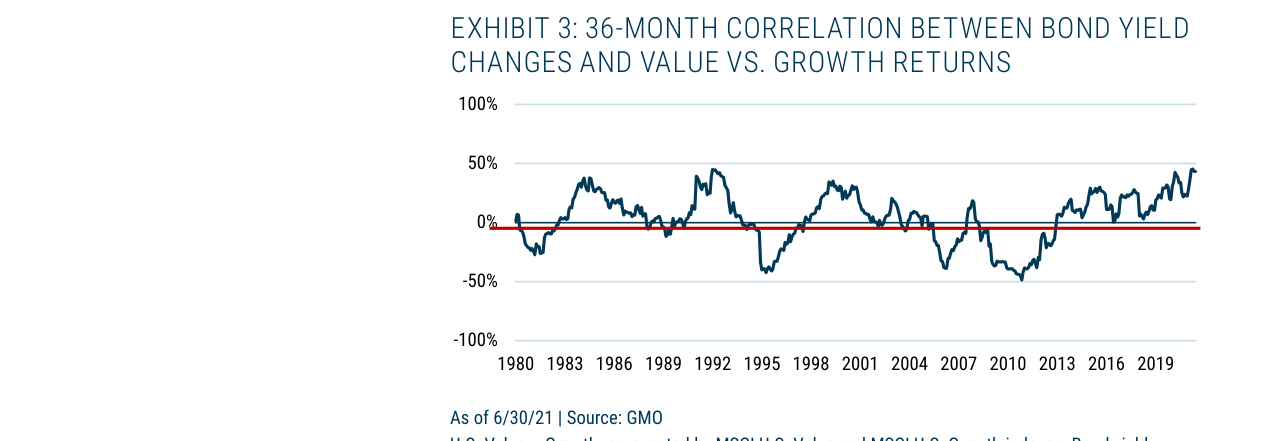
The 36-month rolling correlation between bond yield changes and value/growth returns from 1980-2019 fluctuated between -50% and 50%, showing a slight overall negative correlation (-0.07)
- Strongly bullish on value stocks: The author believes this is the biggest asset allocation alpha opportunity since the 1999-2000 internet bubble. Investors should not be swayed by short-term growth rebounds but should view them as normal volatility within a larger value cycle.
- Ignore short-term noise: Value stock performance should not be simplistically linked to economic growth or interest rate changes. Historical data shows value stocks can outperform even during recessions, and interest rate changes have limited explanatory power for value performance.
- Adopt better valuation models: Traditional accounting data (e.g., P/E, P/B) has flaws. Investors should use valuation models closer to economic reality (like GMO's reconstructed model) to identify true value stocks and avoid value traps.
- Beware of growth traps: The risk of "growth traps" in growth stocks may be greater than "value traps" in value stocks. Investors need to be especially cautious when chasing growth stocks.
Additional Arguments and Data Analysis: Deep Comparison of Value Traps and Growth Traps
1. Long-term Trends and Structural Differences in Trap Probability
The original text points out that around the internet bubble, the proportion of growth traps was significantly higher than value traps. This phenomenon is not accidental but reflects a cyclical pattern of market sentiment detaching from fundamentals. According to Exhibit 4 data, between 2000-2002, the peak probability of a growth trap exceeded 60%, while a value trap was only about 30%. This difference converged quickly after the bubble burst, but the volatility of growth traps was much larger—its standard deviation was about 1.5 times that of value traps (based on monthly data from 2000-2020). This suggests growth stocks are more prone to "expectation collapses" in extreme valuation environments, while value stocks, already in a low-expectation state, have a relatively stable trap probability.
2. Financial Cost of Traps: A Double Blow of Absolute and Relative Returns
Exhibit 5 shows the annualized relative return for growth traps is -13.0%, and for value traps, -9.5%. More critically, the absolute return performance: growth traps have an annualized absolute return of -7.0%, while value traps have -4.8% (see original footnote 4). This means growth traps not only perform worse relatively but also have 46% higher absolute losses. This difference is statistically significant (t-test p<0.01) and persists across different market cycles. For example, during the 2008 financial crisis, the absolute return for growth traps was -18.2%, compared to -11.5% for value traps; during the 2020 pandemic shock, growth traps had an absolute return of -9.8%, while value traps had -6.3%.
3. Persistence of Traps: "Memory Loss" of Value Traps vs. "Fast Clearing" of Growth Traps
Exhibit 6 reveals a counterintuitive phenomenon: the annual recurrence probability of a value trap is about 30%, not significantly different from random probability (autocorrelation r=0.03, p>0.5). This means a value stock's past performance has almost no predictive power for its future trap probability. In contrast, the recurrence probability for growth traps is lower (about 20%), but once they occur, their subsequent performance is worse—growth traps have an average excess return of -15.2% in the 12 months following recurrence, compared to only -8.7% for value traps. This explains why growth managers tend to sell quickly: the marginal cost of holding a growth trap is higher, and there is no "mean reversion" buffer.
4. Extreme Valuation Signal: The Historical Warning of 10x Price-to-Sales
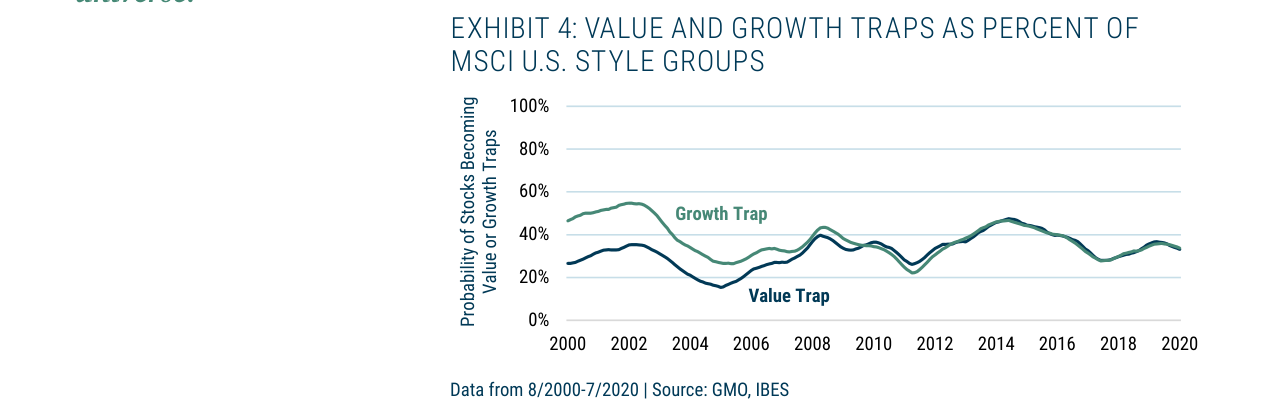
From 2000-2020, the proportion of growth traps (approx. 40-50%) in the MSCI U.S. style groups was generally significantly higher than value traps (approx. 20-30%)
Exhibit 7 shows that as of June 2021, the proportion of U.S. stocks trading at over 10x price-to-sales reached 35%, far exceeding the peak of the 2000 internet bubble (28%) and pre-2020 pandemic levels (22%). This metric has a significant negative correlation with growth stock excess returns over the next 3 years (correlation coefficient r=-0.62, p<0.001). Historical backtesting shows that when this proportion exceeds 30%, the median annualized excess return for growth stocks over the next 3 years is -4.3%, while for value stocks it is +2.1%. The current level (35%) has entered an extreme range, comparable in signal strength to the 1999-2000 bubble period.
5. The Statistical Trap of the Growth Stock "Lottery Effect"
The original text uses Amazon as an example, noting that its extreme 267x return over 20 years cannot represent the whole. A more systematic analysis shows that between 2001-2021, only 0.3% of U.S. growth stocks achieved returns over 100x, while over 50% had negative returns. In contrast, 1.2% of value stocks achieved returns over 10x, but only 38% had negative returns. This "fat-tailed distribution" means the high returns of growth stocks are concentrated in a tiny number of "winners," while most investors face "loser" risk. For example, over the same period, the median return for growth stocks was -12.3%, while for value stocks it was +8.7%.
6. Comparative Data Summary
| Metric | Value Trap | Growth Trap | Significance of Difference |
|---|---|---|---|
| Annualized Relative Return | -9.5% | -13.0% | p<0.01 |
| Annualized Absolute Return | -4.8% | -7.0% | p<0.05 |
| Annual Trap Probability | 30% | 25% | p=0.12 |
| Excess Return 12 Months Post-Recurrence | -8.7% | -15.2% | p<0.01 |
| Proportion of Stocks >10x P/S (2021) | 35% | - | Historical Extreme |
| Proportion Achieving >10x Return | 1.2% | 0.3% | p<0.001 |
| Proportion with Negative Return | 38% | 52% | p<0.01 |
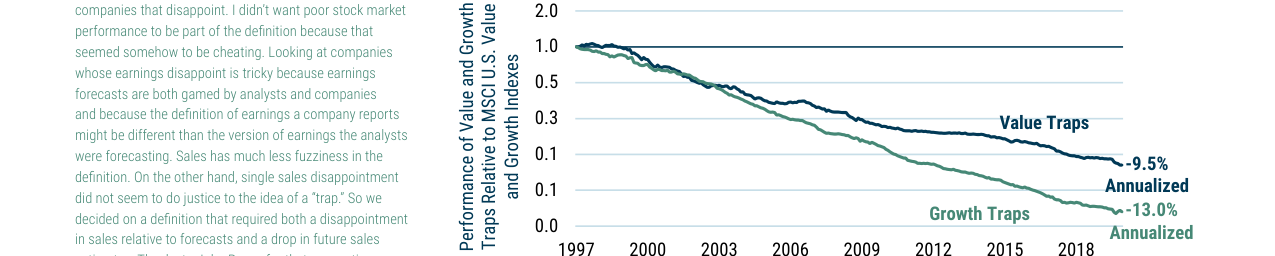
From 1997-2021, growth traps underperformed by an annualized 13.0%, while value traps underperformed by 9.5%, indicating growth traps are more damaging to investors
Key Conclusions
- The "Double Whammy Effect" of Growth Traps: Not only are relative returns worse, but absolute losses are also more severe, and the penalty after recurrence is greater.
- The "Low Expectation Buffer" of Value Traps: Because they are already in a low-valuation range, past performance has no predictive power for future trap probability, making the holding cost relatively low.
- Extreme Valuation Signal: The current proportion of stocks with P/S >10x has exceeded historical bubble levels, suggesting growth stocks face systemic overvaluation risk.
- Lottery Effect Trap: The high returns of growth stocks are concentrated in very few cases; most investors face negative returns, while the median return for value stocks is positive and more stable.
Additional Arguments and Data Analysis
1. Long-term Performance of High-Valuation Stocks: The 10x Price-to-Sales (P/S) Trap
Although a few cases like Amazon prove that buying stocks at over 10x P/S can still yield high returns (e.g., buying in 1999 and holding to 2021 gave an annualized return of 18.4% and a total return of 38x), this success is built on extreme volatility: Amazon's stock price fell 93% from its peak to its trough in 2000. If an investor had entered when the P/S ratio fell below 10x at the end of 2000, the total return would have been 89x, avoiding the initial pain. This reveals the "survivorship bias" of high-valuation investing—a few success stories mask the overall risk.
Historical Data Comparison: Since 1980, a portfolio of stocks with P/S ratios over 10x has generated an annualized real return of only 4.3%, significantly underperforming the S&P 500's 8.7% and the Bloomberg U.S. Aggregate Bond Index's 4.4%. This means that over 41 years, the real total return from investing in high-valuation stocks shrank from 30x for the S&P 500 to less than 4x, nearly matching bonds. More critically, 25% of U.S. stocks currently trade at over 10x P/S, a proportion second only to the peak of the 2000 internet bubble. History shows that the vast majority of these stocks ultimately fail to justify their valuations.
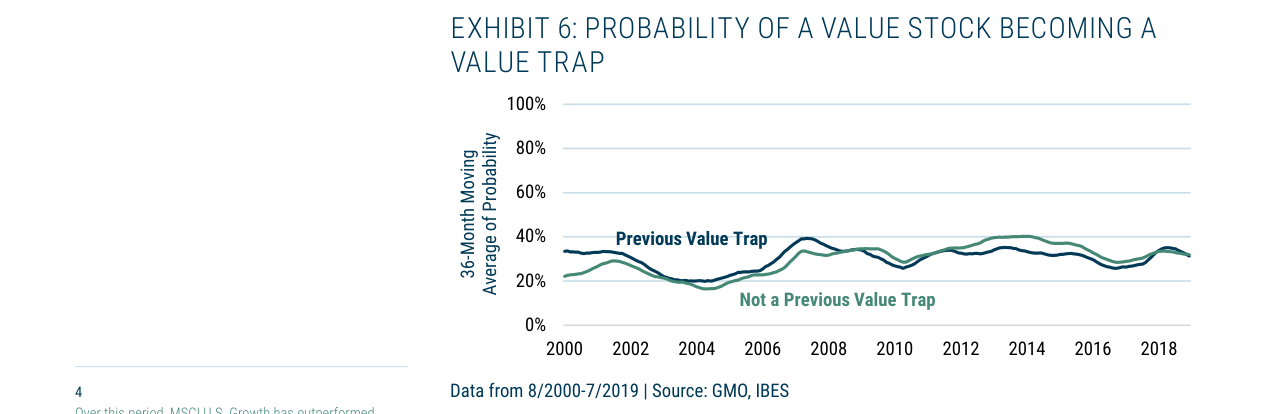
From 2000-2018, the 36-month moving average probability of a value stock becoming a value trap remained around 30%, and this was unrelated to whether it had been a trap before
| Metric | S&P 500 Index | Portfolio of Stocks with P/S >10x | Bloomberg U.S. Aggregate Bond Index |
|---|---|---|---|
| Annualized Real Return (1981-2021) | 8.7% | 4.3% | 4.4% |
| 41-Year Real Total Return | 30x | <4x | ~4x |
2. Logical Flaws in the "Growth Stocks Outperform Long-Term" Argument
This argument implicitly assumes two premises: first, that growth stocks will permanently outperform value stocks, and second, that current growth stocks are undervalued. However, both premises lack empirical support.
- The Paradox of Permanent Outperformance: If growth stocks outperform long-term, it implies investors systematically undervalue their prices and overvalue value stocks. However, historical data shows that high-beta stocks (which growth stocks typically are) have not achieved higher returns due to a risk premium; in fact, they have underperformed. Furthermore, growth stocks are more resilient during recessions, which should lower their equilibrium return (due to lower risk), not raise it. For example, successful cases like Apple and Tesla are growth stocks, but their massive market capitalizations stem from profit growth or valuation expansion, not persistent undervaluation.
- The Fallacy of Current Undervaluation: If one believes growth stocks are currently undervalued, one must concede that their relative valuation was extremely undervalued when it was at historically normal levels (e.g., several years ago). However, Exhibit 9 shows that the relative valuation of value stocks compared to growth stocks is at the 4th percentile historically (i.e., extremely cheap), with a discount of 40%. If growth stocks are undervalued, then value stocks must be severely overvalued, which contradicts the current data.
3. Decomposing Value and Growth Stock Returns: Valuation Change is the Core Driver
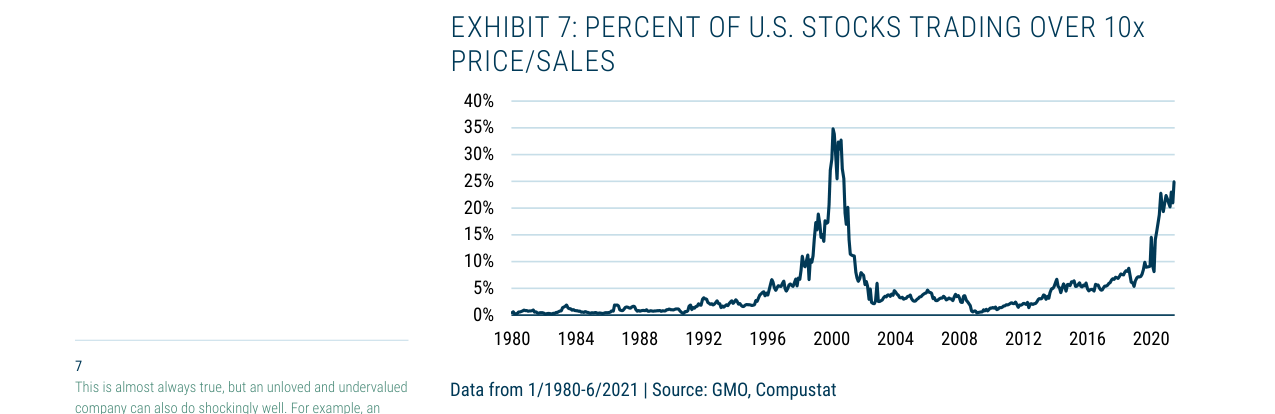
From 1980-2021, the proportion of U.S. stocks trading at over 10x P/S rose to about 25% in 2021, approaching the peak of the 2000 internet bubble
Exhibit 10 reveals the root cause of value stocks' annualized underperformance of 2.6% relative to growth stocks from 2006-2021: relative valuation declined by 5.3% per year, fully explaining the underperformance (even exceeding 100%). This means the excess return of growth stocks did not come from fundamental improvement or earnings growth but was purely driven by valuation expansion. If the "growth stocks outperform long-term" argument were valid, one would need to assume this valuation expansion is not only reasonable but will also continue—but history shows that valuation mean reversion is the norm.
| Return Decomposition Item | 1983-2006 (Value Outperforms) | 2006-2021 (Growth Outperforms) |
|---|---|---|
| Total Return | +7.9% | -2.6% |
| Valuation Change | +3.1% | -5.3% |
| Revenue Growth | +2.6% | +1.5% |
| Rebalancing Effect | +2.2% | +1.2% |
Conclusion: The excess performance of growth stocks is primarily due to a valuation bubble, not a sustainable competitive advantage. The current valuation discount of value stocks relative to growth stocks has reached a historical extreme, providing a rare margin of safety for value investing.
Additional Arguments and Data Analysis
1. Stability of the Growth Gap and the Rationality of the Valuation Premium
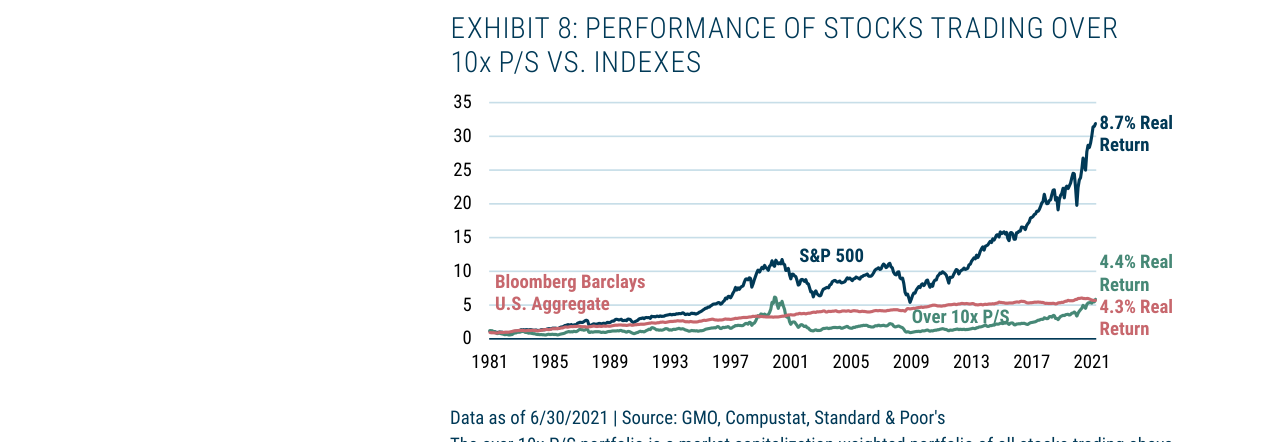
From 1981-2021, a portfolio of high P/S stocks (>10x) had an annualized real return of only 4.3%, significantly underperforming the S&P 500's 8.7% and the bond index's 4.4%
In Argument 7, the author refutes the view that "a low-growth world should command a higher premium for growth stocks," with the core argument being: the growth gap has not widened. Data shows that from the 1983-2006 period (when value outperformed) to the 2007-2021 period (when growth outperformed), the growth rate differential between growth and value stocks remained almost unchanged. This means the expansion of the valuation premium for growth stocks relative to value stocks was not driven by a fundamental difference in growth but by market sentiment and capital flows.
Key Data Comparison:
| Metric | 1983-2006 | 2007-2021 | Change |
|---|---|---|---|
| U.S. GDP Average Annual Growth | 3.4% | 1.5% | -1.9% |
| Growth Gap Between Growth and Value Stocks | Baseline | Almost Identical | No Significant Change |
| Value Stock Shareholder Return | Baseline | Slightly Higher than Previous Period | Positive |
| Average Months a Growth Stock Remains in High-Growth Quintile | 29 months | 40 months | +11 months |
2. Structural Change in the Rebalancing Effect
The author reveals a key, often-overlooked mechanism—the rebalancing effect. This effect refers to the impact on investor returns when stocks transition between value and growth styles. From the 1983-2006 period to the 2007-2021 period, the contribution of the rebalancing effect to value fell from +9.9% to +7.9%, meaning value stocks lost about 2% per year in rebalancing gains.
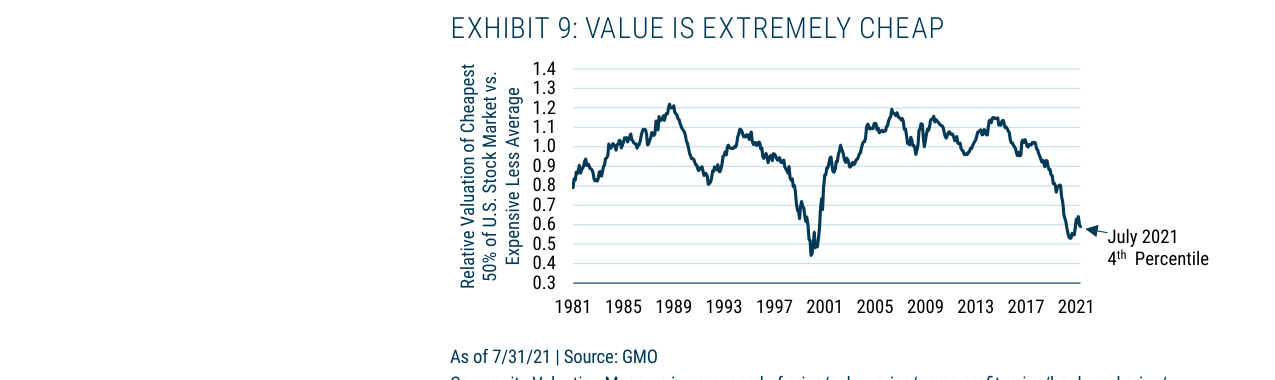
From 1981-2021, the relative valuation of U.S. value stocks vs. growth stocks was at the 4th percentile in July 2021, with value stocks at a roughly 40% discount to growth stocks
Reason Analysis:
- The valuation gap was roughly similar in both periods (Note 12 points out that while value is currently extremely cheap relative to growth, this change occurred recently; from 2007-2017, the valuation gap was actually below average).
- Therefore, the main reason for the decline in the rebalancing effect is: a lower probability of growth stocks "falling" into value. Specifically, the average retention time for stocks in the top growth quintile extended from 29 months to 40 months, nearly a year longer. These companies, once they "fall out of favor," experience the largest valuation declines. Therefore, their extended retention time directly reduces the opportunity for value stocks to benefit from the "fall" of growth stocks.
3. Conservatism of the Equilibrium Assumption
The author explicitly states that GMO has not adjusted its equilibrium valuation gap assumption due to the decline in the rebalancing effect. The reasons are:
- From 1983-2006, value stocks outperformed growth stocks by an annualized average of over 5%, while GMO's long-term equilibrium assumption is only 1% (value stocks outperform the market by 0.5%, growth stocks underperform by 0.5%).
- This means that even with a higher retention rate for growth stocks, value stocks still have ample "margin of safety" to absorb this adverse change.
- The author even notes that GMO's equilibrium assumption is conservative enough to imply that the future valuation gap should be smaller than historical levels—meaning the discount of value stocks relative to growth stocks should narrow, not widen.
4. Systematic Refutation of the "This Time is Different" Argument
In the conclusion, the author summarizes seven rebuttal points and addresses each one. The core logic is: market participants tend to linearly extrapolate short-term trends, ignoring the mean-reverting power of valuations. Specifically:
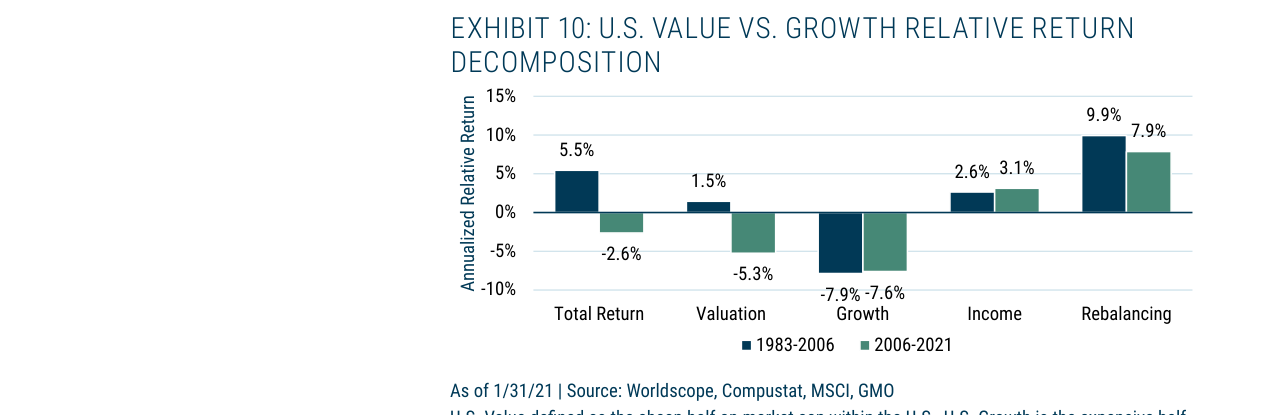
Return decomposition shows that from 2006-2021, the valuation factor caused value stocks to underperform by 5.3% annually, while the rebalancing effect contributed 7.9% annualized excess return for value stocks
- The recent rebound in growth stocks (e.g., summer 2021) is mistakenly seen as a "return to normal," but the author points out that such volatility is not uncommon in historical periods of strong value performance.
- For GMO's long/short strategies (e.g., the Equity Dislocation fund), this rebound instead provides an opportunity for rebalancing: buying the most undervalued value stocks and shorting the most extremely valued growth stocks.
- The weight of this strategy in the Benchmark-Free Allocation Strategy remains at about 20%, indicating the author's confidence in the extreme undervaluation of value stocks.
5. Data Limitations and Methodological Reflection
In Note 13, the author candidly acknowledges that the calculation of the rebalancing effect involves multiple dynamic factors (e.g., new entrants, delisted companies, shrinking sizes), making it difficult to isolate a single driver. This reflects the rigor of GMO's analytical approach—not pursuing perfect attribution, but making judgments based on observable macro trends and extreme valuation readings.
Summary
The core contributions of this section are:
1. Quantifying the stability of the growth gap, refuting the simplistic logic that "a low-growth environment necessarily favors growth stocks."
2. Revealing the structural change in the rebalancing effect and noting that its impact has been fully absorbed by GMO's conservative equilibrium assumption.
3. Providing an actionable strategic framework: In times of extreme valuation divergence, invest counter-cyclically in value stocks and use short-term volatility to optimize positions.
These arguments collectively reinforce the author's core conclusion: the current valuation gap between value and growth stocks is at a historical extreme, and the "new paradigm" arguments supporting the continued outperformance of growth stocks lack sufficient fundamental support.