An Expensive Market Need Not Mean Expensive Stocks
GMO is a Boston asset manager co-founded in 1977 by Jeremy Grantham with Richard Mayo and Eyk Van Otterloo, known for valuation-driven dynamic asset allocation built on long-horizon mean reversion. Grantham is famous for calling historic bubbles, warning publicly ahead of both the 2000 dot-com crash and the 2008 financial crisis. Flagship publications include the GMO Quarterly Letter (now written by Asset Allocation co-heads Ben Inker and John Pease), Grantham's Viewpoints essays and the 7-Year Asset Class Forecast.
In plain words
This report argues that while the U.S. stock market looks very expensive (its price-to-earnings ratio is double the historical average), that's mostly because high-growth companies like Apple and Amazon now make up a bigger share, and COVID temporarily depressed earnings—not because all stocks are overvalued. For regular investors, the key takeaway is: don't blindly bet against the market just because it seems pricey. Instead, focus on individual companies. For example, half of the FAANG stocks actually trade below their own long-term average valuations. Worth a read because it breaks down the real reasons behind the market's high price tag, helping you avoid oversimplified conclusions.
A GMO research report points out that although the S&P 500's price-to-earnings (P/E) ratio stands at 32.6x—86% above the historical median of 17.5x and seemingly expensive—this elevated valuation is primarily driven by structural changes in the index's constituent composition and temporary pandemic-
Theme & Background
This chapter examines the seemingly high overall valuation of the U.S. stock market (S&P 500 P/E ratio) and analyzes the structural factors behind it. The market context is that the current S&P 500 P/E ratio (32.6x) is significantly above its historical median (17.5x), raising concerns about whether the market is overvalued.
Core Thesis
The author's central argument is that the S&P 500's high P/E ratio is primarily driven by structural changes in the index's composition (an increased weight of high-P/E companies) and the temporary impact of the pandemic on earnings, rather than a broad-based valuation expansion across all companies. After adjusting for a "like-for-like" comparison, valuations are not extreme. The author is confident in the valuations of the GMO Quality Strategy's holdings and believes the strategy can continue to generate strong returns.
Counter-Intuitive Judgment: The risk of an overall market overvaluation is exaggerated; high-P/E companies (e.g., those benefiting from long-term trends or stable growth) are reasonably priced and performing well, not signaling a valuation bubble.
Key Arguments & Data
- S&P 500 P/E Status: As of March 31, 2021, the P/E ratio was 32.6x, 86% higher than the historical median of 17.5x.
- Valuation Premium Decomposition: Through a "like-for-like" analysis, the 86% premium is broken down into three factors:
- Mix & Composition Effect: Increased weight of high-P/E companies, contributing 63 percentage points (11.0x).
- Pandemic Earnings Impact: Earnings in 2020 were hit by the pandemic, contributing 4 percentage points (0.8x).
- Like-for-Like Valuation Expansion: Contributed only 19 percentage points (3.3x). After adjustment, the valuation is only 20% above the historical median; further excluding the pandemic impact, it is only 16% higher.
- Historical Comparison: The current 16% like-for-like valuation premium is far below the extreme levels seen during the 1999 tech bubble.
- Data Table:
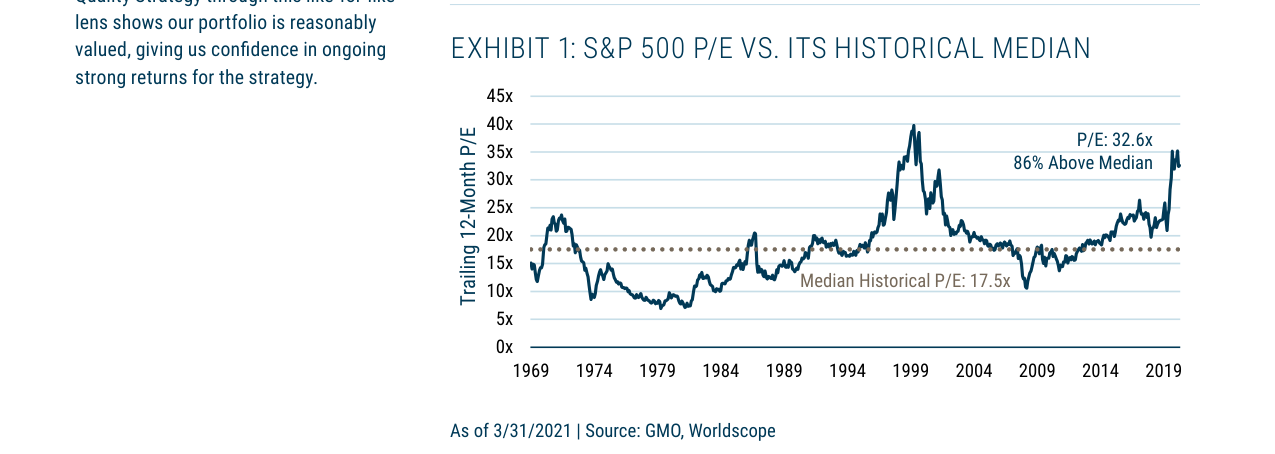
The S&P 500's current P/E of 32.6x is 86% above its historical median of 17.5x, reaching its highest level since the internet bubble.
| Factor | Contribution (P/E Multiple) | Contribution (Percentage) |
|---|---|---|
| Mix & Composition Effect | 11.0x | +63 ppts |
| Pandemic Earnings Impact | 0.8x | +4 ppts |
| Like-for-Like Valuation Expansion | 3.3x | +19 ppts |
| Current P/E Ratio | 32.6x | +86% |
- Like-for-Like Index: Exhibit 3 shows that the S&P 500 like-for-like P/E index is currently 20% above its historical median, or 16% above after adjusting for the pandemic. The historical median is 1.1x (due to survivorship bias and market-cap weighting effects).
Companies/Assets Involved
- GMO Quality Strategy: The author's managed strategy, whose holdings are reasonably valued and have historically traded at a premium to the market P/E without hindering excess returns. The author believes attractive investment opportunities can still be found.
- S&P 500 Constituents: The overall subject of analysis. The author emphasizes that the increased weight of high-P/E companies (e.g., growth stocks) is the primary driver of the index's higher valuation, not a broad expansion across all companies.
Investment Implications
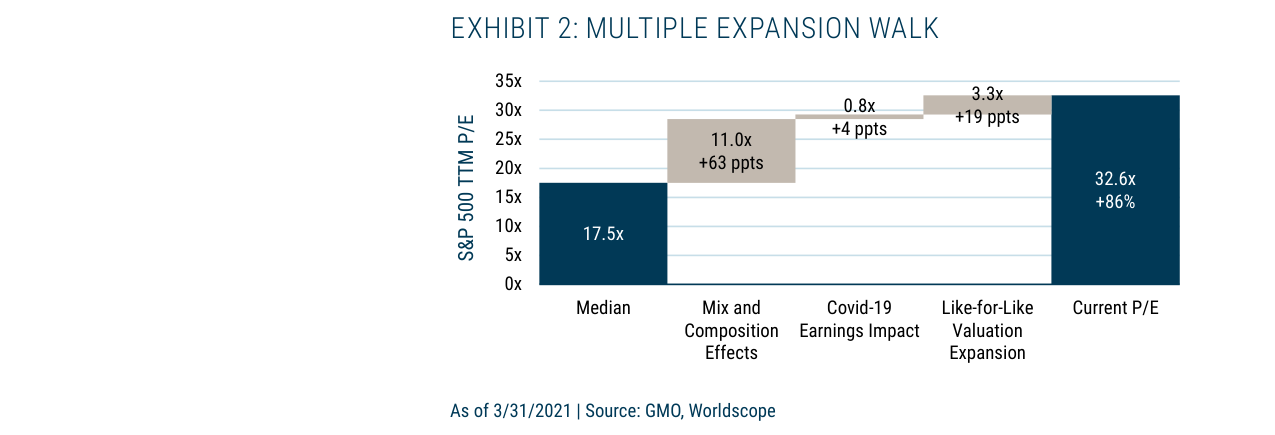
The S&P 500 P/E rose from 17.5x to 32.6x, with the change in index composition contributing 11.0x, the pandemic's impact on earnings contributing 0.8x, and like-for-like valuation expansion contributing 3.3x.
- Avoid Simply Shorting the Market: Shorting the U.S. market based solely on a high aggregate P/E could be a mistake, as the valuation expansion is primarily driven by structural and temporary factors.
- Focus on Individual Stock Fundamentals: Investors should concentrate on a company's own valuation relative to its history, rather than the index's overall P/E. High-P/E companies that benefit from long-term trends or stable growth may be reasonably priced and capable of delivering good returns.
- Be Wary of Valuation Expansion Risk: Caution is warranted only when a company's P/E rise does not reflect a change in fundamentals (e.g., excessive market expectations or acceptance of low returns). Currently, the like-for-like market valuation is only 16% higher, suggesting limited risk.
Additional Arguments & Data Analysis
1. The "Expensive" Nature of FAANGM: Growth-Driven, Not a Valuation Bubble
This article uses the FAANGM case to further illustrate the core mechanism of the mix effect: a rising weight of high-multiple companies pushes up the overall market P/E, but individual companies do not exhibit valuation bubbles. Key data is as follows:
| Metric | FAANGM Current P/E | 10-Year Median P/E | Direction of Change |
|---|---|---|---|
| Amazon | 86x | 73x | Slightly above history |
| Apple | 29x | 16x | Above history |
| 25x | 33x (since listing) | Below history | |
| Alphabet | 34x | 29x | Slightly above history |
| Microsoft | 35x | 29x | Slightly above history |
| Netflix | 50x | 139x (since listing) | Far below history |
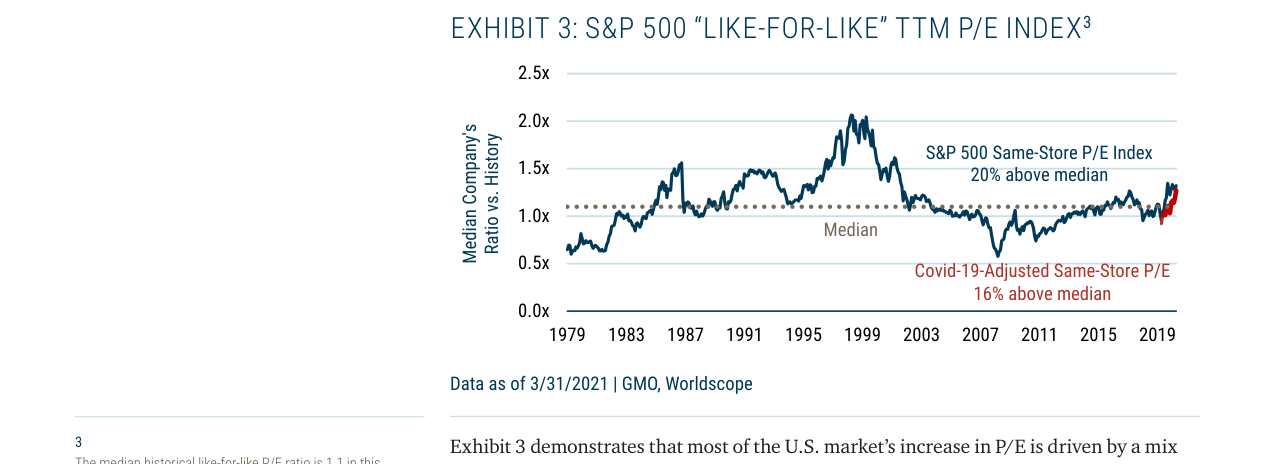
After adjustment, the S&P 500 "like-for-like" P/E is 20% above its historical median, or 16% above after excluding pandemic effects, far lower than the 86% premium of the overall market.
Key Finding: Half of the FAANGM stocks have current P/Es below their own long-term medians (Facebook, Netflix), indicating that their high multiples are not due to valuation expansion but rather earnings growth absorbing the premium. This contrasts sharply with the 2000 tech bubble, where Microsoft's P/E briefly exceeded 90x, compared to just 35x today.
2. Changes in FAANGM's Market Cap & Earnings Share: Quantitative Evidence of the Mix Effect
| Time | FAANGM % of S&P 500 Market Cap | FAANGM % of Index Earnings |
|---|---|---|
| March 2016 | 11% | 10% |
| March 2021 | 21% | 23% |
Core Logic: FAANGM's market cap share rose from 11% to 21%, but its earnings share rose from 10% to 23%, meaning earnings growth outpaced market cap growth. This suggests their high P/Es stem from fundamental support, not speculation. The essence of the mix effect is that high-earnings-growth companies naturally command higher weights, rather than the overall market valuation being distorted.
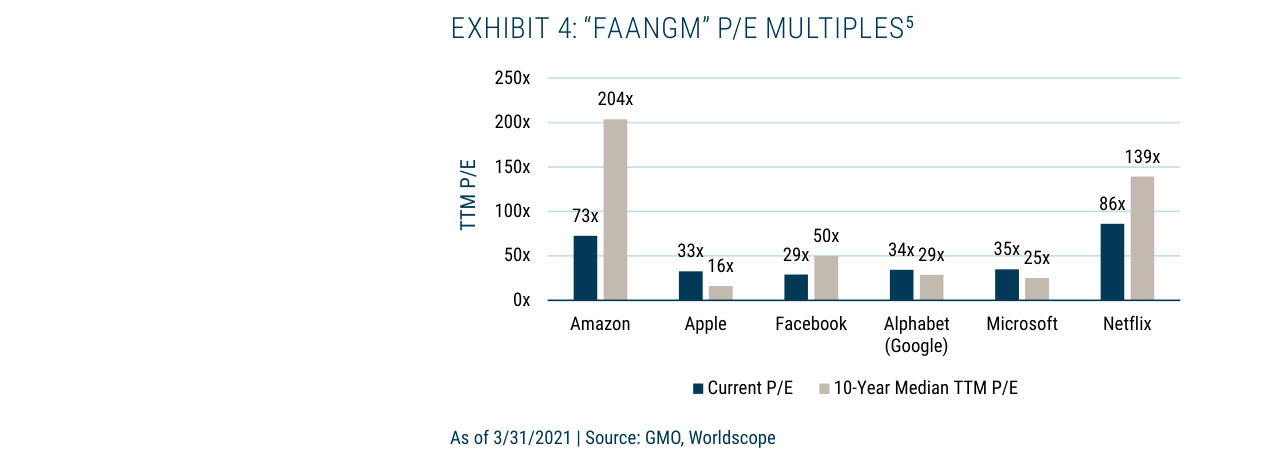
Among FAANGM stocks, Amazon's current P/E of 73x is below its 10-year median of 204x, and Netflix's 86x is below 139x, showing that not all high-valuation stocks are at historical highs.
3. Quality Strategy's Covid-19 Adjustment: Why It's More Sensitive Than the Market
The article notes that the Quality strategy's valuation was far more affected by Covid-19 than the overall market (adjusted premium of 15% vs. the market's 37%). The reason is that the strategy has nearly one-third of its weight in "return to normal" themes (e.g., TJX, Safran, Compass Group, Coca-Cola). These companies saw significant earnings declines in 2020, inflating their TTM-based P/Es. However, the author believes:
- TJX: Store closures due to the pandemic hurt sales, but earnings are expected to exceed pre-pandemic levels as restrictions ease, savings are released, and costs are optimized.
- Safran: A jet engine manufacturer hit by the aviation downturn, but long-term demand is inelastic.
- Compass Group: A food service provider benefiting from economic reopening.
- Coca-Cola: A beverage giant with relatively resilient consumption.
Data Comparison: The Quality strategy's like-for-like P/E is only 15% above its median after Covid-19 adjustment, compared to 37% before adjustment. This indicates that over 60% of the current high P/E is a temporary distortion caused by the pandemic.
4. Comparison with the Tech Bubble: Historical Warnings vs. Current Differences
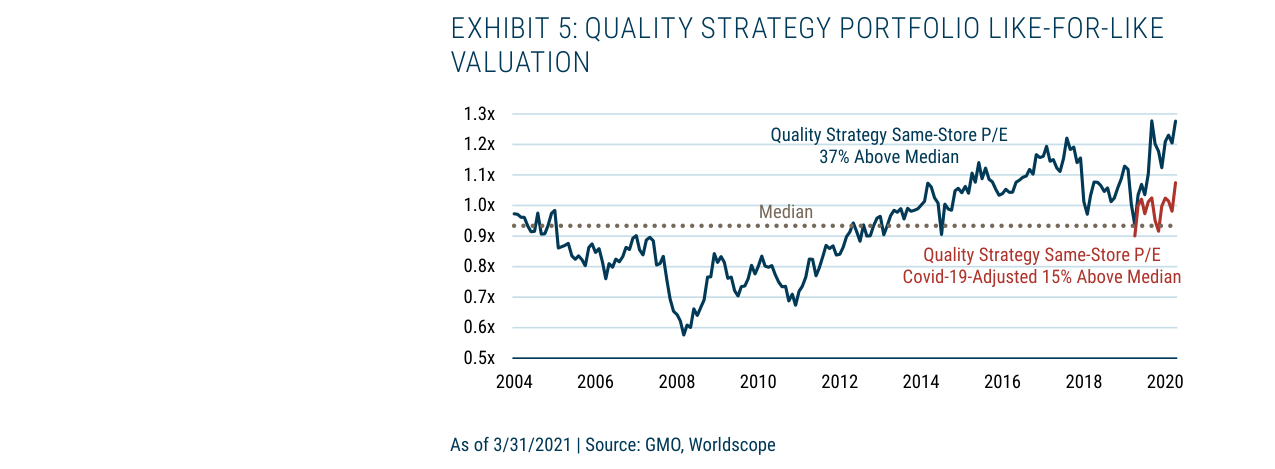
The Quality Strategy portfolio's current "like-for-like" P/E is 37% above its median, but only 15% above after excluding pandemic effects, consistent with historically attractive levels.
| Metric | 2000 Tech Bubble | 2021 (This Analysis) |
|---|---|---|
| Microsoft P/E | >90x | 35x |
| FAANGM Overall P/E vs. Historical Median | Generally far above history | Half below or near history |
| Earnings Growth vs. Market Cap Growth | Earnings lagged | Earnings growth outpaced market cap |
| Typical Company Valuation | No fundamental support | Earnings growth absorbed premium |
Conclusion: While the current market is expensive, it is not a bubble. The mix effect makes the overall P/E appear overvalued, but individual company valuations are reasonable or even low.
5. Future Outlook: High-Multiple Trend May Persist
The author argues that if the U.S. continues to produce globally leading high-quality companies (like FAANGM), the market P/E could remain elevated for an extended period. This is not a negative signal; instead, it provides more investment opportunities for the Quality strategy. The key is whether earnings growth can be sustained—if high-multiple companies can continue to deliver strong results, then a high P/E is a reasonable "growth premium" rather than a "valuation bubble."
6. Limitation Note: Conservatism of the Covid-19 Adjustment
The article acknowledges that the adjustment may be too conservative: if the tailwinds from the pandemic (e.g., tech companies benefiting from remote work) prove more persistent than the headwinds, the adjusted valuation might understate the true attractiveness. For example, FAANGM's earnings share rose from 10% to 23% during the pandemic, and some of these tailwinds may be durable. Therefore, the author views the current valuation environment as "expensive but normal," not extreme.