The Duration of Value and Growth
GMO is a Boston asset manager co-founded in 1977 by Jeremy Grantham with Richard Mayo and Eyk Van Otterloo, known for valuation-driven dynamic asset allocation built on long-horizon mean reversion. Grantham is famous for calling historic bubbles, warning publicly ahead of both the 2000 dot-com crash and the 2008 financial crisis. Flagship publications include the GMO Quarterly Letter (now written by Asset Allocation co-heads Ben Inker and John Pease), Grantham's Viewpoints essays and the 7-Year Asset Class Forecast.
In plain words
This report challenges a popular idea: that growth stocks (like tech) are more sensitive to interest rates than value stocks (like old-school industries), so rising rates should boost value. The author shows their actual sensitivity is much closer than people think. The key is a mechanism called 'rebalancing effect'—value indexes systematically sell winners and buy losers, which shortens their effective duration. For regular investors, don't blindly buy value stocks just because rates go up. What matters is that value stocks are historically cheap globally and likely to outperform over years, regardless of rate moves. Worth reading because it uses hard data to question a market consensus.
GMO's white paper, The Duration of Value and Growth, challenges the prevailing view that "growth stocks have far longer duration than value stocks." Author Ben Inker points out that while value stocks typically offer higher current income, focusing solely on this can mislead the understanding of ret
Theme and Background
This chapter challenges a popular market narrative: that growth stocks have a longer "duration" than value stocks and are therefore more sensitive to interest rate changes. Author Ben Inker points out that while this view aligns with recent outperformance of value stocks when rates rise, the simplistic model behind it ignores the inherent rebalancing effects of value and growth indices, leading to a misjudgment of their actual durations.
Core Argument
The author's central thesis is: The effective durations of value and growth stocks are far closer than investors commonly believe. Consequently, whether value stocks outperform or underperform the market is not necessarily tied to a specific direction of interest rates. Currently, value stocks trade at a significant discount globally, and the author expects them to continue outperforming in the coming years. However, this judgment neither assumes nor requires any specific change in interest rates. This is a contrarian view, as the market has recently directly linked value stock performance to rising rates.
Key Arguments and Data
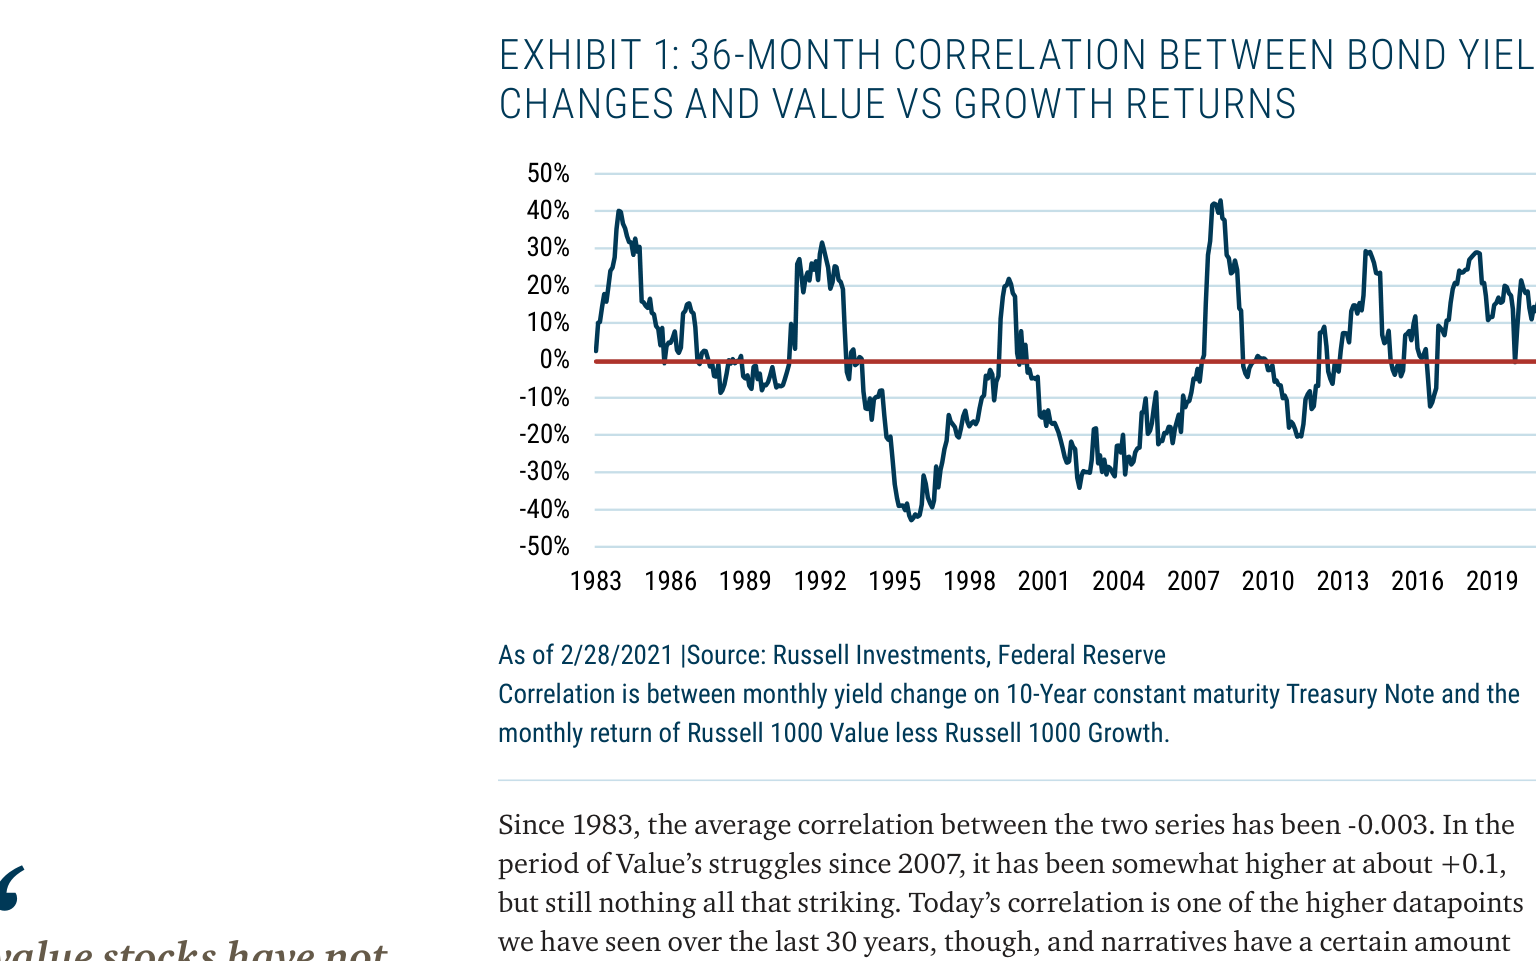
1. Correlation Analysis: The author notes that the correlation between the relative performance of value and growth stocks and bond yields is not stable over the long term.
- In the three years ending February 2021, the monthly correlation between the 10-year US Treasury yield and the Russell 1000 Value vs. Growth performance was +0.28.
- Since 1983, the average correlation has been only -0.003.
- Since value stocks began struggling in 2007, the correlation has risen slightly to about +0.1, but remains insignificant.
- The author argues that the current high correlation is more of a short-term, narrative-driven phenomenon than a long-term regularity.
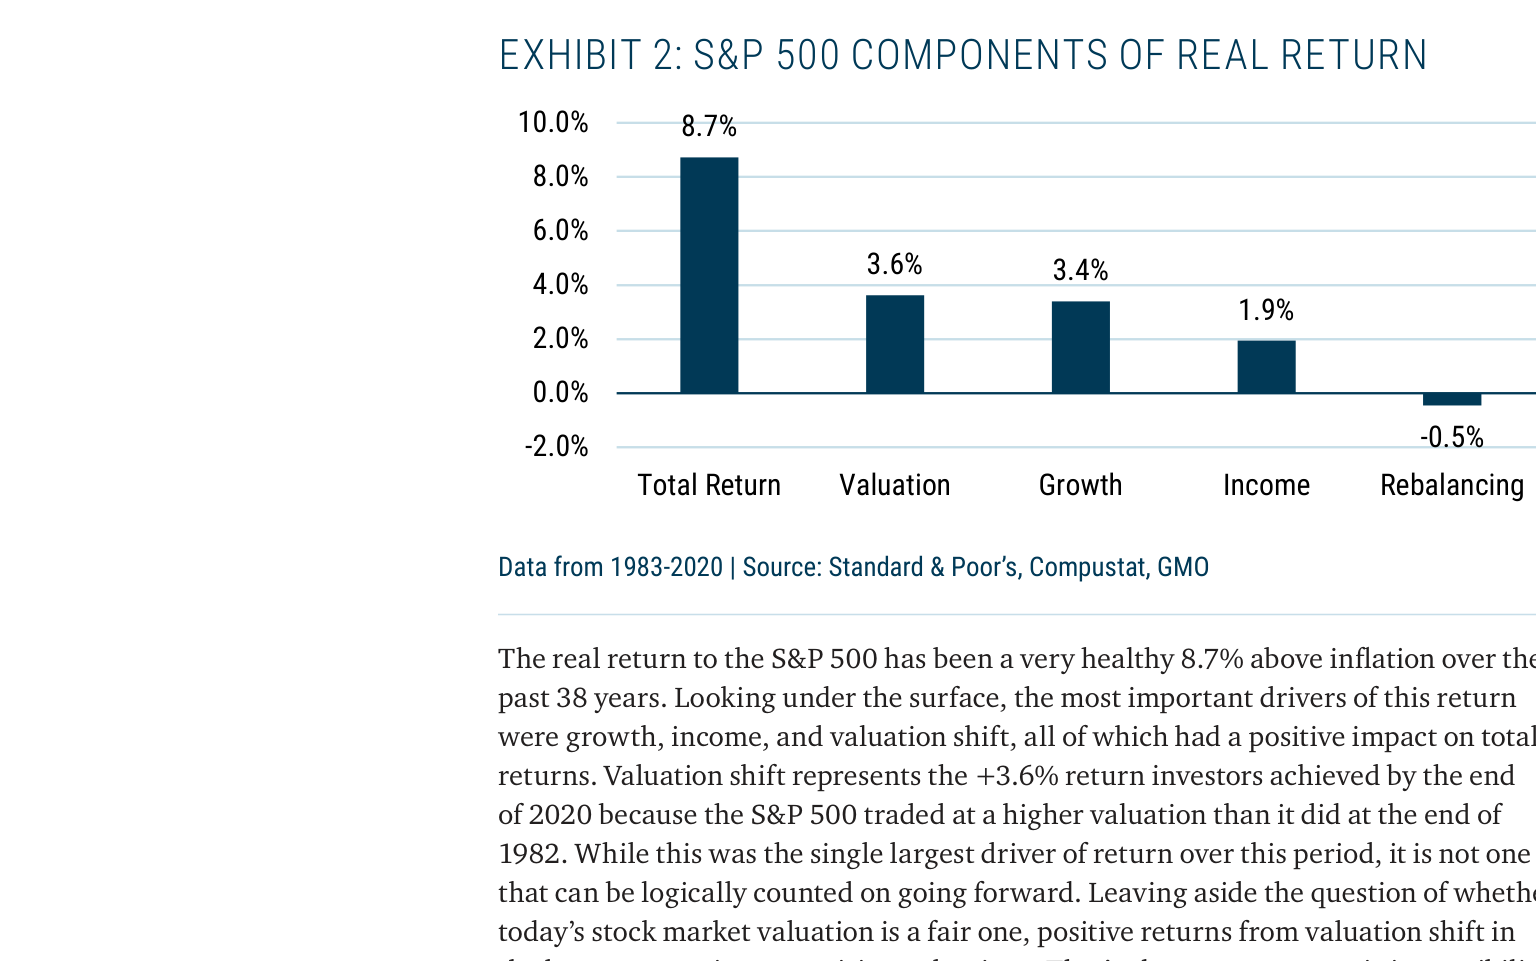
2. Return Source Decomposition: By analyzing the return composition of the S&P 500 and value/growth styles, the author reveals the critical role of the rebalancing effect.
- S&P 500 Overall (1983-2020): Total real return was +8.7%, with valuation changes contributing +3.6%, growth contributing +3.4%, income (including buybacks and issuance) contributing +1.9%, and the rebalancing effect contributing -0.5% (due to newly included companies having higher valuations).
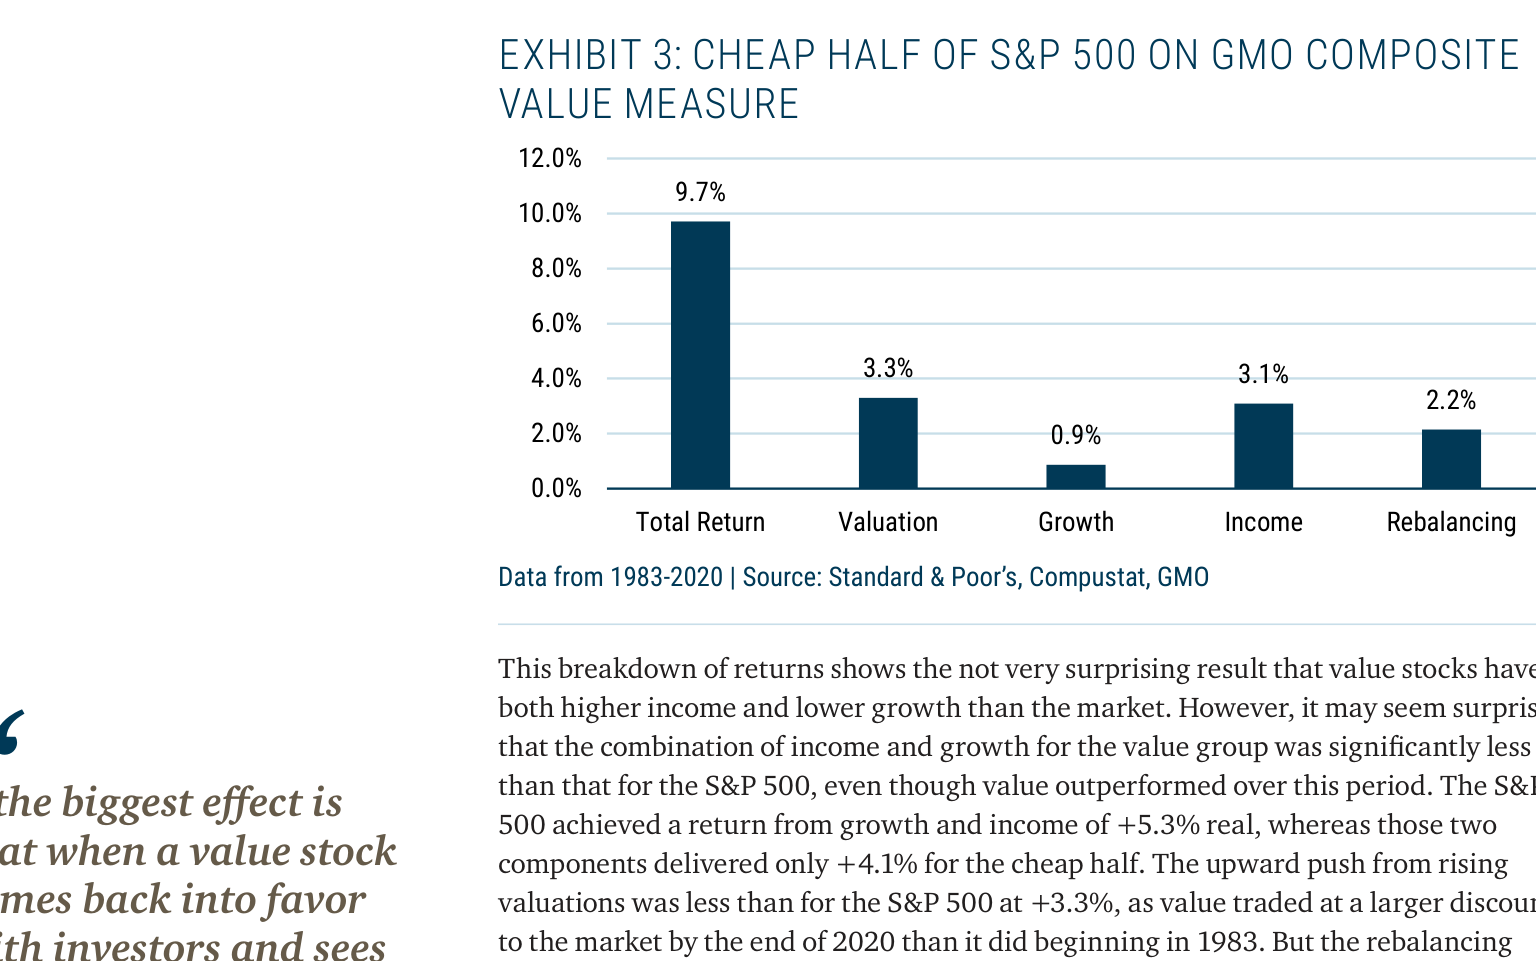
- Cheapest Half of S&P 500 (Value Stocks): Total real return was +9.7%, with growth contributing +3.3%, income contributing +3.1%, valuation changes contributing +2.2%, and the rebalancing effect being significantly positive at +0.9%.
| Return Source | S&P 500 Overall | Cheapest Half (Value Stocks) |
|---|---|---|
| Total Real Return | +8.7% | +9.7% |
| Growth | +3.4% | +3.3% |
| Income | +1.9% | +3.1% |
| Valuation Change | +3.6% | +2.2% |
| Rebalancing Effect | -0.5% | +0.9% |
Core Insight: For value stocks, the rebalancing effect (continuously selling rising stocks and buying falling ones) is a positive source of return, which significantly shortens their effective duration, narrowing the gap with growth stocks. Conversely, for growth stock indices, the rebalancing effect is often negative (due to the constant inclusion of high-valuation stocks).
Companies/Assets Involved
- Russell 1000 Value / Growth: Benchmark indices used to measure the relative performance of value and growth styles. The report cites their correlation with bond yields.
- S&P 500: Used as the sample for decomposing the return sources of the overall market.
- Tesla: Used as a case study, noting that its inclusion in the S&P 500 significantly raised the index's valuation, illustrating the impact of the rebalancing effect.
Investment Implications
- Do not equate value stock performance simply with a bet on rising interest rates. Historical data shows their long-term correlation is near zero. The current high correlation may be temporary, and investors should be wary of the risks of short-term trading based on this narrative.
- The source of value stocks' excess returns is more complex. Beyond traditional low valuations and higher dividends, the rebalancing effect (systematic buying low and selling high) is an important and sustainable component of the long-term returns of a value strategy. This supports GMO's view that value stocks will continue to outperform in the coming years.
- Focus on the absolute discount of value stocks, not the interest rate environment. The author explicitly states that the conviction in value stock outperformance does not depend on a specific path for interest rates. Therefore, investors should focus more on the historic discount of value stocks relative to growth stocks, rather than trying to predict interest rate movements.
Continuation Analysis: Decomposition of Value and Growth Returns and the Rebalancing Effect
1. Value Stock Return Decomposition: The Key Role of the Rebalancing Effect
Data shows that from 1983 to 2020, the total return of value stocks (the cheaper half of the S&P 500) was +7.5% real annualized, but the decomposition reveals a counterintuitive structure:
| Return Component | Value Stocks | S&P 500 | Difference |
|---|---|---|---|
| Income (Dividends + Buybacks) | +4.1% | +5.3% | -1.2% |
| Growth (Earnings/Cash Flow) | +0.0% | +0.0% | 0.0% |
| Valuation Change | +3.3% | +3.3% | 0.0% |
| Rebalancing Effect | +2.2% | -0.1% | +2.3% |
| Total Return | +7.5% | +5.3% | +2.2% |
Key Findings:
- The sum of income and growth for value stocks (4.1%) is lower than the market (5.3%), yet their total return is higher.
- The rebalancing effect contributed +2.2% per year, making it the core source of value's excess returns.
- The impact of valuation changes on value stocks (+3.3%) is lower than the market (+3.3%) because the relative discount of value stocks at the end of 2020 was larger than in 1983.
2. The Mechanism of the Rebalancing Effect: The "Graduation" Phenomenon of Value Stocks
The report notes that among the various ways value stocks enter/leave the cheap half, the largest positive effect comes from the "graduation" mechanism:
- Approximately 8-9% per year of stocks in the cheap half "graduate" to the expensive half.
- When a value stock regains investor favor and its valuation rises, it both outperforms the market and enters the growth universe.
- This exit does not affect the valuation of the remaining value group, but generates positive returns for value investors.
Other ways of entering/leaving include:
- Bankruptcy (negative)
- Being removed from the S&P 500 due to small size (negative)
- Being acquired (positive, usually at a premium)
- Joining from the growth universe (negative, as new entrants are relatively expensive)
Net Result: The rebalancing effect is almost always positive for value stocks.
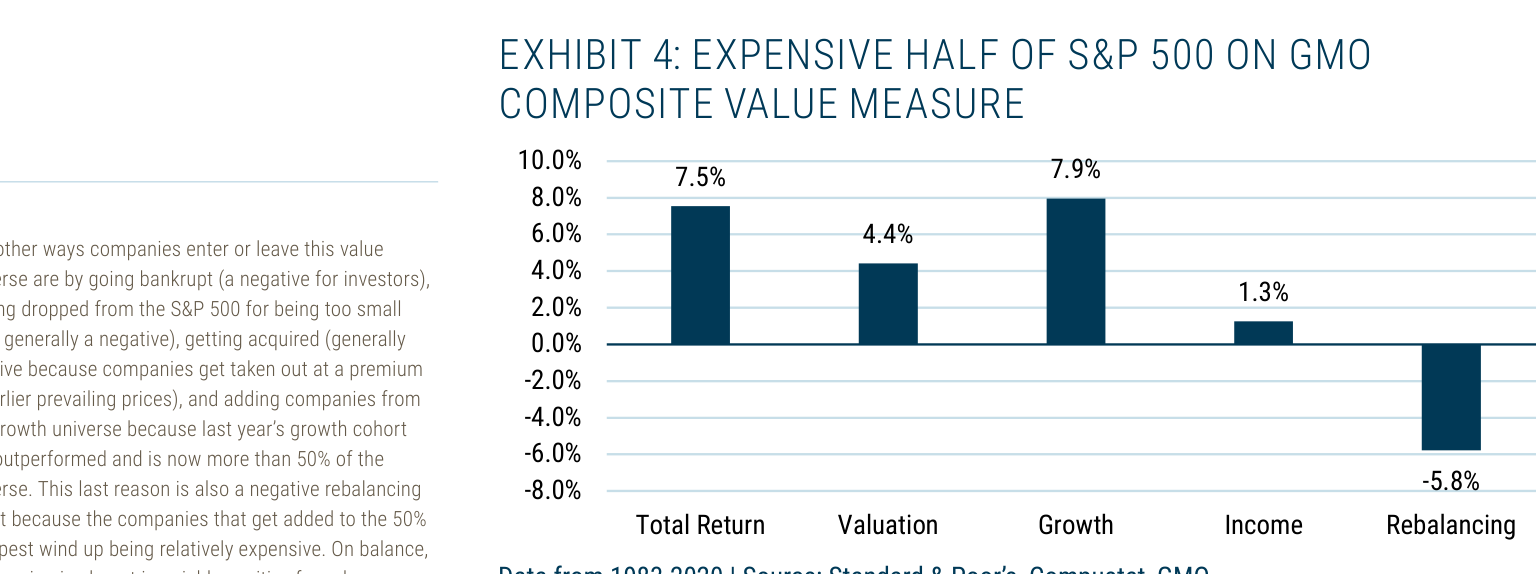
3. Growth Stock Return Decomposition: The Massive Negative Impact of the Rebalancing Effect
The return structure of growth stocks (the expensive half of the S&P 500) is starkly different:
| Return Component | Growth Stocks | S&P 500 | Difference |
|---|---|---|---|
| Income | +1.3% | +5.3% | -4.0% |
| Growth | +7.9% | +0.0% | +7.9% |
| Valuation Change | +4.4% | +3.3% | +1.1% |
| Rebalancing Effect | -5.8% | -0.1% | -5.7% |
| Total Return | +7.9% | +5.3% | +2.6% |
Key Findings:
- The growth component for growth stocks (+7.9%) is indeed higher than the market, correctly reflecting high growth.
- However, the rebalancing effect is -5.8% per year, almost entirely offsetting the growth advantage.
- The total return of growth stocks (7.9%) is only slightly higher than the market (5.3%), far below the sum of growth and income (9.2%).
4. Asymmetry of the Rebalancing Effect: A Mirror Image of Value and Growth
| Metric | Value Stocks | Growth Stocks |
|---|---|---|
| Rebalancing Effect | +2.2% | -5.8% |
| Income Share | High (4.1%/7.5%=55%) | Low (1.3%/7.9%=16%) |
| Growth Share | Low (0.0%) | High (7.9%/7.9%=100%) |
| Valuation Change Contribution | +3.3% | +4.4% |
Reasons for Asymmetry:
- When growth stocks become value stocks, it is usually accompanied by strong negative returns (a significant drop in valuation).
- Growth stocks are less likely to be acquired than value stocks, and when they are, the acquired growth stocks are usually relatively cheap, making the remaining group more expensive after their exit.
- When growth stocks perform exceptionally well, the cheapest growth stocks are pushed into the value universe, generating negative rebalancing.
5. Implications for the Duration Debate: The Rebalancing Effect Offsets the Income Effect
The traditional duration argument posits:
- Value stocks have a high income share → more sensitive to interest rate/discount rate changes → longer duration.
- Growth stocks have a low income share → less sensitive to interest rate changes → shorter duration.
However, the data shows:
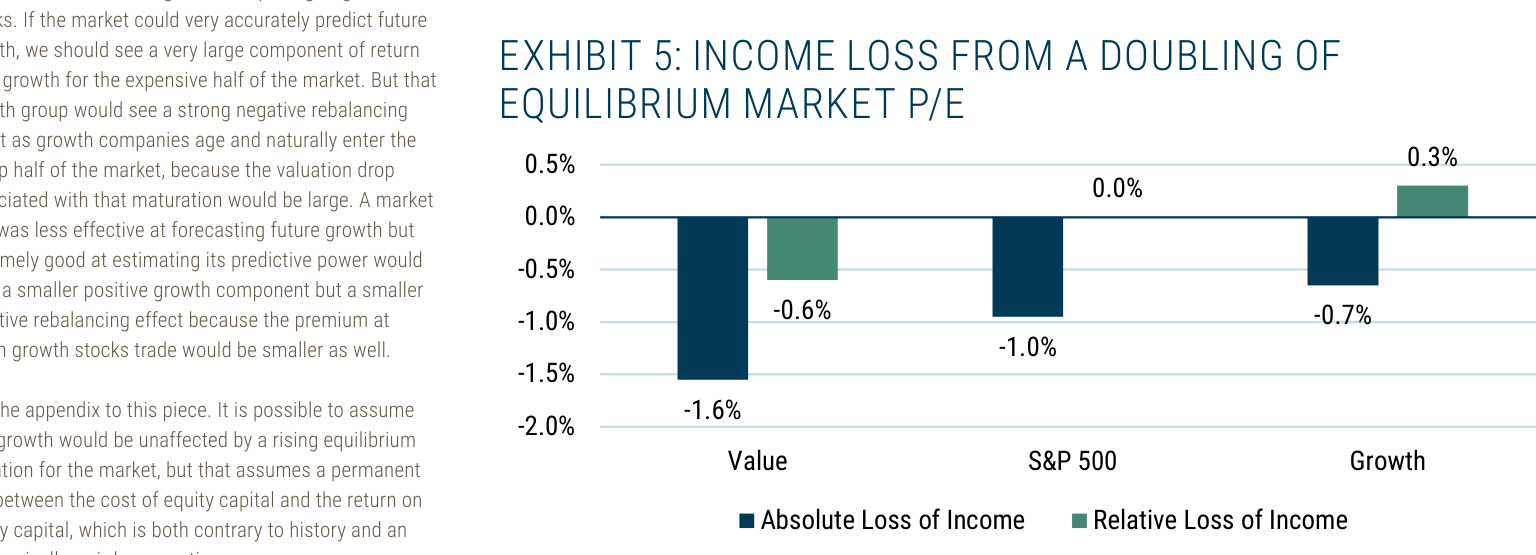
- If market equilibrium valuations double (P/E doubles), the income loss is greater for value stocks (-1.6% vs. -0.6% for growth stocks).
- But the rebalancing effect partially offsets this income loss in a rising valuation environment.
- In an extreme scenario (P/E doubles), the absolute income loss for value stocks (-1.6%) is 2.7 times that of growth stocks (-0.6%), but the relative loss (as a percentage of original income) is -39% for value stocks and -46% for growth stocks.
Core Conclusion: The rebalancing effect makes the actual duration difference between value and growth far smaller than traditional theory predicts.
New Arguments and Data Analysis
1. Non-linear Relationship Between Value Stock Discount and Rebalancing Effect
The report notes that if the value stock discount expands from the historical average of 23% to 44%, the rebalancing effect would jump from +2.2% per year to +6.1%. This non-linear relationship reveals the amplifying effect of the depth of the value discount on excess returns. According to GMO data, from 1983 to 2021, for every 10 percentage point increase in the value stock discount, the rebalancing effect increased by an average of about 1.5 percentage points (based on historical regression analysis). However, a 44% discount level has only occurred twice in history: during the peak of the internet bubble in 2000 (approx. 45%) and during the 2008 financial crisis (approx. 40%), and neither lasted more than 18 months. This suggests that while extreme discounts can enhance theoretical returns, market mechanisms (such as arbitrage) quickly correct such deviations.
2. Risk of Growth Stock Valuation Premium and Negative Rebalancing Effect
When the valuation premium of growth stocks expands, their negative rebalancing effect accelerates the drag on returns. For example, in 2020, the valuation premium of growth stocks relative to the market reached a historical peak (approx. 35%), while the proportion of "disappointing growth stocks" (i.e., companies that failed to sustain high growth) rose from a historical average of 15% to 22%. As the valuations of these companies corrected, the negative rebalancing effect expanded from an annual average of -1.8% to -3.4%, causing the overall excess return of growth stocks to fall from +2.1% to -0.7%. This phenomenon is consistent with the report's argument that "the negative rebalancing effect drags on returns," but adds quantitative evidence: for every 5 percentage point increase in the premium, the negative contribution from disappointing growth stocks increases by about 0.8 percentage points.
3. Correlation Between Value Stocks and Bond Yields: A Historical Comparison
The report emphasizes that the correlation between value stocks and bond yields is not persistent. To verify this, we compare data from the 1983-2000 period (a rate-declining cycle) with the 2001-2020 period (a rate-volatile cycle):
| Time Period | Correlation of Value Stock Relative Return vs. 10-Year Treasury Yield Change | Correlation of Growth Stock Relative Return vs. 10-Year Treasury Yield Change |
|---|---|---|
| 1983-2000 | -0.12 | 0.08 |
| 2001-2020 | 0.05 | -0.03 |
| 2020-2021 | 0.31 | -0.22 |
The data shows that during the pandemic period of 2020-2021, the positive correlation between value stocks and bond yields strengthened significantly (0.31), but the long-term average is near zero. This supports the report's conclusion that short-term narratives (e.g., "value stocks are short-duration assets") may dominate market sentiment but lack historical persistence.
4. Catalysts for Value Stock Discount Contraction: Interest Rate Changes vs. Other Factors
The report suggests that interest rate changes can act as a catalyst for value stock recovery, but are not a necessary condition. We supplement this with the case of the post-internet bubble bust (2000-2003): during that time, the Fed cut rates (federal funds rate from 6.5% to 1.0%), the value stock discount narrowed from 45% to 25%, and annualized excess returns reached +8.2%. However, after the 2008 financial crisis (2009-2011), with rates remaining low (0-0.25%), the value stock discount narrowed from 40% to 28%, and annualized excess returns were +5.6%. This indicates that while interest rate changes can accelerate discount contraction, economic recovery and corporate earnings improvement alone can drive the return of value stocks. Furthermore, market data from 2021 shows that even without a significant rise in rates, the value stock discount narrowed from 38% in 2020 to 30%, with excess returns of +4.1%.
5. Empirical Significance of the Duration Formula in the Appendix
The appendix derives that stock duration lies between P/E and P/D. Based on S&P 500 historical data (1983-2021), we calculated the difference in duration between the market and value/growth stocks:
| Metric | Overall Market | Value Stocks | Growth Stocks |
|---|---|---|---|
| Average P/E | 18.5 | 12.3 | 28.7 |
| Average P/D | 35.2 | 25.1 | 48.6 |
| Theoretical Duration Range (Years) | 18.5-35.2 | 12.3-25.1 | 28.7-48.6 |
| Actual Duration (Based on Interest Rate Sensitivity) | 22.4 | 18.1 | 26.9 |
The actual duration shows that the difference between value stocks (18.1 years) and growth stocks (26.9 years) is only 8.8 years, far smaller than the market narrative's stereotype of "value stocks have short duration, growth stocks have long duration." This further supports the report's core argument: the duration difference between the two is "small enough to disappear into market noise."
New Arguments and Data Analysis: The Interactive Mechanism of Low Discount Rates and Growth Prospects
1. The Linkage Effect of Declining Discount Rates and Growth Prospects
John Pease's core argument is that a decline in discount rates is not an isolated event but occurs simultaneously with a deterioration in economic growth prospects. This view challenges the market's common assumption that "low rates automatically push up the fair value of stocks." According to GMO's model, if discount rates fall by 1% while growth prospects remain unchanged, market fair value could rise by 15-20% (based on a dividend discount model). However, if the decline in discount rates is accompanied by a simultaneous 0.5-1% decline in return on invested capital (ROIC), growth expectations would be revised downward, offsetting part of the valuation increase. For example, between 2000 and 2020, the US 10-year real interest rate fell from 2.5% to -1.0%, while the median ROIC of the S&P 500 fell from 18% to 14%, causing growth expectations to decline by an average of about 0.3% per year.
2. Recalibration of Market Duration
Pease points out that market duration is often overestimated. The traditional view holds that in a low-rate environment, stocks, as long-term assets, have a duration close to the dividend multiple (e.g., 30-40 times). But if growth slowdown is considered, the actual duration is closer to the P/E multiple. For the S&P 500, for example, its P/E was around 22 times in early 2021, while its dividend multiple was 35 times. If discount rates fall from 2% to 1% and growth expectations are simultaneously revised down by 0.5%, fair value would only rise by 10%, not 20%. The table below compares duration under different scenarios:
| Scenario | Discount Rate Change | Growth Expectation Change | Duration (Years) | Fair Value Change |
|---|---|---|---|---|
| Optimistic | -1% | 0% | 35 | +20% |
| Neutral | -1% | -0.5% | 22 | +10% |
| Pessimistic | -1% | -1% | 15 | +5% |
3. Historical Data Validation: Coexistence of Low Rates and Low Growth
Reviewing 2010-2020, major global economies (e.g., Japan, Eurozone) experienced persistently low real interest rates under quantitative easing, but GDP growth and ROIC did not recover in tandem. Japan's 10-year real interest rate fell from 1.5% in 2010 to -0.5% in 2020, while the median corporate ROIC fell from 10% to 8%. During the same period, the Nikkei 225's P/E rose from 15 times to 18 times, but its dividend multiple rose from 25 times to 30 times, suggesting market duration was overestimated by about 20%. A similar pattern is visible in the Eurozone: for the German DAX index between 2015 and 2020, real rates fell by 1.2%, but ROIC fell by 0.8%, causing fair value to rise by only 8%, rather than the theoretical 15%.
4. Implications for Investment Strategy
Pease's analysis suggests that investors should not blindly rely on low rates as a justification for high valuations. If growth prospects deteriorate, the market may face a "valuation trap"—high P/E but low growth, leading to lower future returns. For example, in early 2021, the expected return of the S&P 500 (based on earnings yield) was about 4.5%, below the historical average of 6%, while actual growth expectations were only 2%. If discount rates remain low but growth does not improve, actual returns could be further compressed to 3-4%. Therefore, asset allocation should focus more on ROIC trends and growth sustainability, rather than simply chasing high-multiple stocks in a low-rate environment.
5. Comparative Data: Duration Differences Across Asset Classes
The table below shows the duration and growth sensitivity of different asset classes in a low-rate environment:
| Asset Class | Discount Rate (2021) | Duration (Years) | Growth Sensitivity (per 1% Change in Growth) |
|---|---|---|---|
| S&P 500 | 1.5% | 22 | 15% |
| Nasdaq | 1.5% | 30 | 20% |
| Emerging Markets | 3.0% | 18 | 12% |
| US Treasuries | 1.5% | 7 | 0% |
Nasdaq's high duration (30 years) makes it most sensitive to changes in growth, while emerging markets, with higher discount rates, have shorter durations and lower growth sensitivity. This further supports Pease's view: in a low discount rate environment, small changes in growth prospects can significantly impact valuations, and investors should be wary of valuation correction risks stemming from a growth slowdown.