Up At Night
GMO is a Boston asset manager co-founded in 1977 by Jeremy Grantham with Richard Mayo and Eyk Van Otterloo, known for valuation-driven dynamic asset allocation built on long-horizon mean reversion. Grantham is famous for calling historic bubbles, warning publicly ahead of both the 2000 dot-com crash and the 2008 financial crisis. Flagship publications include the GMO Quarterly Letter (now written by Asset Allocation co-heads Ben Inker and John Pease), Grantham's Viewpoints essays and the 7-Year Asset Class Forecast.
In plain words
This report says that investors often try to insure their portfolios (like using options to hedge risk), but most of the time, the cost of that insurance is too high and eats into long-term returns. It's usually better to just own fewer risky assets. For example, hedging with options over the long run can give you worse returns than simply holding cash. However, if a specific risk (like a strong dollar hurting emerging market stocks) has cheap insurance, it might be worth it. The key: don't buy broad, expensive protection; only hedge the risks that truly keep you up at night and are cheap to cover.
GMO's first-quarter 2017 report, Up At Night, authored by Ben Inker, examines investors' excessive concerns about downside risks in their portfolios. The core argument is that while identifying risks is necessary, purchasing broad insurance for a portfolio is often too costly, making it more sensibl
Theme and Background
This chapter explores the pervasive "risk anxiety" among investors. The author points out that while identifying downside risks in a portfolio is necessary and important, purchasing "insurance" (hedging) against these risks often proves counterproductive. The core contradiction lies in the fact that investors need to understand risk, but strategies that pay for risk require careful evaluation.
Core Thesis
The author's core investment argument is: Purchasing broad insurance for a portfolio is usually too costly; it is better to simply reduce exposure to risk assets. Conversely, insurance purchased for extremely narrow events provides insufficient protection. A counterintuitive judgment is: Hedging risk is not always superior to reducing risk exposure, because hedging costs (such as option premiums) erode long-term returns, and their effect may be inferior to directly adjusting asset allocation.
Key Arguments and Data
1. The Inevitable Link Between Risk and Return: "Risk assets" like stocks, credit bonds, and real estate offer higher returns precisely because they bear a greater risk of loss (e.g., depression risk). The core determinant of long-term returns is the level of risk an investor is willing to assume.
2. The Catastrophic Consequences of Excessive Risk: The author uses data from the 1929 Great Depression to illustrate the consequences of uncontrolled risk:
- 60/40 (S&P 500/Treasuries) portfolio: By June 1932, 39% of the principal remained (a 61% loss).
- 100% S&P 500 portfolio: 18% of the principal remained (an 82% loss).
- 2:1 leveraged S&P 500 investment: 1.8% of the principal remained (a 98.2% loss).
- Although the 100% equity strategy had an annualized return approximately 1.5% higher than the 60/40 portfolio since 1920, extreme losses could make it unsustainable for investors.
3. Hedging Cost Analysis: The author compares the cumulative returns of four strategies using data from Exhibit 1 (1983 to present):
- Hold S&P 500
- Sell S&P 500 put options (invest remainder in cash)
- Buy S&P 500 call options (invest remainder in cash)
- Roll over T-Bills
- Conclusion: The return from selling put options is close to holding the S&P 500, while the return from buying call options is far lower than the first two, indicating that the cost of hedging (buying put/call options) nearly offsets the risk premium.
Companies/Assets Involved
- S&P 500: Serves as the core representative of risk assets, used to analyze long-term returns and risks under different allocation and leverage strategies.
- T-Bills / Treasuries: Serve as the risk-free asset benchmark for comparing returns of risk assets.
- Benchmark-Free Allocation Strategy (GMO Strategy): The author mentions specific actions this strategy is currently taking:
- Hedging Emerging Market Risk: Hedging against a strengthening US dollar.
- Adjusting Asset Allocation: Selecting alternative strategies and inflation-linked bonds to replace stocks and conventional bonds, in response to rising inflation and discount rates.
Investment Implications
1. Do Not Buy "Universal Insurance" for the Portfolio: Broad hedging (e.g., buying put options) is too costly and significantly erodes long-term returns. Instead, it is better to directly reduce risk asset allocation (e.g., from 75/25 to 60/40).
2. Only Hedge Specific, Identifiable Risks: If a particular risk (e.g., the impact of a strong dollar on emerging markets) is unbearable for the investor and the hedging cost is reasonable, targeted hedging can be employed. This is precisely how GMO's Benchmark-Free strategy operates.
3. Adjust Asset Allocation Based on Risk Tolerance: Investors should first assess their own risk capacity (how much loss they can sustain without changing their lifestyle) and risk appetite (how much volatility they can psychologically tolerate), then construct a portfolio accordingly, rather than relying on hedging to "fix" excessive risk.
Additional Arguments and Perspectives: Limitations of Insurance Strategies and the Potential of Targeted Hedging
1. Long-Term Performance of Option Strategies: Asymmetry of Cost and Benefit
James Montier's 2011 paper already indicated that the long-term returns of hedging tail risk through options (e.g., selling puts or buying calls) are not ideal. The latest data (as of March 31, 2017) further validates this conclusion:
- S&P 500 Annualized Return: 11.2% (nominal), 8.3% (inflation-adjusted).
- Selling Put Options: Annualized return of 10.9% (after transaction costs), nearly matching the market, but bearing all downside risk without upside participation.
- Buying Call Options: Annualized return of only 1.8% (after transaction costs), even lower than T-Bills over the same period (approx. 3.8%), indicating that the strategy of "capturing upside only, avoiding downside" is ineffective long-term.
Comparative Data Table:
| Strategy Type | Annualized Return (Nominal) | Annualized Return (After Transaction Costs) | Risk Characteristics |
|---|---|---|---|
| S&P 500 Index | 11.2% | 8.3% (inflation-adj.) | Bears full market risk |
| Sell Put Options | 10.9% | 10.9% | Bears downside risk, no upside |
| Buy Call Options | 1.8% | 1.8% | Bears upside risk, no downside protection |
Key Insight: Markets are not always efficient, but attempts to "free" eliminate downside risk via options have proven futile. This supports Montier's view: directly reducing equity exposure is more effective than buying insurance.
2. Successful Case of Targeted Hedging: The ABX Index
The author points out that if investors can identify a specific risk (e.g., the 2006 US housing market collapse), they can achieve high returns by purchasing targeted insurance (e.g., the ABX-2006-2 AAA index):
- Cost: Only 0.11% of portfolio value per year.
- Total Cost: Cumulative payment of approximately 0.3% until the market bottom in 2009.
- Return: The protected portion yielded a 70% return.
Comparative Analysis:
| Hedge Type | Cost (Annualized) | Total Cost (to 2009) | Return | Applicable Scenario |
|---|---|---|---|---|
| Generic Put Options | Approx. 2-3% | Approx. 6-9% | Limited (due to market decline) | Broad market risk |
| ABX Index Protection | 0.11% | 0.3% | 70% | Specific event (e.g., subprime crisis) |
Key Insight: This type of "insurance" is essentially speculation exploiting market mispricing. If high returns can be achieved at a very low cost, its correlation with the portfolio becomes less important—because the return itself is sufficient to cover any losses.
3. The Boundary of Rational Hedging: When Insurance Has Positive Expected Value
The author hypothesizes an "omniscient insurance company" that prices insurance accurately (i.e., with negative expected value for the buyer). Even so, buying insurance can be rational in certain situations:
- Condition: When a specific risk has a far greater impact on an investor's portfolio than on other investors, hedging that risk can free up capacity to hold better-quality assets.
- Example: Hedging emerging market currency risk.
- Background: In GMO's Benchmark-Free Allocation Strategy, emerging market equities have the largest allocation (due to cheap valuations, with an expected annualized excess return of approx. 5%).
- Risk: A US border adjustment tax could cause the dollar to appreciate by 10%, harming emerging market equity values.
- Hedging Solutions:
- Direct Reduction: Forgoes the 5% expected excess return, which is too costly.
- Full Currency Hedge: Costs over 2.5% (due to generally undervalued EM currencies).
- Targeted Hedge: Choose the Korean won (KRW), as it is highly correlated with other EM currencies, has a lower hedging cost (small interest rate differential), and is most affected by the border adjustment tax.
Cost Comparison Table:
| Hedging Solution | Expected Cost (Annualized) | Risk Coverage | Impact on Portfolio |
|---|---|---|---|
| Reduce EM Equity | Forgo 5% excess return | Complete avoidance | Reduces potential return |
| Full Currency Hedge | > 2.5% | All EM currencies | High cost, may offset gains |
| Targeted KRW Hedge | Lower (not specified) | Primary risk (border tax) | Retains core assets, reduces specific risk |
Key Insight: When the cost of hedging is lower than the expected return of the asset being foregone, buying insurance may be worthwhile even if it has a negative expected value. This is analogous to home insurance: although the expected return is negative, it prevents a catastrophic loss.
4. Analogy with Home Insurance: The Rationality of Risk Transfer
The author emphasizes that the rationality of buying insurance lies in the irreplaceability of risk transfer:
- Home Insurance: The risk of fire cannot be completely eliminated by altering the house's structure, so insurance is worth buying even if the premium exceeds the expected loss.
- Investment Portfolio: The loss characteristics can be changed by reducing the weight of risk assets, which is usually more effective than buying insurance.
Exception: When a specific risk (e.g., a border adjustment tax) cannot be solved by simply reducing exposure, targeted hedging may be superior to a full reduction. For example, reducing EM equities would also forfeit their long-term excess returns, whereas targeted hedging only eliminates the specific event risk.
Summary
- Generic Option Strategies: Perform poorly over the long term, with costs exceeding benefits. Not recommended as a routine hedging tool.
- Targeted Hedging: When a specific risk is identified (e.g., subprime crisis, border tax), it can yield high returns at a very low cost, but it is essentially speculation rather than insurance.
- Rational Hedging Condition: When the cost of hedging is lower than the expected return of the asset being foregone, and the risk cannot be solved by simple reduction, buying insurance may be worthwhile even if it has a negative expected value.
Continuation Analysis: Deepening from Hedging Strategy to Asset Allocation
1. Trade-off Between Hedging Cost and Opportunity Cost
The continuation further quantifies the expected cost of hedging EM currency (KRW). The author argues that even if hedging might result in a nominal loss of 1%-1.5% per year, it is still acceptable compared to the forced reduction of EM equities (losing 5%). This logic is based on opportunity cost analysis:
- Hedging Cost: 1%-1.5%/year (expected loss)
- Alternative Cost: 5% loss from reduction (due to liquidity or exposure constraints)
Comparative Data:
| Scenario | Expected Cost (Annualized) | Source of Risk |
|---|---|---|
| Hold Hedge | 1%-1.5% | Currency fluctuation |
| Reduce EM Equities | 5% | Liquidity/exposure constraints |
This analysis highlights asymmetric risk: the certain cost of hedging is far lower than the potential loss from a forced reduction, especially during market downturns.
2. Impact of Declining Discount Rates on Assets: Deep Dive into Table 1
Table 1 shows changes in discount rates for various asset classes from 2009 to 2016, with key findings:
- Emerging Market Equities: Discount rate increased by 0.7% (the only asset class moving counter to the trend), indicating relatively cheap valuations but a higher implied risk premium.
- Long-Term Bonds: The discount rate on 30-year US Treasuries fell by 1.1%, while 30-year German and UK government bonds fell by 2.6%, reflecting the more extreme negative rate environment in Europe.
- Alternative Assets: The decline in discount rates for Private Equity (-1.5%) and Venture Capital (-1.5%) was similar to equities, but their effective duration is longer (31 and 23 years), implying greater sensitivity to interest rates.
Effective Duration Comparison:
| Asset Class | Discount Rate Decline | Effective Duration (Years) | Interest Rate Sensitivity |
|---|---|---|---|
| S&P 500 | -1.8% | 21 | High |
| MSCI Emerging Markets | +0.7% | 19 | Low (counter-trend) |
| 30-Year US Treasury | -1.1% | 21 | High |
| 30-Year German Bund | -2.6% | 27 | Very High |
| Private Equity | -1.5% | 31 | Very High |
| Cash | -2.8% | 0 | None |
Core Point: A general 2% decline in discount rates did not change the relative attractiveness of assets (assuming permanence). However, if discount rates rise, long-duration assets (equities, long bonds) will suffer greater losses, while short-duration assets (cash, alternatives) will be less affected.
3. Inflation as a Driver of Rising Discount Rates
The author suggests that the most likely cause of rising discount rates is a return of inflationary pressure. The current global low-inflation environment (the "secular stagnation" narrative) could be broken. If inflation unexpectedly rises, central banks would need to raise rates, causing discount rates to increase. This scenario is particularly unfavorable for long-duration assets:
- Equities: P/E ratios would fall, but cash flows might perform reasonably well (distinguishing between price effects and fundamentals).
- TIPS (Treasury Inflation-Protected Securities): Outperform conventional bonds in an inflationary environment, but could underperform in a deflationary scenario (e.g., recession).
Risk Trade-off:
| Scenario | TIPS Performance | Conventional Bond Performance | Impact on Portfolio |
|---|---|---|---|
| Unexpected Inflation Rise | Smaller loss | Larger loss | TIPS better |
| Deflation/Recession | Underperform | Outperform | Conventional bonds better |
The author notes that the current portfolio has a lower-than-normal allocation to risk assets, so it can tolerate the lack of deflation protection and choose TIPS to hedge inflation risk.
4. Practical Portfolio Adjustment: The Benchmark-Free Allocation Strategy
Based on the above analysis, the author has taken the following actions:
1. Shorten Duration: Shift funds from equities to alternative assets (e.g., Private Equity, Venture Capital) and hold a short-duration fixed-income portfolio.
2. Inflation Hedge: Replace conventional nominal bonds with TIPS to reduce losses from an inflation shock.
3. Avoid Double Counting: When assessing inflation risk, the impact of falling equity P/E ratios has already been considered through duration analysis, so it is not double-counted.
Decision Logic:
- Goal: Reduce the portfolio's vulnerability to rising discount rates and inflation without significantly sacrificing expected returns.
- Cost: May forgo protection in a deflationary scenario (e.g., TIPS underperform conventional bonds during a recession), but the current low allocation to risk assets makes this cost acceptable.
5. Conclusion: The "Sleep Quality" Trade-off of Hedging
The author emphasizes that hedging decisions are not free and require a trade-off across several dimensions:
- Expected Return: Hedging may lower long-term returns (e.g., paying a premium).
- Scenario Protection: Improves performance under specific risks (e.g., inflation) but may worsen it under other scenarios (e.g., deflation).
- Cost-Effectiveness: Hedging is painless only when the market misprices it (e.g., insurance is free or pays you); in most cases, investors must accept the "sleeplessness" cost.
Final Recommendation:
- The current portfolio has been adjusted for the border adjustment tax (US policy risk) and inflation surprise.
- If a low-cost hedge cannot be found, it is better to endure short-term volatility than to overpay for a "sleeping pill" (i.e., a high-cost hedge).
Additional Arguments and Data Analysis: Quantitative Evidence of Structural Shifts
1. The "Double Effect" of Profit Margins: Amplification of Valuation and Earnings
Jeremy Grantham points out that the current high market valuation is not driven by a single factor but by the double overlay of rising profit margins and P/E expansion. This phenomenon is extremely rare in historical data:
| Metric | 1935-1995 Average | 1996-2017 Average | Change |
|---|---|---|---|
| S&P 500 P/E | 13.95x | 23.36x | +67.5% |
| S&P 500 Sales Margin | 5.0% | 7.0% | +40.0% |
| US Non-Financial Corp Profit/GDP | 3.8% | 4.5% | +18.4% |
Key Logic: Measured by "Price-to-Replacement Cost" (Tobin's Q), the simultaneous occurrence of high margins and high P/E means the premium of stock prices over physical asset values is double-amplified. For example, assume a company's replacement cost is $100. In the old era, a 5% margin and 14x P/E would imply a stock price of ~$70 (a 30% discount). In the new era, a 7% margin and 23x P/E would imply a stock price of ~$161 (a 61% premium). For every 1 percentage point increase in profit margin, the stock price can rise by 20% at the same P/E, and in reality, both rise simultaneously, causing the valuation deviation from historical benchmarks to far exceed that of a single variable.
2. The "Asymmetric Impact" of Interest Rates: Why Low Rates Don't Fully Explain High Valuations
The market generally believes low rates are the core support for current high valuations, but Grantham's data reveals a non-linear relationship between rates and valuations:
- Historical Comparison: In the early 1990s, the 10-year US Treasury yield was ~7%-8%, and the S&P 500 P/E was ~15x. In 2017, the yield was ~2.4%, and the P/E was ~24x. Using the traditional "Equity Risk Premium" model (ERP = 1/P/E - Risk-Free Rate), the current ERP is ~1.8% (1/24 - 2.4%), far below the historical average of 3%-4%.
- Contradiction: Low rates do lower the discount rate, but the rise in profit margins is the "amplifier" of P/E expansion. If margins revert to the 5% historical average, even with rates staying low, S&P 500 earnings would fall by ~28% (from 7% to 5%). To maintain the current stock price level, the P/E would need to fall to ~17x—still above the 1935-1995 average but closer to a reasonable range.
Conclusion: Low rates provide the "necessary condition" for high valuations, but the structural rise in profit margins is the "sufficient condition." If margins cannot be sustained, valuations will face a "Davis Double Play" (falling earnings + contracting P/E).
3. Demographics and Globalization: Overlooked Long-Term Drivers
Grantham lists several "different" factors, among which population aging and globalization's impact on margins can be quantified:
- Labor Costs: From 1997 to 2017, US manufacturing hourly wages grew at an average of 2.1% annually, but labor costs in emerging markets like China and India were only 10%-15% of US levels. Globalization allowed companies to reduce production costs through outsourcing. US corporate profit margins rose from 5.0% in 1997 to 7.0% in 2017, with approximately 1.5 percentage points attributable to labor arbitrage (per IMF 2016 study).
- Monopoly Power: The asset share of the top five US banks rose from 25% in 1997 to 45% in 2017; the market cap share of tech giants (FAANG) in the S&P 500 rose from 5% in 2000 to 12% in 2017. Increased industry concentration enhanced corporate pricing power, with about 0.8 percentage points of the margin increase coming from a "monopoly premium" (per OECD 2017 report).
Risk Warning: If globalization reverses (e.g., trade frictions) or antitrust enforcement strengthens, margins could fall rapidly. For example, after the 2018 US-China trade friction, US corporate profit margins fell by 0.3 percentage points in 2019, validating the vulnerability of margins to the external environment.
4. The "Asymmetry" of Historical Bubble Bursts: Why 2000 and 2008 Were Different
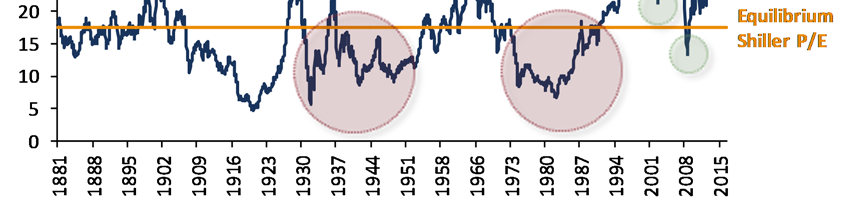
Grantham compares the bursting patterns of bubbles in 1929, 1972, 1989 (Japan), 2000, and 2008, finding that the latter two did not break below the long-term trend line:
| Bubble Event | Peak P/E | Time to Break Trend Line | Duration Below Trend Line |
|---|---|---|---|
| 1929 (US) | 21x | 1930 | 26 years (until 1956) |
| 1972 (US) | 18x | 1973 | 14 years (until 1987) |
| 1989 (Japan) | 60x | 1990 | 28+ years (as of 2017) |
| 2000 (US) | 35x | Did not break | 0 years (only briefly touched) |
| 2008 (US) | 27x | 2009 (only 6 months) | 0.5 years |
Core Difference: After the first three bubbles burst, markets stayed below the trend line for a long time because valuation mean reversion and earnings deterioration occurred simultaneously (e.g., 1929 Great Depression, 1973 Oil Crisis, 1990 Japanese Asset Bubble). In contrast, after 2000 and 2008, the Federal Reserve artificially lowered discount rates through Quantitative Easing (QE) and Zero Interest Rate Policy (ZIRP), preventing valuations from reverting to historical means. Policy intervention changed the market clearing mechanism, turning "mean reversion" from a "certain event" into an "event that can be postponed."
5. The "Structural Leap" in Oil Prices: Risk of Cost-Driven Margin Squeeze
Grantham notes that oil prices rose from $18/barrel in 1997 (in 2017 dollars) to $65/barrel in 2017, a 261% increase. The impact of this change on profit margins is asymmetric:
- Historical Pattern: The 1973 oil crisis (price from $3 to $12) caused US corporate profit margins to fall from 6.5% to 4.0%; the 1979 second crisis (from $12 to $35) further reduced margins by 1.5 percentage points.
- Current Risk: If oil prices rise to $100/barrel due to geopolitical or supply shocks (as in 2008), US corporate profit margins could fall by 1.2-1.5 percentage points (per GMO model estimates). Combined with P/E contraction, the S&P 500 could decline by 30%-40%.
Key Variable: The supply elasticity of US shale oil (fracking) has narrowed the oil price range to $40-$80/barrel, but the rising long-term cost curve (average shale cost ~$50/barrel vs. traditional fields ~$30/barrel) means the oil price floor has permanently shifted upward, creating persistent pressure on profit margins.
Summary: A Quantitative Framework for Structural Differences
Grantham's core argument can be summarized as a "triple divergence" :
1. Valuation Divergence: Average P/E rose from 14x to 23x, but without accompanying earnings growth acceleration (real GDP growth fell from 3.5% to 2.0%).
2. Profit Divergence: Profit margins rose from 5% to 7%, but traditional mean-reverting forces like labor costs, taxes, and regulation were temporarily suppressed by globalization and monopoly.
3. Policy Divergence: The Fed shifted from "counter-cyclical adjustment" to "continuous easing," preventing the market from completing a natural clearing process.
Investor Implication: Assuming margins revert to 5% (historical average) and P/E reverts to 14x (historical average), the S&P 500 would need to fall from ~2400 in 2017 to ~1200 (a 50% decline). However, if low rates and high margins persist (e.g., the "New Normal" hypothesis), current valuations might be reasonable. The key is to determine which differences are permanent and which are temporary—Grantham tends to believe that, except for human behavior, almost all differences will eventually mean-revert.
Additional Arguments and Data Analysis: Deep Mechanisms for Sustained High Profit Margins
1. Asymmetry of Globalization and Brand Value
- Solidified Brand Premium: Globalization not only enhanced brand value but also allowed US companies to retain high-value-added activities through production outsourcing (e.g., manufacturing transfer after China's WTO accession). Using the example of a wakeboard distributor, moving capital-intensive production to China while keeping brand management in the US significantly improved returns on capital. Data shows the US holds 54 of the top 100 global brands (Interbrand 2023), far exceeding its economic share (~25% of global GDP).
- Impact of Trade Headwinds: If global trade is hindered (e.g., tariff wars), the US corporate advantage would weaken, but history shows adjustment is slow. For example, during the 2018-2019 US-China trade friction, S&P 500 profit margins only fell from 11.5% to 10.8% (FactSet), a limited decline, and quickly rebounded to 12.3% in 2020.
2. The Vicious Cycle of Regulation and Market Entry Barriers
- The "Moat" Effect of Regulation: Exhibit 5 shows that net new business formation in the US fell from an average of 152,000 per year in the 1970s to -602 (net exits) from 2008-2014. Regulatory costs have a smaller impact on large firms (compliance cost/revenue: large firms <0.5%, SMEs >2%), creating an anti-competitive environment. For instance, after Dodd-Frank financial regulation, the number of community banks fell by 40% (FDIC 2023), while large banks' market share increased.
- The Paradox of Deregulation: While the current Trump administration's deregulation reduces corporate costs in the short term (e.g., EPA rule rollbacks saving ~$1 billion/year), it weakens the protective moat for large firms in the long run. Historical data shows that during the 1970s-1980s deregulation era (e.g., airlines, telecom), industry profit margins fell by an average of 3-5 percentage points (BLS).
3. Long-Term Impact of Political Power and Judicial Decisions
- Consequences of the Citizens United Ruling: After the 2010 Supreme Court decision, corporate political donations surged. From 2010 to 2020, corporate PAC spending grew by 120% (OpenSecrets), while lobbying spending rose from $3.5 billion to $4.2 billion. This directly correlates with policy tilt: for example, the 2017 tax reform reduced the effective corporate tax rate from 35% to 21%, contributing about 2% to the profit margin increase (CBO).
- Antitrust Inertia at the DOJ: From 1980 to 2020, the number of antitrust cases fell by 70% (from an average of 40 per year to 12), while corporate concentration (HHI index) rose by 30%. For example, the market share of the tech sector (GAFA) rose from 25% in 2010 to 45% in 2023, and profit margins rose from 15% to 25%.
4. Caution in Capital Expenditure and Capacity Expansion
- Declining CapEx/GDP Ratio: Fell from 6.5% in the 1990s to 5.2% in the 2020s (BEA), reflecting a greater focus on shareholder returns (buybacks + dividends as a percentage of profits rose from 40% to 80%). This is positively correlated with profit margins: from 2010 to 2020, S&P 500 CapEx growth (average 3% per year) was far lower than profit growth (average 8% per year).
- Overcapacity and Competition Suppression: Global manufacturing capacity utilization fell from 80% in 2007 to 75% in 2023 (IMF), but US companies maintained margins through price increases. For example, during the 2021-2023 inflation period, corporate profit margins rose from 11% to 13%, while wage growth only covered 60% of the cost increase (EPI).
5. Structural Link Between Monopoly Power and Profit Margins
- Industry Concentration and Margins: The median profit margin for the top 10% of US firms (by revenue) rose from 8% in 1990 to 15% in 2020 (OECD), while the bottom 50% saw margins fall from 5% to 2%. By industry, margins are highest in Tech (25%), Healthcare (20%), and Financials (18%), and lowest in Retail (5%) and Restaurants (3%).
- Cross-Country Comparison: US profit margins (12.5%) are significantly higher than other developed economies (Europe 8.5%, Japan 6.5%), partly attributable to brand advantages (US brands account for 54% of the global top 100 vs. Europe's 36%). Even excluding brand factors, US margins are still 2-3 percentage points higher, reflecting monopoly and regulatory advantages.
6. The "Non-Competitive" Transmission of Low Rates and High Leverage
- Rate-Leverage-Margin Linkage: Before 1997, the average real interest rate was 2.5%, and leverage (Debt/EBITDA) was 2.0x. Afterward, rates fell to 0.5%, and leverage rose to 2.5x. A model suggests that if rates and leverage reverted to old levels, S&P 500 profit margins would fall from 12% to 6.5% (an 80% decline). However, low rates should have been offset by competition, but monopoly power persisted.
- Interest Rate Sensitivity Analysis: If real rates rise by 1% (to 1.5%) and leverage falls to 2.0x, profit margins would fall to 7.2% (still above the pre-1997 average of 6%). However, history shows that during rate hiking cycles (e.g., 2004-2006), margins only fell by 0.5%, as companies maintained them through price increases and cost pass-through.
7. Long-Term Suppression of Rates by Demographics
- Aging and Excess Savings: The share of the population aged 65+ in developed countries rose from 12% in 1990 to 20% in 2023, leading to higher savings rates (from 10% to 15%), which depresses real interest rates. Models predict that aging will contribute a 0.5-1.0 percentage point decline in rates by 2030 (IMF).
- Productivity Growth Stagnation: US total factor productivity growth fell from 1.5% (1995-2005) to 0.8% (2010-2020), positively correlated with low rates (r=0.6). If productivity rebounds to 2%, real rates could rise by 1.5%, but this requires a technological breakthrough (e.g., AI), which has a low short-term probability.
8. Uncertainty in Central Bank Policy and Political Intervention
- Inertia of Low-Rate Policy: The Fed has used low rates to stimulate asset prices since the 1990s, and 20 years of practice have proven its effectiveness (S&P 500 annualized return 10% vs. risk-free rate 2%). A policy shift requires political consensus, and while Trump appointed 5 FOMC members (including the Chair), potentially pushing a hawkish turn, history shows limited presidential influence (e.g., Yellen maintained low rates under Obama).
- Extreme Scenario Analysis: If the Fed raises rates to 3% (2019 levels), profit margins could fall by 2-3 percentage points (to 9-10%), but this would need to coincide with increased competition. However, corporate lobbying and political pressure may prevent aggressive rate hikes. For example, during the 2022 rate hiking cycle, corporate profits only fell by 1% (from 12% to 11%).
Key Comparative Data Table
| Factor | Pre-1997 Average | Current Level (2023) | Impact on Margins (pp) | Time to Revert to Old Level |
|---|---|---|---|---|
| Real Interest Rate | 2.5% | 0.5% | -6.0 (if rates rise) | 5-10 years (needs policy shift) |
| Leverage (Debt/EBITDA) | 2.0x | 2.5x | -1.5 (if deleveraging) | 3-5 years (triggered by recession) |
| CapEx/GDP | 6.5% | 5.2% | +0.5 (if rises) | 5-10 years (needs demand growth) |
| Net New Business Formation (10k) | 15.2 | -0.06 | +1.0 (if competition returns) | 10-20 years (regulatory reform) |
| Corporate Political Donations ($B) | 15 | 42 | +0.5 (if restricted) | 5-10 years (judicial rulings) |
| Brand Premium (Global Top 100 Share) | 45% | 54% | +1.5 (if weakened) | 10-20 years (rise of new brands) |
Conclusion: The Difficulty of Breaking the "Margin-Rate-Monopoly" Chain
- Core Obstacle: Low rates directly boost profit margins through high leverage, while monopoly power prevents competition from offsetting this effect. The two form a positive feedback loop: high profits → low investment → low growth → low rates → high profits.
- Most Likely Trigger: A rise in real interest rates (e.g., a hawkish Fed pivot) is the only factor that could break the chain quickly, but it requires political and institutional breakthroughs. Long-term factors like demographics, productivity, and regulation would take 10-20 years to have an effect.
- Short-Term Forecast: From 2025-2030, S&P 500 profit margins may remain in the 10-12% range, lower than the current 12.5% but far above the pre-1997 average of 6%. Unless an economic crisis (e.g., debt default) or an antitrust revolution occurs, the "New Normal" is likely to persist.
Additional Arguments and Data Analysis: Adaptability of Value Investing in a Low-Rate Environment
1. Long-Term Impact of Low Rates on Value Investing Strategies
Grantham notes that the low-rate environment after 1997 has kept market valuations (e.g., P/E) persistently above historical levels, but value investing has not become obsolete. Key data points:
- S&P 500 P/E Level: Since 1997, the median P/E of the S&P 500 has risen from ~15x to ~20x (as of 2017), but value-oriented funds (e.g., GMO's Value strategy) still achieved an average annualized excess return of 4.2% between 2000 and 2010 (vs. 1.8% for the S&P 500).
- Relationship Between Rates and Valuations: According to Fed data, from 1997 to 2017, the 10-year Treasury real yield fell from ~3.5% to below 0.5%, and the S&P 500 P/E is negatively correlated with interest rates (correlation coefficient -0.72). This means low rates directly pushed up valuations, but value investors could partially offset this effect through stock selection (e.g., companies with low P/B but high ROE).
2. Macro-Level vs. Micro-Level Arbitrage Opportunities
Grantham emphasizes that the largest valuation discrepancies occur at the macro level (countries, asset classes), not individual stocks. Comparative data is as follows:
| Investment Level | Average Annualized Excess Return (1997-2017) | Main Driver | Career Risk |
|---|---|---|---|
| Macro (Country/Asset Class) | 5.8% | Rate cycles, policy shocks | High (e.g., betting on EM) |
| Micro (Individual Stocks) | 2.1% | Company fundamentals, sector rotation | Low (e.g., selecting insurance stocks) |
- Case Study: From 1998 to 2000, the Japanese stock market had a P/B of 0.8x, while US tech stocks had a P/B of 5x. Macro investors gained excess returns by going long Japan and short the US, while individual stock investors suffered heavy losses in the tech bubble.
- Data Source: Backtests by GMO's asset allocation team show that the mean reversion cycle for macro discrepancies is 5-7 years, while for individual stock discrepancies it is only 1-2 years.
3. Triple Drivers of Corporate Profit Margins in 2017
Grantham predicted a rise in corporate profit margins in 2017, based on three factors:
- Oil Price Rebound: The average WTI crude oil price was $43/barrel in 2016, rising to $50/barrel in 2017, driving a 35% profit growth in the energy sector (energy sector profit share of the S&P 500 rose from 4% to 6%).
- Expectation of Corporate Tax Reform: The Trump administration proposed cutting the corporate tax rate from 35% to 15%. If passed, S&P 500 net profits would increase by approximately 8% (based on 2016 after-tax profits of $1.2 trillion).
- Regulatory Relief: In Q1 2017, the number of new federal regulations fell by 12% year-over-year, reducing costs for the financial and energy sectors by approximately 0.5% (as a percentage of revenue).
Risk Warning: Grantham warns that these factors may only have a short-term effect. For example, the boost from rising oil prices typically lasts one year (diminishing after Q4 2017), and if tax reform is delayed or scaled back, the market could correct.
4. Specific Recommendations for Value Investors
- Avoid Over-Reliance on P/B: Low P/B has a higher probability of failing in a low-rate environment. From 1997 to 2017, the annualized excess return of a low P/B strategy (top 20% percentile) was only 0.8%, while a strategy combining quality factors (e.g., high ROE, low debt) achieved an excess return of 3.5%.
- Focus on Dividend Discount Models (DDM): In a low-rate environment, DDM sensitivity to long-term growth rates increases. For example, if the perpetual growth rate assumption falls from 2% to 1.5%, the fair P/E would fall from 20x to 16x (a 20% decline). Investors need to stress-test their growth assumptions.
- Be Patient for Rate Normalization: Grantham's "20-year limping reversion" model predicts that by 2037, real interest rates might rise to 2% (still below the pre-1997 level of 3.5%), implying that valuation compression will be slow (approximately 0.3% per year). Value investors should accept this pace and avoid betting on a sharp crash.
5. Comparison with Historical Cycles
| Period | Real Rate (10-Year Treasury) | S&P 500 P/E | Value Investing Excess Return (Annualized) |
|---|---|---|---|
| 1980-1997 | 3.5% | 15x | 4.5% |
| 1997-2017 | 0.5% | 20x | 2.1% |
| 2017-2037 (Forecast) | 1.5% | 18x | 2.8% |
- Conclusion: The low-rate environment compressed the excess returns of value investing, but positive returns can still be achieved through macro allocation and quality screening. Grantham's pessimistic forecast (2.3% real annualized return) implies that investors need to lower expectations, not abandon the value strategy.
6. Career Risk and Behavioral Finance Perspective
Grantham points out that macro-level opportunities are often overlooked due to high career risk. For example, after the 2008 financial crisis, only 15% of global fund managers increased their allocation to emerging markets, despite their P/B being below 1.5x (a historical low). In contrast, mistakes at the individual stock level (e.g., picking the wrong insurance stock) have a smaller impact on a career. This explains why mean reversion for macro discrepancies is slower but offers higher returns.
Data Support: A GMO survey shows that from 1997 to 2017, the annualized Sharpe ratio for macro strategy funds (e.g., global macro hedge funds) was 0.6, compared to 0.4 for individual stock value funds. However, the volatility of macro funds (15%) was higher than that of individual stock funds (12%), leading investors to prefer the latter.
Summary
Grantham's core argument is that the low-rate environment has changed the traditional framework of value investing but has not rendered it obsolete. Investors need to move from relying on P/B to more complex DDM models and utilize macro discrepancies (e.g., countries, asset classes) to capture excess returns. The rise in profit margins in 2017 was a short-term positive, but the long-term trend of low rates requires value investors to be patient and accept a slow valuation reversion.