China’s Inclusion in the GBI-EMGD Benchmark: Beta and Alpha Implications
GMO is a Boston asset manager co-founded in 1977 by Jeremy Grantham with Richard Mayo and Eyk Van Otterloo, known for valuation-driven dynamic asset allocation built on long-horizon mean reversion. Grantham is famous for calling historic bubbles, warning publicly ahead of both the 2000 dot-com crash and the 2008 financial crisis. Flagship publications include the GMO Quarterly Letter (now written by Asset Allocation co-heads Ben Inker and John Pease), Grantham's Viewpoints essays and the 7-Year Asset Class Forecast.
In plain words
This report explains how China's inclusion in a key emerging-market bond index (GBI-EMGD, a benchmark for local-currency bonds) changes the game for investors. The index's yield dropped from 5.0% to 4.7% because Chinese bonds offer lower returns. More importantly, China's interest rates behave differently from other emerging markets—they move opposite to global risk sentiment (when risk appetite rises, Chinese rates may fall), and 70% of their fluctuations can't be explained by global factors. This makes investing harder and less predictable. For ordinary investors, it means index-tracking funds may yield less, and managing Chinese bonds requires special tools like offshore interest-rate swaps. Worth reading because it shows why emerging-market investing is no longer straightforward.
J.P. Morgan has incorporated Chinese local government bonds into the GBI-EMGD benchmark, implemented in phases. By November 2020, the China sub-index weight will reach the 10% cap, reducing the benchmark's forward yield by 26 basis points to 4.7%, with duration largely maintained at 5.5 and credit r
Theme and Background
This chapter discusses the impact of J.P. Morgan's inclusion of Chinese local government bonds in the GBI-EMGD benchmark on emerging market local currency debt investments. GMO argues that this inclusion will significantly alter the asset class's valuation and alpha prospects, with duration allocation to Chinese interest rates posing the greatest challenge.
Core Views
- China's inclusion in the GBI-EMGD reduces the overall valuation appeal of the asset class: models indicate the renminbi is overvalued, shifting the weighted expected return from the "attractive" range to the top of the "neutral" range.
- In terms of alpha prospects, duration allocation to Chinese interest rates is the biggest challenge, while the FX and sovereign/quasi-sovereign credit segments are less affected due to China's existing inclusion.
- GMO remains confident that its differentiated process can continue to generate sustainable returns that outperform the new benchmark.
Key Arguments and Data
- Benchmark changes: By November 30, 2020, the China sub-index weight will reach the 10% cap, with only nine Chinese bonds included (average yield 2.9%, duration 5.6).
- Overall impact: The forward-looking yield declines by 26 basis points to 4.7%, duration remains largely unchanged at 5.5, and the credit rating stays at BBB/BBB/BBB.
- Regional weight changes: Asia's weight rises from 26.0% to 34.2% (+8.2%), Europe falls from 32.1% to 27.6% (-4.5%), Latin America drops from 32.8% to 30.9% (-1.9%), and the Middle East/Africa declines from 9.1% to 7.4% (-1.8%).
- Valuation metrics: With China included, the GBI-EMGD weighted real yield spread falls from 1.7% to 1.57%; the weighted expected FX spot return moves from near the "attractive" threshold to the top of the neutral range.
- Transaction costs: Trading Chinese onshore bonds involves multiple fees (e.g., CFETS trading fee of 0.025 bps, Bond Connect service fee of 0.25-0.60 bps, Tradeweb execution fee of 0.25-0.50 bps, etc.), making it extremely challenging to achieve benchmark returns.
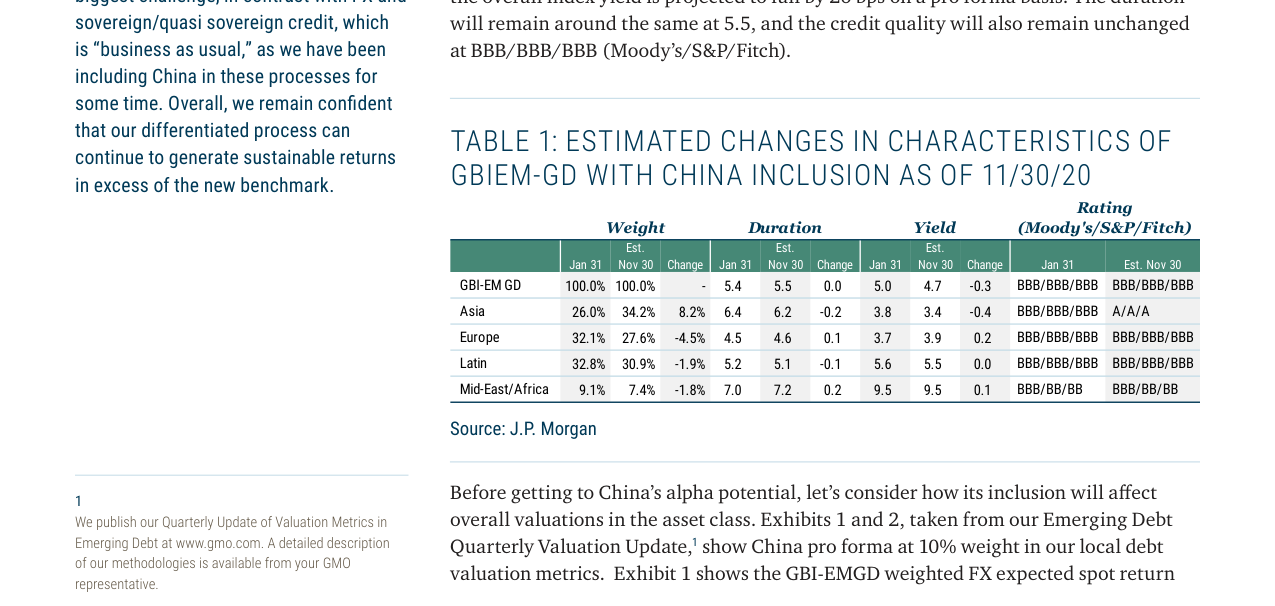
After China's inclusion, Asia's weight rises from 26.0% to 34.2%, the index's overall yield falls from 5.0% to 4.7% (a decline of 26 bps), and duration remains unchanged at 5.5
Table: Changes in GBI-EMGD Benchmark Characteristics (January 31, 2020 vs. November 30, 2020)
| Metric | January 31 | November 30 (Estimated) | Change |
|---|---|---|---|
| Weight | 100.0% | 100.0% | - |
| Duration | 5.4 | 5.5 | 0.0 |
| Yield | 5.0% | 4.7% | -0.3% |
| Credit Rating | BBB/BBB/BBB | BBB/BBB/BBB | Unchanged |
Companies/Assets Involved
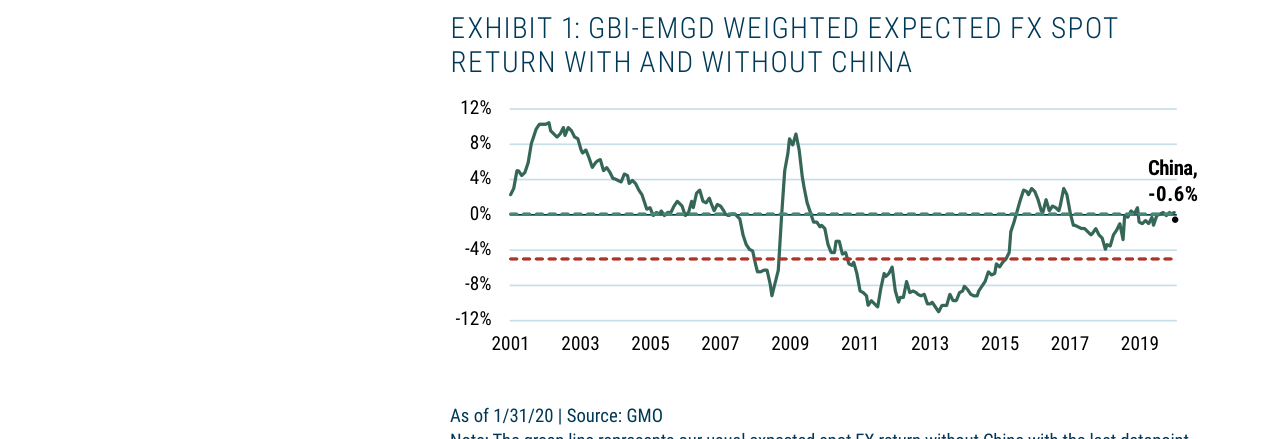
GBI-EMGD weighted expected FX spot return trend from 2001 to 2020, with the data point for November 30, 2020, after China's inclusion at -0.6%
- China Sovereign Bonds (CGBs): Nine bonds included in the benchmark, with an average yield of 2.9% and duration of 5.6. GMO believes the renminbi is overvalued but holds a long USDCNY position as a defensive hedge.
- China Quasi-Sovereign Bonds (SOEs): Approximately 25 central government issuers are in the EMBIG benchmark, with some (mainly banks) also issuing onshore/offshore CNY/CNH bonds. GMO expresses concerns about the structural subordination risk of offshore bonds and the immaturity of disclosure and legal jurisdictions for onshore bonds.
- Other Squeezed Issuing Countries: High-yield issuers such as South Africa, Russia, and Turkey, as well as low-yield issuers like the Czech Republic, Poland, Hungary, and Thailand, see their weights decline.
Investment Implications
- Duration Allocation is the Core Challenge: Allocating duration to Chinese interest rates is the most difficult task. GMO will use the offshore non-deliverable interest rate swap market (with tenors up to 5 years) to restore benchmark duration.
- FX Strategy Remains Defensive: With USDCNY near 7, GMO continues to hold a long USDCNY position, as virus-induced rate cuts have reduced the cost of negative carry.
- Credit Selection Requires Caution: Extra caution is needed in assessing Chinese sovereign credit (low transparency, insufficient disclosure), and SOE bonds warrant vigilance against unknown default risks from reforms.
- Instrument Selection is Key: Due to high onshore bond trading costs, GMO will focus on using offshore Chinese sovereign/quasi-sovereign bonds (in any currency, including CNH/CNY) and interest rate swaps to track the benchmark and generate alpha.
Additional Analysis: PCA Results of the Chinese Interest Rate Market and Investment Strategy Challenges
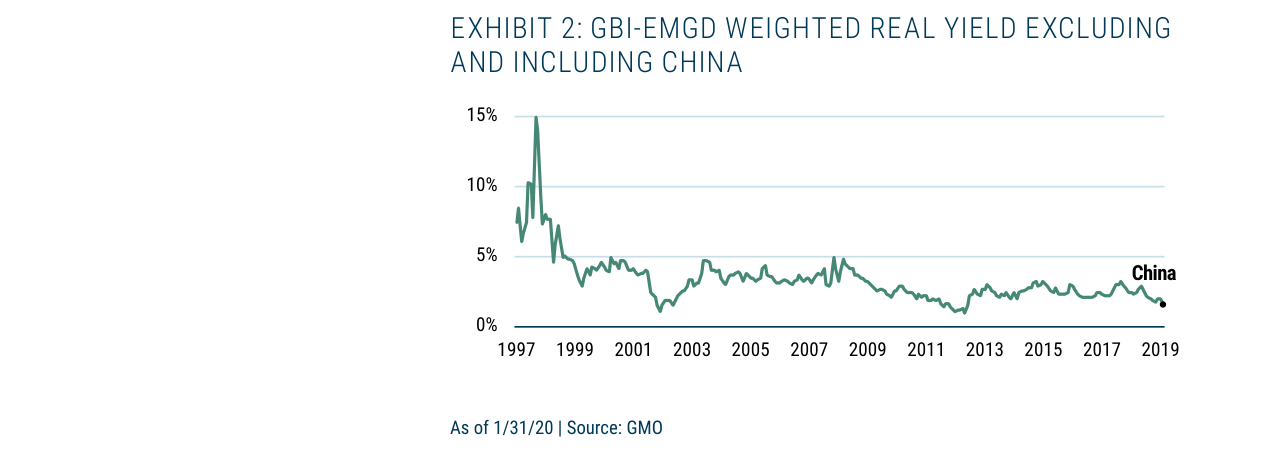
GBI-EMGD weighted real yield trend from 1997 to 2019, with the real yield spread falling from 1.7% to 1.57% after China's inclusion
1. Uniqueness of the Chinese Interest Rate Market Revealed by PCA
Principal Component Analysis (PCA) results further quantify the degree of decoupling between the Chinese interest rate market and global markets. Table 3 data shows that the loading of China's onshore 5-year interest rate on the first principal component (U.S./E.U. rate changes, explaining approximately 32% of EM rate volatility) is only 0.1, far lower than typical EM markets such as Brazil (0.2) and Mexico (0.3). More critically, China's loading on the second principal component (global risk sentiment, explaining approximately 9% of volatility) is -0.3, in stark contrast to the positive correlation seen in most GBI-EMGD markets (e.g., South Africa 0.2, Indonesia 0.1). This negative correlation implies that Chinese interest rates may decline when risk appetite rises, contradicting the traditional EM market pattern of "rising risk appetite → rising interest rates."
| Market | Comp 1: U.S./E.U. Rates | Comp 2: Risk | Comp 3: E.U. vs Asia/Latam | Unexplained |
|---|---|---|---|---|
| China | 0.1 | -0.3 | 0.2 | 0.7 |
| Brazil | 0.2 | 0.2 | 0.3 | 0.4 |
| South Africa | 0.3 | 0.2 | 0.0 | 0.5 |
| Thailand | 0.2 | -0.5 | 0.2 | 0.3 |
2. The "Island Effect" of the Chinese Interest Rate Market and Quantitative Challenges
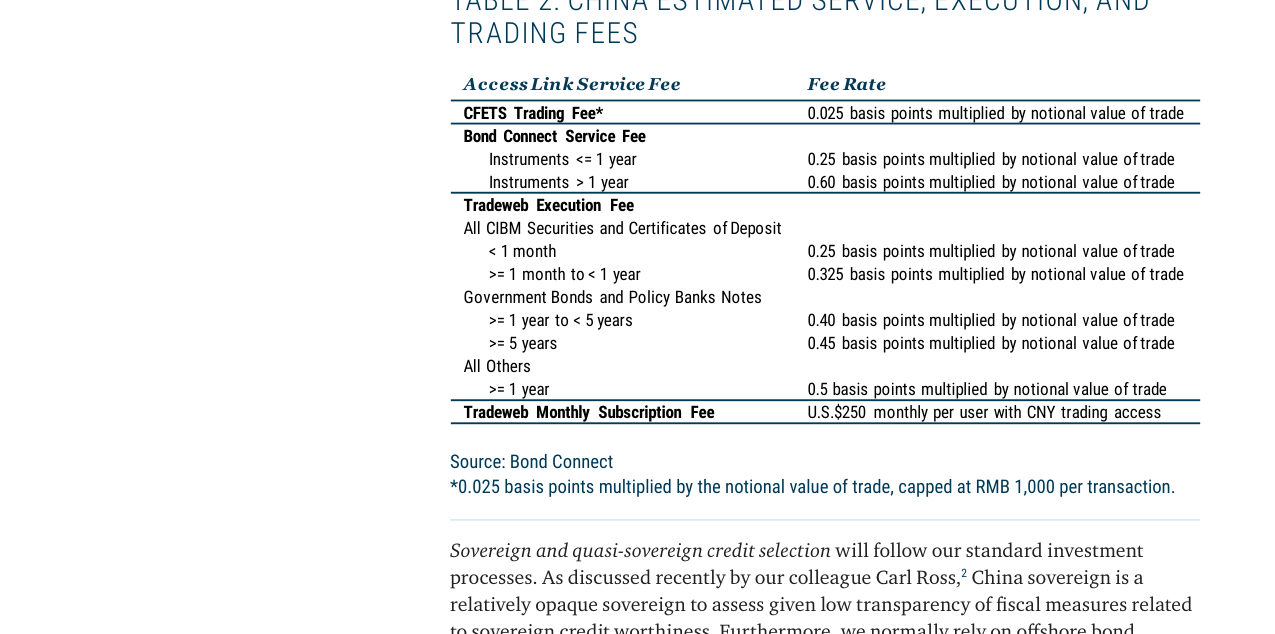
Fee structure for China's bond market transactions: CFETS trading fee 0.025 bps, Bond Connect service fee 0.25-0.60 bps, Tradeweb execution fee 0.25-0.5 bps
The high "unexplained variance" (0.7) of the Chinese interest rate market indicates that 70% of its volatility cannot be explained by global factors (U.S./E.U. rates, risk sentiment, regional divergence), far exceeding markets like Brazil (0.4) and South Africa (0.5). This reinforces the earlier assertion that "Chinese local bonds do not move in sync with other markets." The author explicitly states that treating Chinese interest rates as an independent market and identifying their absolute directional drivers is even more challenging than forecasting U.S. dollar interest rates. This judgment is based on two points:
- Policy Dominance: Chinese interest rates are primarily driven by domestic factors such as central bank monetary policy, credit controls, and fiscal stimulus, with a weak link to the global liquidity cycle.
- Insufficient Market Depth: Although China's bond market is the second largest globally, foreign holdings account for only about 3% (as of early 2020), and trading behavior is still dominated by domestic institutions, leading to a price discovery mechanism that is disconnected from EM markets.
3. Investment Strategy Adjustment: From "Relative Value" to "Process Reconstruction"
Faced with the uniqueness of Chinese interest rates, GMO's strategy is not simply to increase exposure but to prioritize the "evolution of the local interest rate process" as the primary quantitative research task for 2020. This decision, based on foundational work over the past two years, aims to develop models that can capture the independent drivers of Chinese interest rates. Specific directions may include:
- Factor Decomposition: Extracting China-specific interest rate drivers from domestic economic data (e.g., PMI, credit impulse) and policy signals (e.g., MLF rate, reserve requirement ratio).
- Risk Budget Rebalancing: Currently, interest rate activity already has the lowest weight in the overall alpha expectation, but the PCA results further demonstrate that even with increased weight, traditional cross-market relative value strategies are unlikely to be effective. Therefore, research focus may shift toward "asymmetric risk hedging" or "event-driven trading."
4. Comparative Data: PCA Loading Differences Between China and Typical EM Markets
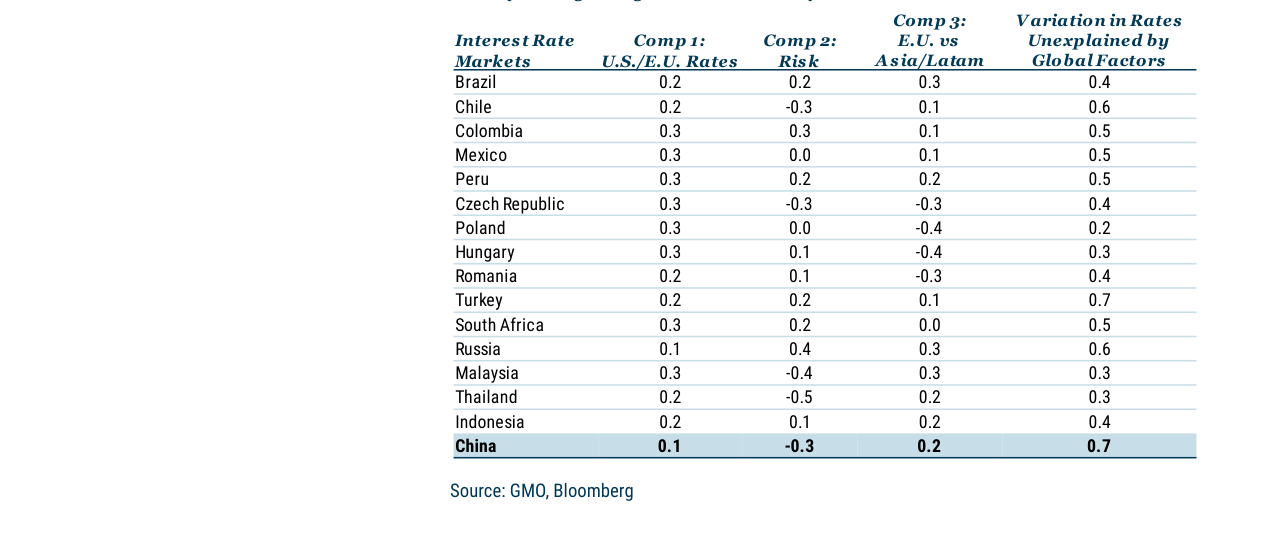
Principal component analysis of interest rate changes from 2011 to 2020: China's interest rate correlation with the U.S./E.U. rate factor is 0.1, and it has a -0.3 negative correlation with the risk factor
| Factor | China | Brazil | South Africa | Thailand |
|---|---|---|---|---|
| Comp 1 (U.S./E.U. Rates) | 0.1 | 0.2 | 0.3 | 0.2 |
| Comp 2 (Risk Sentiment) | -0.3 | 0.2 | 0.2 | -0.5 |
| Unexplained Variance | 0.7 | 0.4 | 0.5 | 0.3 |
- China vs. Thailand: Both show a negative correlation with risk sentiment (-0.3 vs. -0.5), but Thailand's unexplained variance (0.3) is far lower than China's (0.7), indicating that Thai interest rates are more easily explained by regional factors (Comp 3: E.U. vs Asia/Latam).
- China vs. Russia: Russia's loading on Comp 1 is only 0.1 (same as China), but its loading on risk sentiment is 0.4 (positive), with an unexplained variance of 0.6, suggesting it is influenced by unique factors such as geopolitics.
5. Conclusion and Outlook
GMO's conclusion emphasizes that despite the challenges posed by China's inclusion in the GBI-EMGD, the existing investment process (security selection + currency selection, accounting for 90% of the risk budget) is already sufficient to capture Chinese opportunities. The interest rate process research will serve as a supplement rather than a core strategy adjustment. This stance implies:
- Short-term: Exposure to Chinese interest rates may remain at a low weight to avoid drawdowns from model failure.
- Long-term: If the 2020 research is successful, Chinese interest rates could become an independent source of alpha, but this requires verification of whether their dynamic relationship with global factors changes as foreign capital inflows increase.
The background of the author team (Victoria Courmes and Tina Vandersteel) in quantitative strategies and emerging market experience further supports GMO's technology-oriented approach in complex markets. The disclaimer notes that views are as of March 2020, and subsequent market changes (e.g., increased correlation between Chinese interest rates and global markets post-pandemic) may revise the above conclusions.