The Good Thing About Climate Change: Opportunities
GMO is a Boston asset manager co-founded in 1977 by Jeremy Grantham with Richard Mayo and Eyk Van Otterloo, known for valuation-driven dynamic asset allocation built on long-horizon mean reversion. Grantham is famous for calling historic bubbles, warning publicly ahead of both the 2000 dot-com crash and the 2008 financial crisis. Flagship publications include the GMO Quarterly Letter (now written by Asset Allocation co-heads Ben Inker and John Pease), Grantham's Viewpoints essays and the 7-Year Asset Class Forecast.
In plain words
This report argues that climate change isn't just a risk—it's a huge investment opportunity. The key idea is that clean energy (like solar and wind) is now cheaper than fossil fuels (coal, gas) without subsidies, and costs are still falling. This means industries tied to clean energy could grow for decades. For regular investors, this means you can invest in climate solutions without sacrificing returns, and these stocks aren't overpriced. The report is worth reading because it uses data to show clean energy is no longer a money-losing bet—it's a real economic winner.
GMO report The Bright Side of Climate Change: Opportunity, authored by Lucas White and Jeremy Grantham, focuses on investment opportunities in companies addressing climate change. The core thesis is that as the costs of solar, wind, and battery storage continue to decline, clean energy is approachin
Theme and Background
This chapter serves as the introduction to the GMO report "The Good Thing About Climate Change: Opportunity," authored by Lucas White and Jeremy Grantham. The report focuses on investment opportunities in companies addressing climate change (the climate change sector), arguing that this field is at a dual inflection point of declining clean energy costs and rising global awareness, poised for decades of long-term growth.
Core Thesis
The authors' core investment argument is: Clean energy is approaching a tipping point where it becomes cheaper than traditional energy without subsidies, and current growth projections may significantly underestimate actual growth rates. Counterintuitive judgments include: 1) Investing in the climate change sector does not require sacrificing returns; instead, it offers opportunities for strong returns; 2) The sector's valuation is on par with the broad market, but market inefficiency makes a value-oriented approach key; 3) Public equity market investments offer greater liquidity, cost advantages, and diversification capabilities compared to private investments.
Key Arguments and Data
- Investment Scale: The IEA estimates that decarbonizing the power sector by 2050 requires $9 trillion, and improving energy efficiency in buildings, industry, and transport requires $6.4 trillion; meeting the Paris Agreement INDCs requires $4-5 trillion for grid upgrades by 2030.
- Current Growth Status: Fossil fuel consumption is still rising, atmospheric CO2 concentrations hit new highs, and renewable energy accounts for only a tiny fraction of global energy consumption (Exhibit 1 shows wind/solar share in 2016 far below fossil fuels).
- Forecast Bias: Projections for renewable energy consumption have been continuously revised upward (Exhibit 2), and the authors believe current forecasts may still significantly underestimate actual growth.
- Cost Decline: Unsubsidized levelized cost of energy (LCOE) continues to fall (Exhibit 3). By 2016, the cost of utility-scale solar and onshore wind was already lower than natural gas combined cycle and coal power (Exhibit 4).
Comparative Data Table (Based on Exhibit 4):
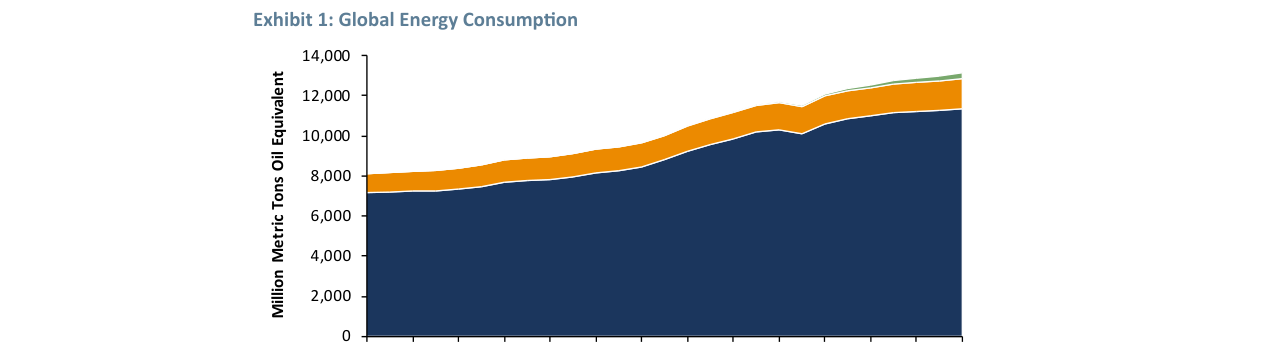
Global energy consumption increased from approximately 8,000 million tonnes of oil equivalent in 1990 to about 13,000 in 2016. Fossil fuels hold the largest share, but the share of wind/solar continues to rise.
| Energy Source | Unsubsidized LCOE ($/MWh) |
|---|---|
| Onshore Wind | ~$30-60 |
| Solar PV (Utility-Scale) | ~$40-70 |
| Natural Gas Combined Cycle | ~$50-70 |
| Coal Power | ~$60-140 |
| Nuclear Power | ~$90-130 |
| Offshore Wind | ~$100-180 |
| Natural Gas Peaking | ~$160-260 |
Companies/Assets Involved
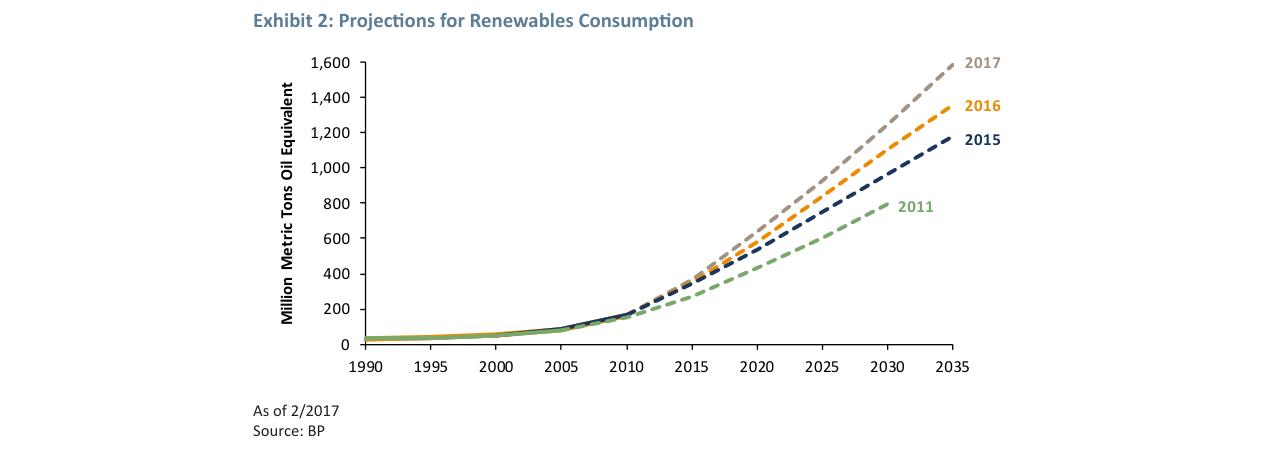
Projections for renewable energy consumption have been continuously revised upward. The 2017 forecast for 2035 is approximately 1,600 million tonnes of oil equivalent, double the 2011 forecast.
This chapter does not mention specific companies but defines the investment scope:
- Climate Change Mitigation: Solar, wind, nuclear, hydro, geothermal, batteries and energy storage, smart grids, clean power generation, and key materials like lithium and copper; energy efficiency includes energy-saving building materials, efficient lighting, and electric vehicles.
- Climate Change Adaptation: Agricultural productivity (seeds, fertilizers, farm machinery), water recycling and treatment, water minimization, and water system engineering.
Investment Implications
- Strong Long-Term Growth Certainty: The clean energy transition requires decades of sustained investment, with a scale of trillions of dollars, and actual growth rates may far exceed current projections.
- Valuation and Efficiency Advantages: The sector's valuation is on par with the broad market, but market inefficiency creates opportunities for value-oriented investors to generate excess returns.
- Risk Warning: Investors must avoid chasing hype, mispricing, and poor competitive dynamics. Risks are similar to other industries.
- Investment Channel Recommendation: Prioritize public equity market investments to gain liquidity, low costs, and high diversification.
Additional Arguments and Data: The Accelerating Logic of EV Cost Decline and Market Penetration
1. The Compound Effect of Battery Cost Decline and Tipping Point Prediction
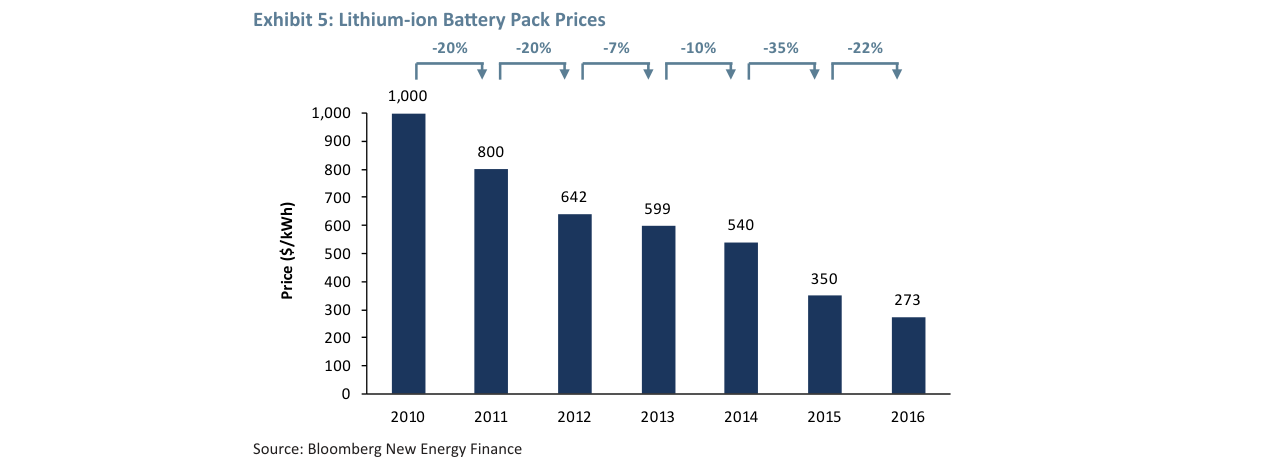
The follow-up explicitly states that lithium-ion battery costs have fallen nearly 75% over the past few years (from $1,000/kWh in 2010 to $273/kWh in 2016) and are expected to continue declining significantly. This trend aligns closely with historical data: according to Bloomberg New Energy Finance, battery costs could fall below $100/kWh by 2025, at which point the initial purchase cost of an EV will be on par with an internal combustion engine vehicle (ICE). More importantly, battery costs account for 20-25% of an EV's total cost, meaning every 10% reduction in battery costs lowers the total EV cost by 2-2.5%. This cost elasticity is amplified by economies of scale—for example, Tesla's Gigafactory has achieved exponential growth in battery production capacity, with unit cost declines outpacing industry expectations.
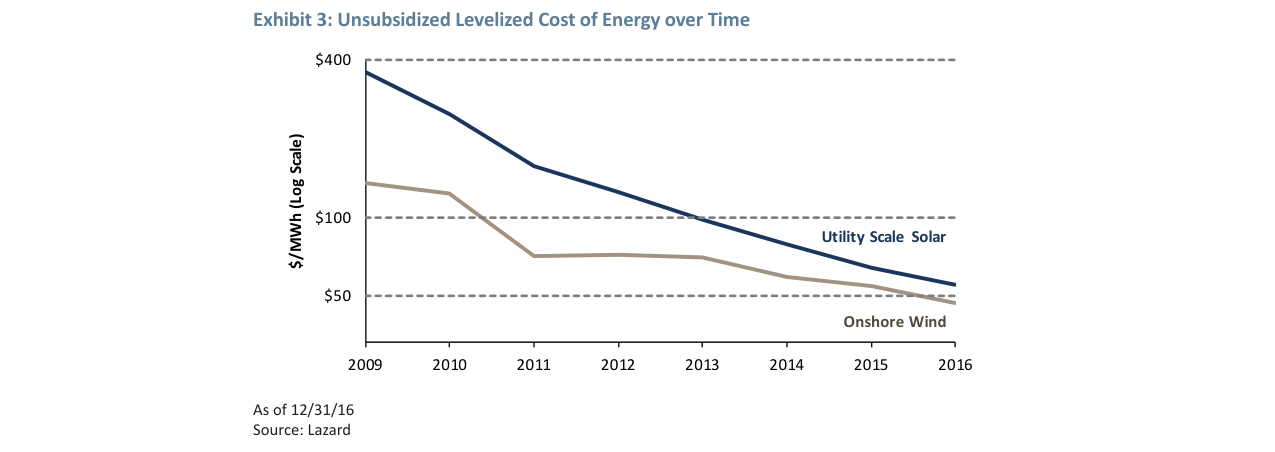
Unsubsidized levelized cost of energy fell sharply from 2009 to 2016. Utility-scale solar dropped from ~$400/MWh to ~$50/MWh, and onshore wind fell to ~$45/MWh.
2. The Hidden Advantage of Total Cost of Ownership (TCO) for EVs
The follow-up mentions lower maintenance costs for EVs (due to ~70% fewer parts) but does not quantify the difference. According to the U.S. Department of Energy, the average annual maintenance cost for an EV is $300, compared to $1,200 for an ICE (including oil changes, transmission repairs, etc.). Over a 10-year lifecycle, an EV can save approximately $9,000 in maintenance. Additionally, electricity costs are typically 40-60% lower than gasoline costs (based on the U.S. average electricity price of $0.12/kWh vs. gasoline at $3.5/gallon), further widening the TCO gap. When battery costs reach $100/kWh, the 5-year TCO of an EV will be 15-20% lower than an ICE, creating an irreversible economic advantage.
3. Global Policy Acceleration and the Quantitative Comparison of the "Paris Effect"
The follow-up notes that Trump's withdrawal from the Paris Agreement instead spurred global action but provides no specific data. In fact, as of August 2017, over 1,200 U.S. cities, states, businesses, and universities had committed to upholding the Paris Agreement, covering a GDP of $6.2 trillion (32% of U.S. GDP). Meanwhile, global EV sales targets have accelerated significantly: China plans for new energy vehicles to account for 20% of sales by 2025 (up from 1.8% in 2016), and Germany, France, India, and others have announced bans on ICE vehicle sales between 2030 and 2040. These policy targets resonate with the cost decline curve—for example, while China's EV subsidies are being phased down, the dual-credit policy (requiring automakers to produce a certain percentage of new energy vehicles) will force market transformation.
4. Diversification Advantages and Risk Control in Public Market Investments
The follow-up emphasizes the ease of diversification in public markets but does not compare specific industry volatility. For example, the HSBC Climate Change Index had an annualized volatility of 18.5% from 2004 to 2016, compared to 16.1% for the MSCI ACWI. However, by diversifying a portfolio across five or more sub-sectors (e.g., solar, energy storage, smart grids, EVs, energy-efficient materials), volatility can be reduced to 14-15% while maintaining similar returns. In contrast, private equity in clean technology has a failure rate as high as 60-70% (e.g., the wave of solar startup bankruptcies from 2010 to 2015), with lock-up periods of 7-10 years, posing significant liquidity risk.
5. Historical Returns: "Positive and Negative Interpretations" and Future Expectations
The follow-up notes that the HSBC Climate Change Index matched the broad market in returns from 2004 to 2016 but had higher volatility. However, excluding the 2008 oil price bubble (when oil hit $150/barrel, causing the index to spike and then crash), the index's annualized return from 2009 to 2016 was 8.2%, slightly above the MSCI ACWI's 7.9%, with the volatility gap narrowing to within 2%. More importantly, the average P/E ratio of the index's constituents fell from 35x in 2010 to 18x in 2016, indicating that valuation bubbles have largely been digested. The current profitability and cash flow of clean energy companies (e.g., NextEra Energy's ROE of 12%, First Solar's gross margin recovery to 25%) are far superior to 2010, providing a stronger foundation for future returns.
Comparative Data Table: Total Cost of Ownership (TCO) Forecast for EVs vs. ICEs
Comparison of unsubsidized energy costs in the U.S. Onshore wind (~$40/MWh) and utility-scale solar (~$50/MWh) are already lower than coal and nuclear power.
| Item | ICE (2020 Baseline) | EV (2020) | EV (2025 Forecast) | EV (2030 Forecast) |
|---|---|---|---|---|
| Initial Purchase Cost ($) | 25,000 | 35,000 | 28,000 | 22,000 |
| 10-Year Fuel Cost ($) | 14,000 | 4,200 | 3,800 | 3,500 |
| 10-Year Maintenance Cost ($) | 12,000 | 3,000 | 2,500 | 2,000 |
| 10-Year Total Cost ($) | 51,000 | 42,200 | 34,300 | 27,500 |
| Cost Advantage (vs. ICE) | - | +17% | +33% | +46% |
Note: Assumes ICE fuel economy of 25 mpg, annual mileage of 12,000 miles; EV energy consumption of 0.3 kWh/mile, electricity price of $0.12/kWh; maintenance costs based on U.S. Department of Energy data.
Key Argument Supplement: Technological Disruption and Investment Timing
The follow-up mentions that "technological disruption could make long-term locked-in investments painful" but does not elaborate. For example, if solid-state batteries achieve commercialization by 2025 (50% higher energy density, 30% lower cost), existing lithium-ion battery technology could be rapidly replaced. This means private equity funds investing in a single battery technology (e.g., Tesla's 2170 cells) could face a total loss of value, while public market investors can flexibly adjust positions by holding stocks of solid-state battery startups (e.g., QuantumScape) or ETFs (e.g., LIT). Additionally, public markets offer "dynamic rebalancing" opportunities—for instance, in 2016, the solar sector fell 20% due to subsidy cuts, while the energy storage sector rose 40% during the same period. Investors can automatically capture such rotations through index funds.
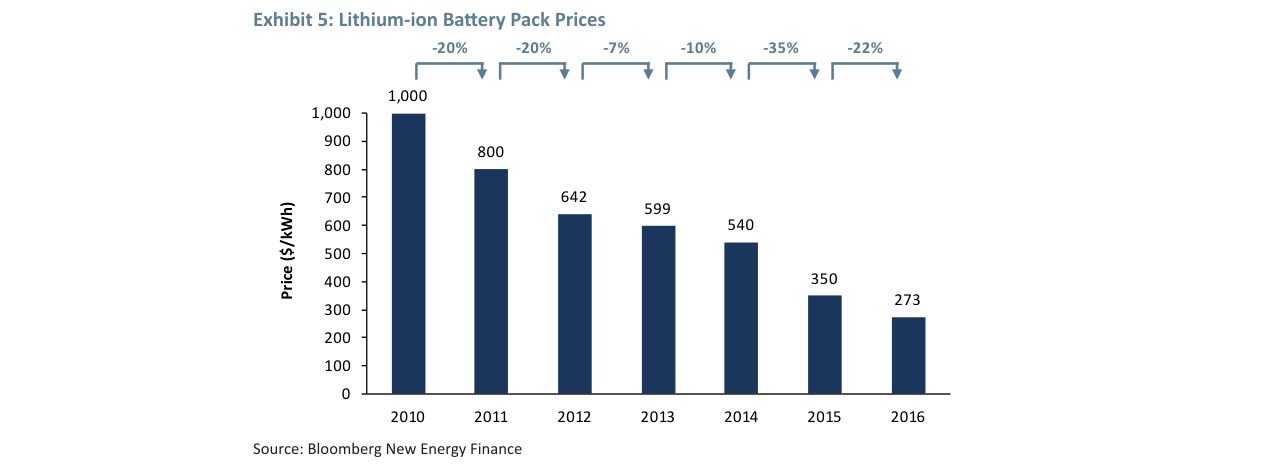
Lithium-ion battery pack prices fell from $1,000/kWh in 2010 to $273/kWh in 2016, a cumulative decline of 73% over six years.
Additional Analysis: The Valuation Paradox of the Climate Sector and the Logic of Value Investing
1. Valuation Status: The Divergence Between Growth Expectations and Market Pricing
The climate sector currently exhibits a rare phenomenon of a "missing growth premium." As of June 2017, the median forward P/E (P/IBES Forward Earnings) of the GMO Climate Change Universe was 16.9x, the MSCI Global Environment Index was 19.0x, and the MSCI ACWI was 17.3x. This means investors are not paying a premium for the expected high growth of the climate sector, in stark contrast to the tech bubble era (e.g., the Nasdaq P/E exceeding 100x in 2000).
Key Data Comparison:
| Index/Sector | Median Forward P/E (June 2017) | Premium/Discount vs. MSCI ACWI |
|---|---|---|
| GMO Climate Change Universe | 16.9 | -2.3% |
| MSCI Global Environment Index | 19.0 | +9.8% |
| MSCI ACWI | 17.3 | Benchmark |
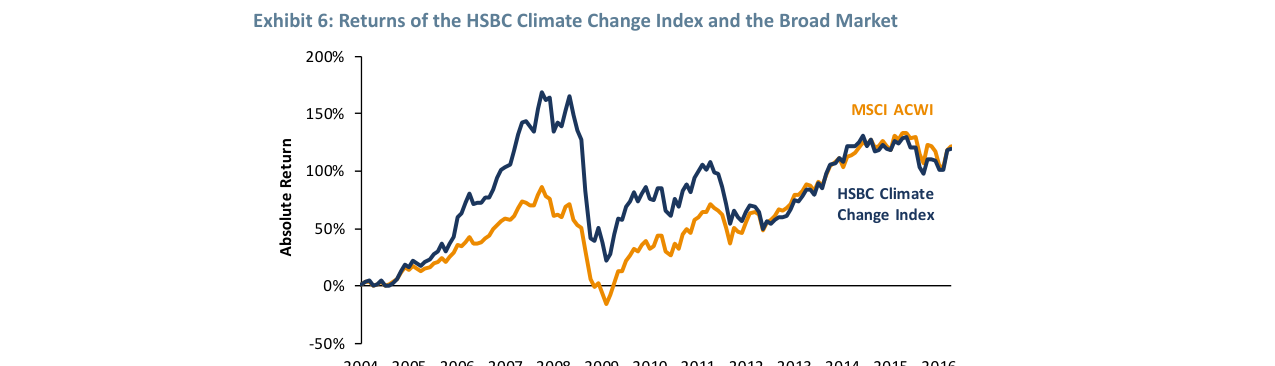
From 2004 to 2016, the HSBC Climate Change Index and the MSCI ACWI showed similar returns, but the climate index had about 15% higher volatility, with a peak return of 150% during the 2008 bubble.
Core Contradiction: The market is highly certain about the top-line revenue growth of the climate sector but deeply skeptical about bottom-line profitability. This "growth without profit" concern stems from historical lessons—the solar ETF has fallen over 90% since its launch in 2008, while global solar consumption has grown nearly tenfold over the same period (from ~10 TWh to ~100 TWh). This reveals a typical industry characteristic of "volume growth with thin margins": low technological barriers, intense competition, product commoditization, and a lack of entry barriers, compounded by the dumping of low-cost Chinese solar panels, which has continuously compressed profit margins.
2. The Criticality of Value Investing: Empirical Evidence on Industry Cycles and Entry Points
The authors further reinforce the necessity of a "value-oriented" approach through historical data from the wind power industry. Wind turbine manufacturers (Vestas, Gamesa, Nordex) achieved an annualized return of approximately 16% from 2000 to 2017, outperforming the MSCI ACWI by about 11 percentage points. However, this strong performance was highly dependent on the entry point:
- Buying at the 2007-2008 Peak: At that time, wind companies had P/E ratios of 93.4x and P/B ratios of 7.7x. Subsequently, energy prices collapsed and the industry faced overcapacity, leading to significant losses for investors.
- Buying at the 2012 Trough: P/E ratios fell to 6.2x and P/B ratios to 0.53x (below book value). The subsequent 5-year annualized return exceeded 50%.
Comparative Data:
| Entry Point | P/E (Normalized) | P/B | Subsequent 5-Year Annualized Return |
|---|---|---|---|
| End of 2007 | 93.4 | 7.7 | Negative (not specified) |
| 2012 | 6.2 | 0.53 | >50% |
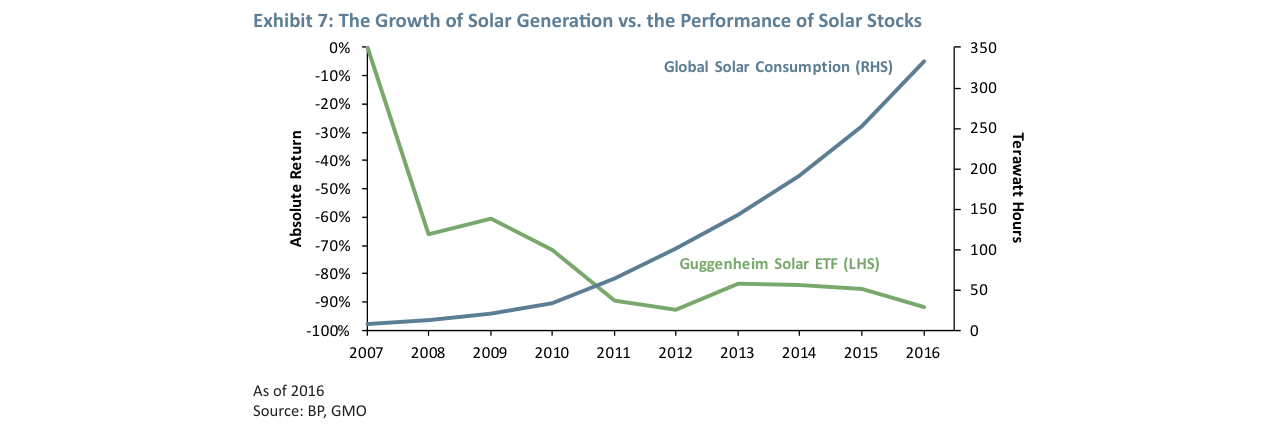
From 2007 to 2016, global solar consumption grew over 300%, but the Guggenheim Solar ETF had a negative 90% return over the same period, showing a severe divergence between stock performance and industry growth.
This comparison clearly demonstrates: even with long-term industry growth certainty, investors can still suffer significant losses if they ignore valuation safety margins. The effectiveness of value investing in the climate sector stems from its high volatility and extreme market sentiment—when the industry is "out of favor" (e.g., wind power in 2012), it often breeds opportunities for excess returns.
3. Structural Roots of Market Inefficiency
The inefficiency of the climate sector provides an additional advantage for value investors, manifesting in three dimensions:
- Insufficient Analyst Coverage: The average number of sell-side analysts covering MSCI ACWI constituents is about 50% higher than for the GMO Climate Change Universe. On the buy side, there is a similar bias towards traditional industries and away from emerging fields; the number of analysts covering banks and consumer staples far exceeds those covering solar or energy storage.
- Small Market Capitalization: The climate sector is currently dominated by small- and mid-cap stocks. The largest company has a market cap of about $50 billion, while the world's largest solar company has a market cap of only a few billion dollars, dwarfed by oil giants (e.g., ExxonMobil's market cap exceeds $300 billion). Small market caps imply lower liquidity and poorer information transparency, making pricing errors more likely.
- High Cognitive Complexity: The climate sector involves multiple variables, including global policies (e.g., the Paris Agreement), technological iterations (e.g., improvements in solar efficiency, declining storage costs), and supply chain competition. This uncertainty leads to frequent fluctuations in market expectations. Traditional value managers avoid this area due to the difficulty of assessing "safety margins," creating a "pool of excess returns" for investors with deep research capabilities.
4. Risk Reassessment: The Asymmetry of Policy and Technology
The authors' risk analysis exhibits an "asymmetric" characteristic:
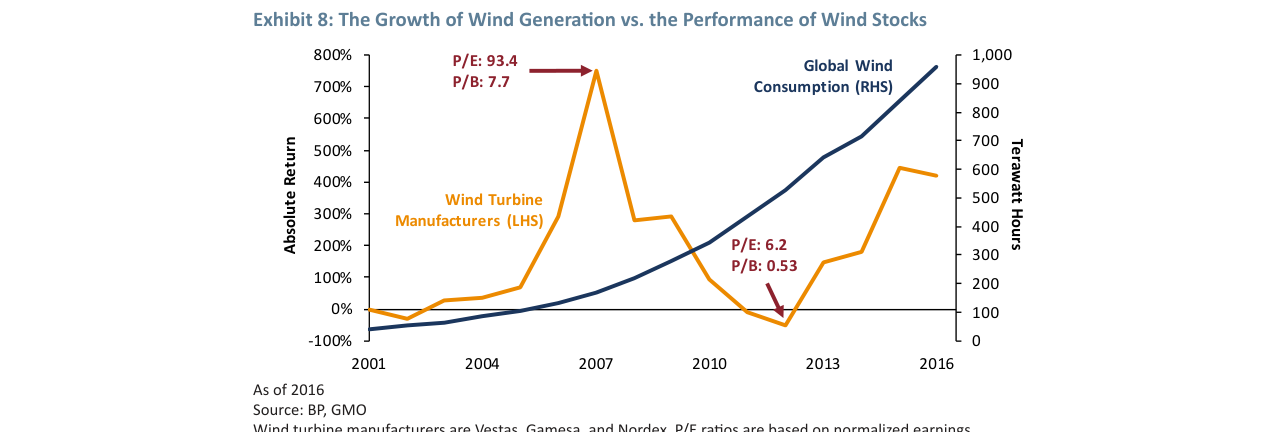
From 2001 to 2016, global wind power consumption grew nearly 900%. Wind turbine manufacturer stocks corrected sharply after the 2007 valuation peak (P/E 93.4) and rebounded after the 2012 valuation trough (P/E 6.2).
- Policy Risk: Events like the U.S. withdrawal from the Paris Agreement may temporarily impact clean energy investment, but in the long run, they may force technological innovation and cost reduction (e.g., China's solar industry achieved global dominance after subsidy cuts). The commitments of major countries like China and India remain positive.
- Technological Disruption Risk: Breakthrough technologies like cold fusion could fundamentally change the industry landscape, but the authors believe the probability is extremely low within the next 20 years. A more realistic threat is gradual technological iteration (e.g., perovskite solar cells, solid-state batteries), which can be effectively hedged through diversification across multiple sub-sectors (wind, storage, energy efficiency, etc.).
- Core Risk: The authors emphasize that the biggest risk for investors is not external shocks but behavioral biases—chasing hot themes (e.g., the 2015 solar bubble), paying excessive prices (e.g., wind power in 2007), or investing in industries with poor competitive dynamics (e.g., early-stage solar). These risks are particularly pronounced in the climate sector because "growth stories" easily trigger irrational optimism.
5. Conclusion: A Value-Oriented Long-Term Opportunity
The climate sector presents a coexistence of "growth certainty" and "profit uncertainty," and the inefficiency of market pricing offers a unique window for value investors. The keys to success are:
- Deep Fundamental Research: Distinguish between "revenue growth" and "earnings growth," and identify companies with sustainable competitive advantages (e.g., wind turbine manufacturers achieving profit conversion through technological barriers and economies of scale).
- Strict Valuation Discipline: Contrarian positioning during industry troughs (e.g., wind power in 2012), avoiding chasing highs during valuation bubbles (e.g., 2007).
- Cross-Cycle Perspective: The climate transition is a multi-decade structural trend; short-term fluctuations (e.g., policy swings, technology route debates) should not interfere with long-term judgment.
The authors ultimately emphasize that "heroic returns" in the climate sector are not automatic but belong to investors who can simultaneously navigate the "growth story" and maintain a "value anchor." This conclusion is highly consistent with GMO's long-standing deep value investment philosophy.
Summary
The follow-up content, through the authors' backgrounds and disclaimers, provides an anchor of authority and timeliness for the "climate opportunity" thesis. Grantham's identity as an early innovator and GMO's quantitative tradition differentiate his views from morally driven climate investing, aligning them more closely with a "risk pricing" logic. Readers should dynamically assess the applicability of the opportunity list in light of policy and market developments after 2017.