For Whom the Bond Tolls: Low Rate Beneficiaries in a Rising Rate Environment
GMO is a Boston asset manager co-founded in 1977 by Jeremy Grantham with Richard Mayo and Eyk Van Otterloo, known for valuation-driven dynamic asset allocation built on long-horizon mean reversion. Grantham is famous for calling historic bubbles, warning publicly ahead of both the 2000 dot-com crash and the 2008 financial crisis. Flagship publications include the GMO Quarterly Letter (now written by Asset Allocation co-heads Ben Inker and John Pease), Grantham's Viewpoints essays and the 7-Year Asset Class Forecast.
In plain words
This report explains that low interest rates over the past decade have inflated stocks that act like bonds—think utilities, REITs, and telecoms—which pay steady dividends. Now that rates are rising, these stocks could drop sharply. Also risky are companies that borrow heavily to buy back their own shares (called 'financial engineers'), since their debt costs haven't improved. For regular investors, don't be fooled by seemingly cheap prices on these stocks; instead, look at overlooked areas like financials and materials. In short: as rates change, yesterday's winners may become today's losers.
GMO Report: For Whom the Bond Tolls The report explores the risk of valuation downgrades for stocks that have long benefited from low interest rate policies in a rising rate environment. The core argument is that since the global financial crisis, ultra-low interest rates have given rise to a group
Theme and Background
This section discusses which stocks that have long benefited from ultra-low interest rate policies face valuation downgrade risks as interest rates rise from historical lows. GMO points out that since the Global Financial Crisis, aggressive central bank easing has spawned a group of "bond surrogate" stocks whose valuations have inflated to extreme levels, and interest rate normalization could trigger significant and justified valuation compression.
Core Thesis
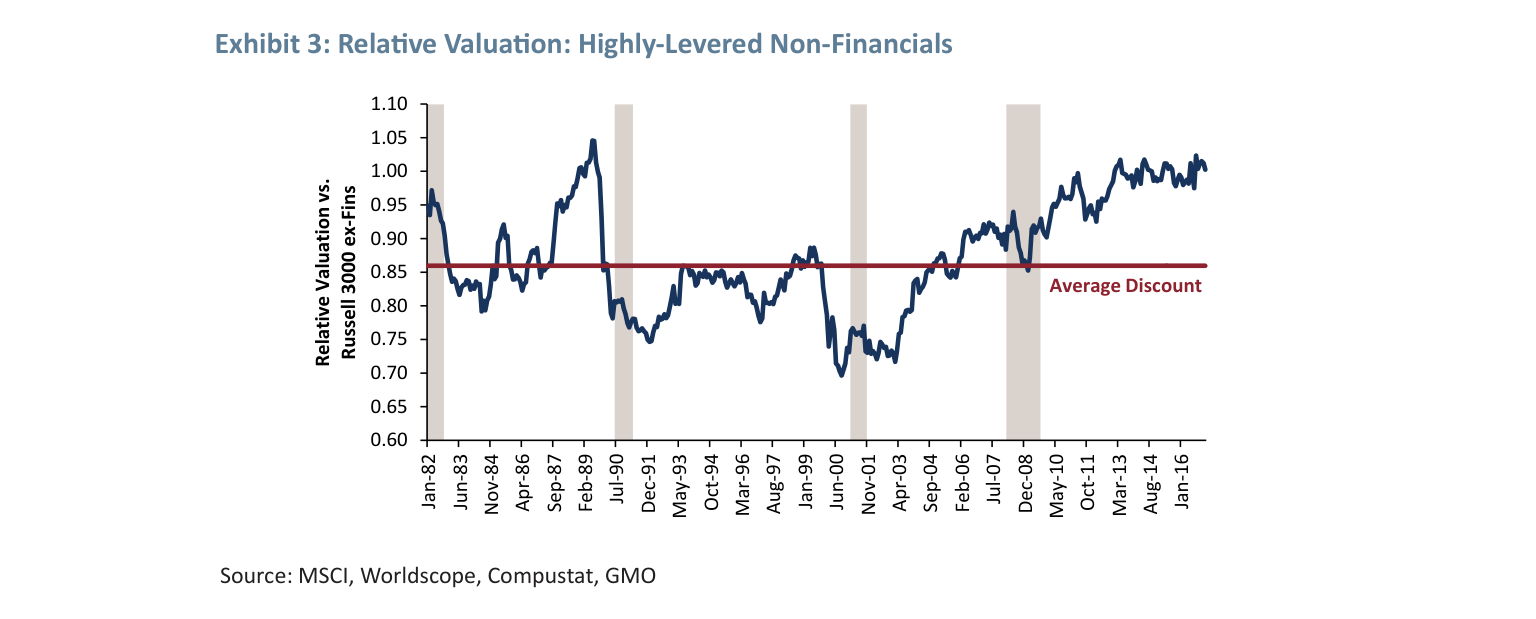
The author's central judgment is: Rising interest rates will cause valuation reversion for three types of "low-rate beneficiaries" — high-beta bond stocks, highly leveraged non-financial companies, and "financial engineers" that issue debt to buy back shares. These stocks may appear cheap on the surface, masking fundamental deterioration, posing a trap for value investors. The counterintuitive point is: Highly leveraged companies are currently valued near market parity (no discount), and the market seems to have forgotten the fragility of leveraged firms during economic downturns.
Key Arguments and Data
1. Bond Surrogates
- Definition: The top 25% of stocks with the highest sensitivity to 7-10 year U.S. Treasury yields (based on the past 1-year beta).
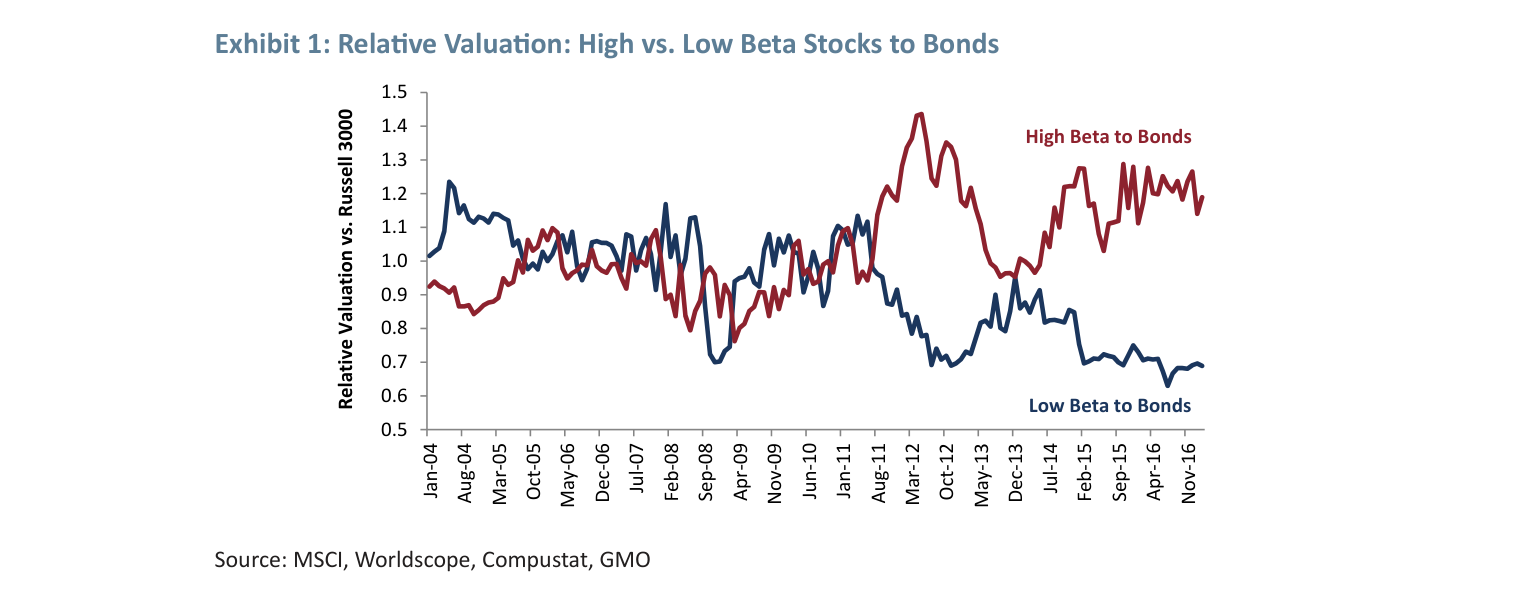
- Current Valuation: This group trades at a 20% premium to the market (Exhibit 1).
- Valuation Gap: The valuation gap between high-beta and low-beta bond stocks is near its widest level in 12 years.
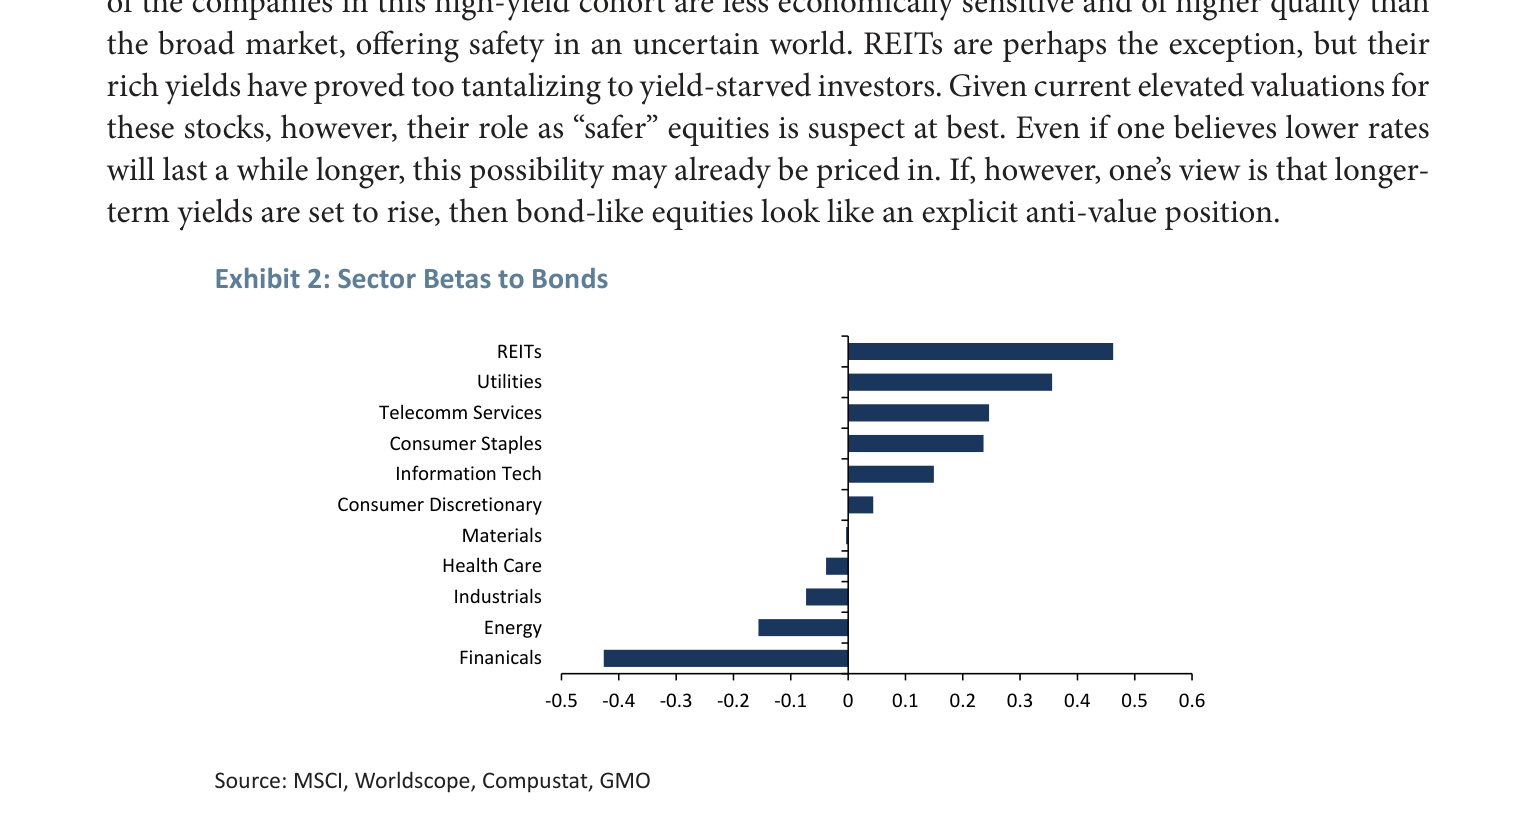
- Sector Composition: Primarily REITs, Utilities, Telecom Services, and Consumer Staples (Exhibit 2).
- Historical Driver: Valuation expansion was most pronounced during the post-GFC rate-cutting period and the 2011 European debt crisis.
2. Highly Leveraged Non-Financial Companies
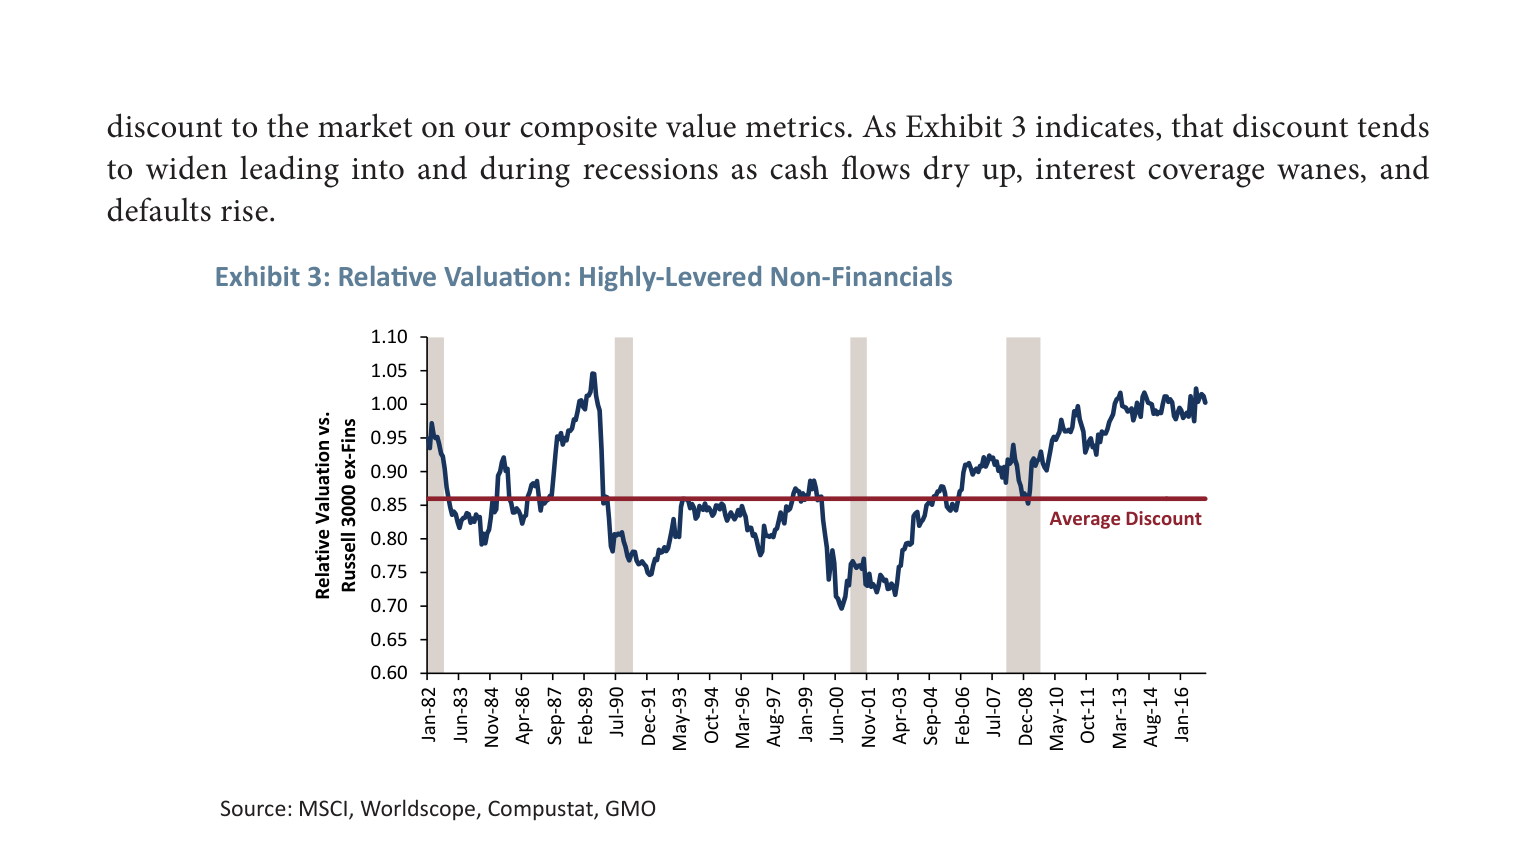
- Historical Discount: Highly leveraged companies typically trade at a 14% discount to the market (based on GMO's composite value metric).
- Current State: The discount has vanished, with valuations near market parity (Exhibit 3).
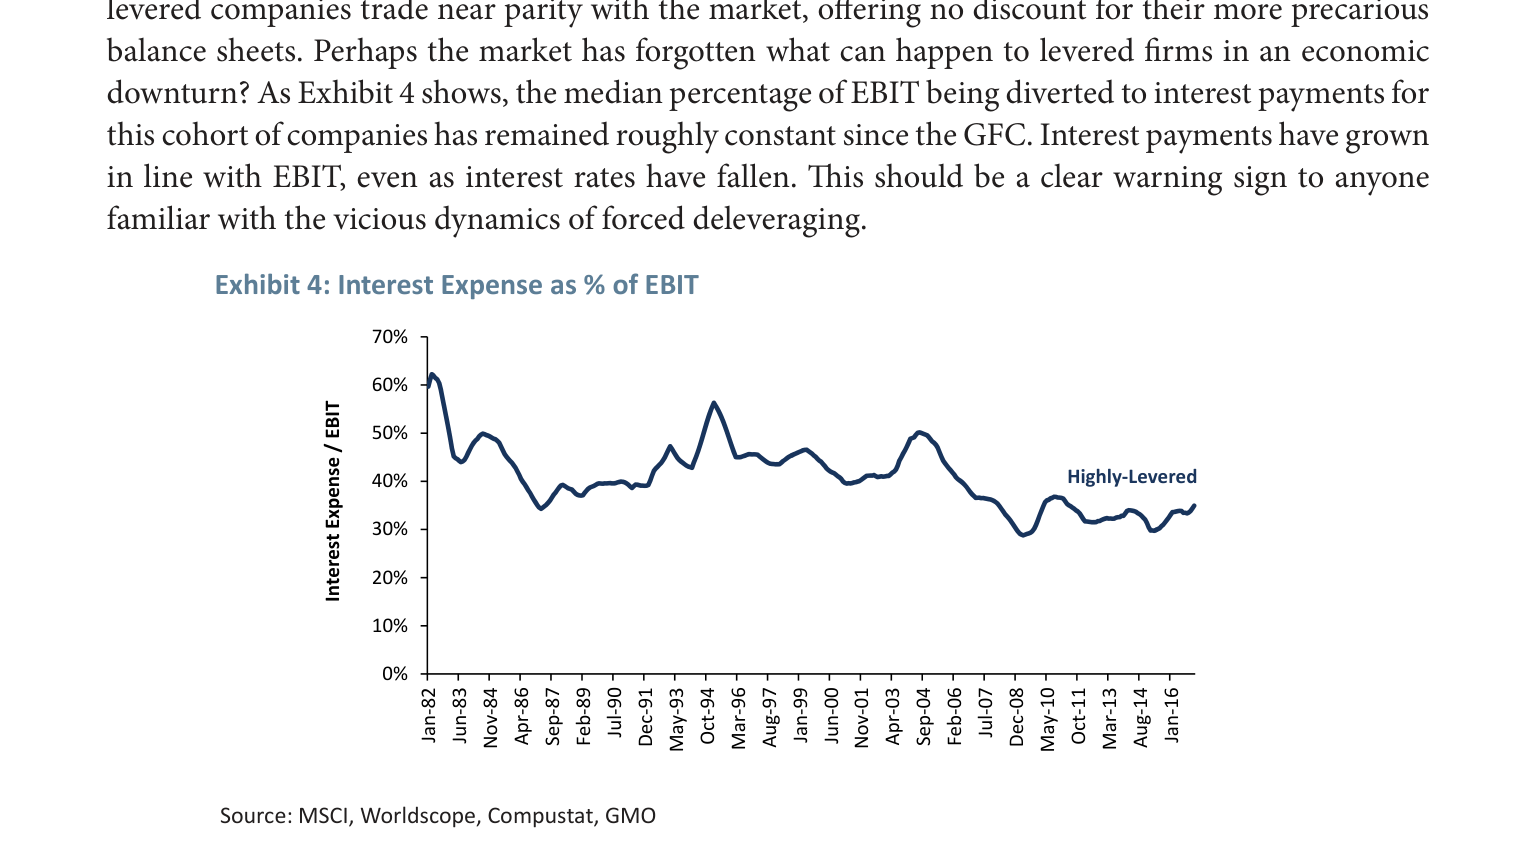
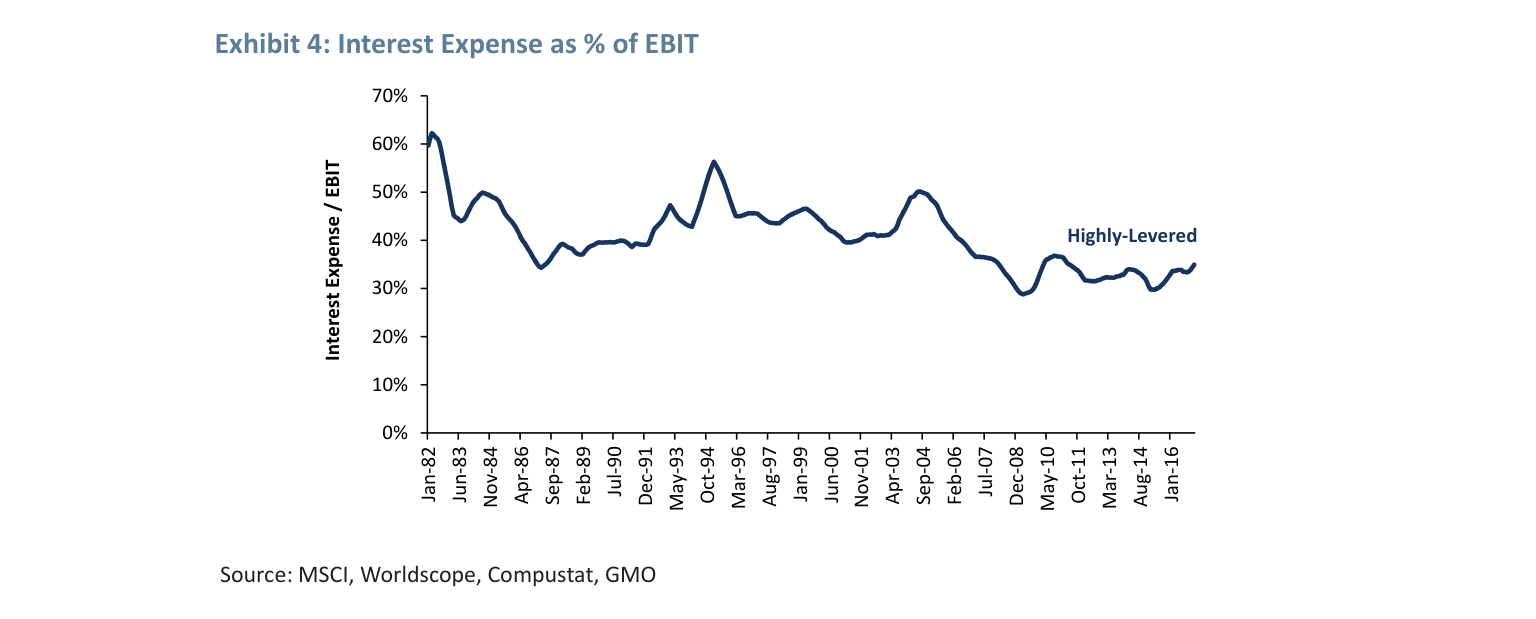
- Interest Burden: Since the GFC, the ratio of interest expense to EBIT has remained constant (Exhibit 4), indicating that even with lower rates, debt growth has kept pace with earnings growth, failing to improve debt-servicing capacity.
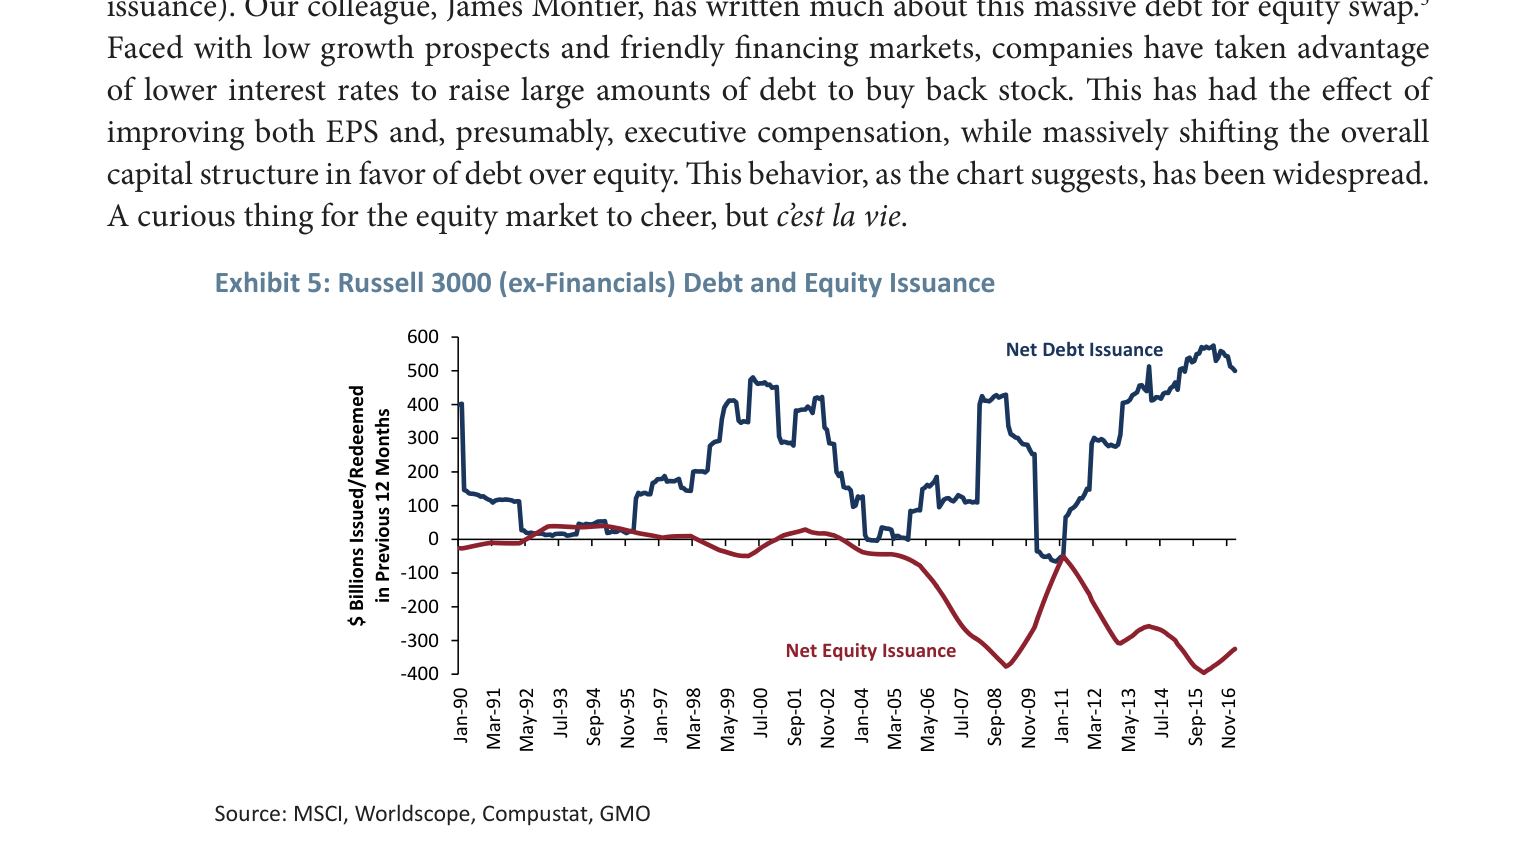
3. Financial Engineers (Debt-for-Equity Swaps)
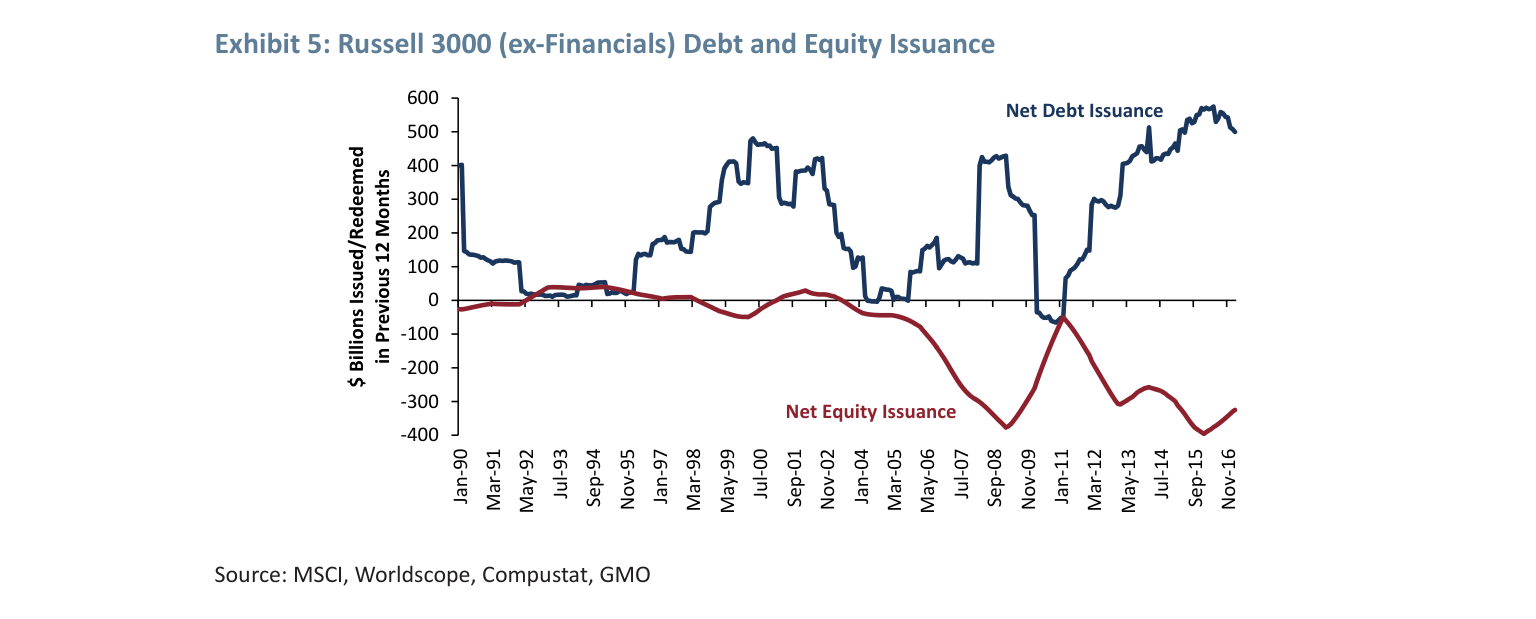
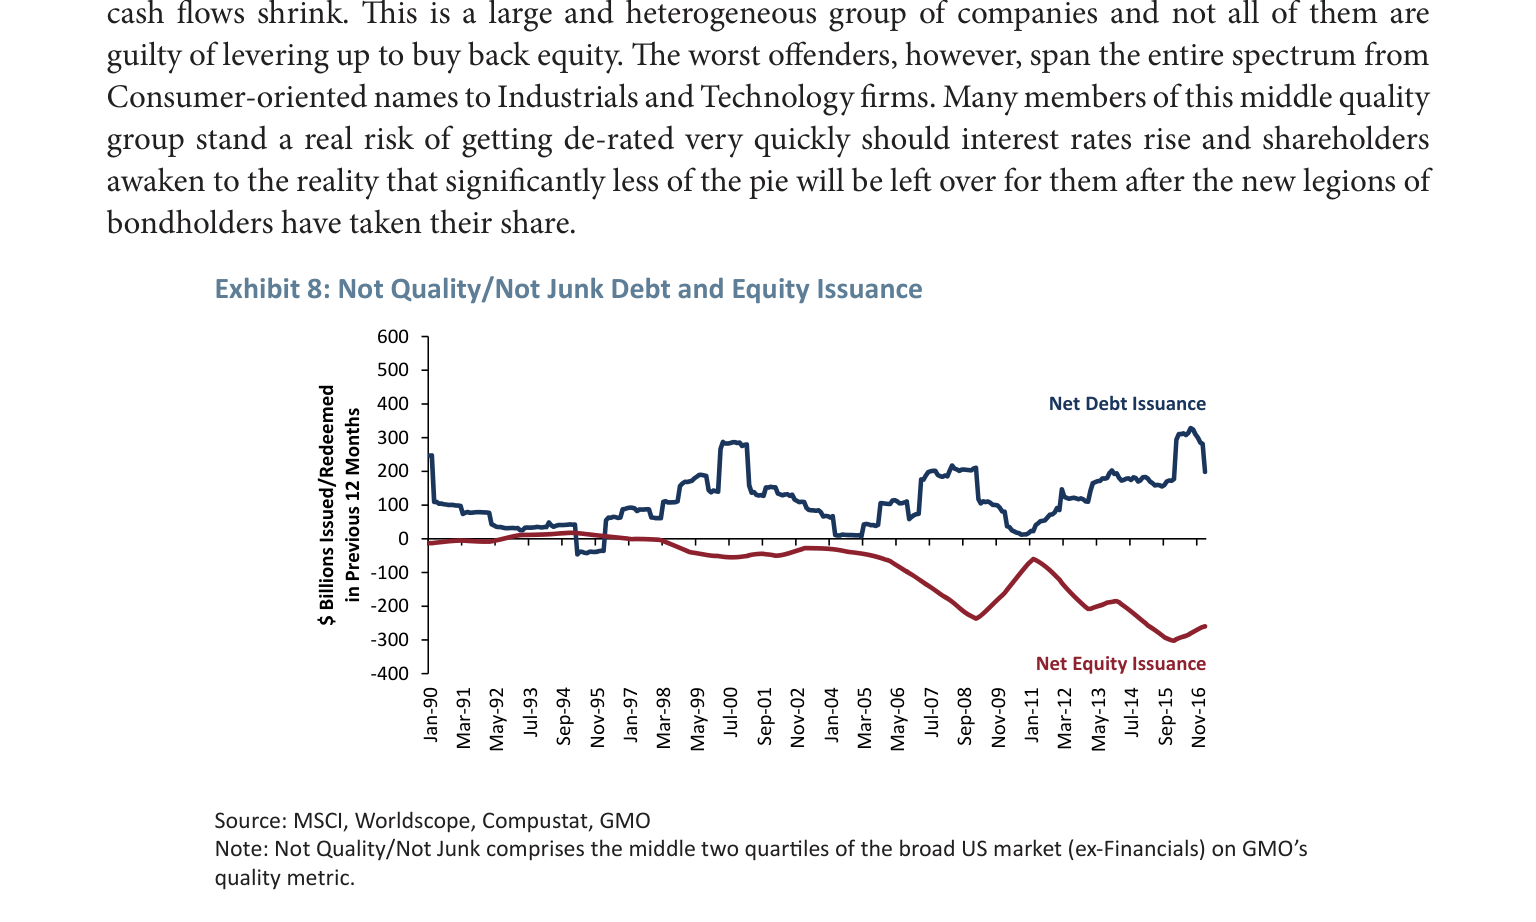
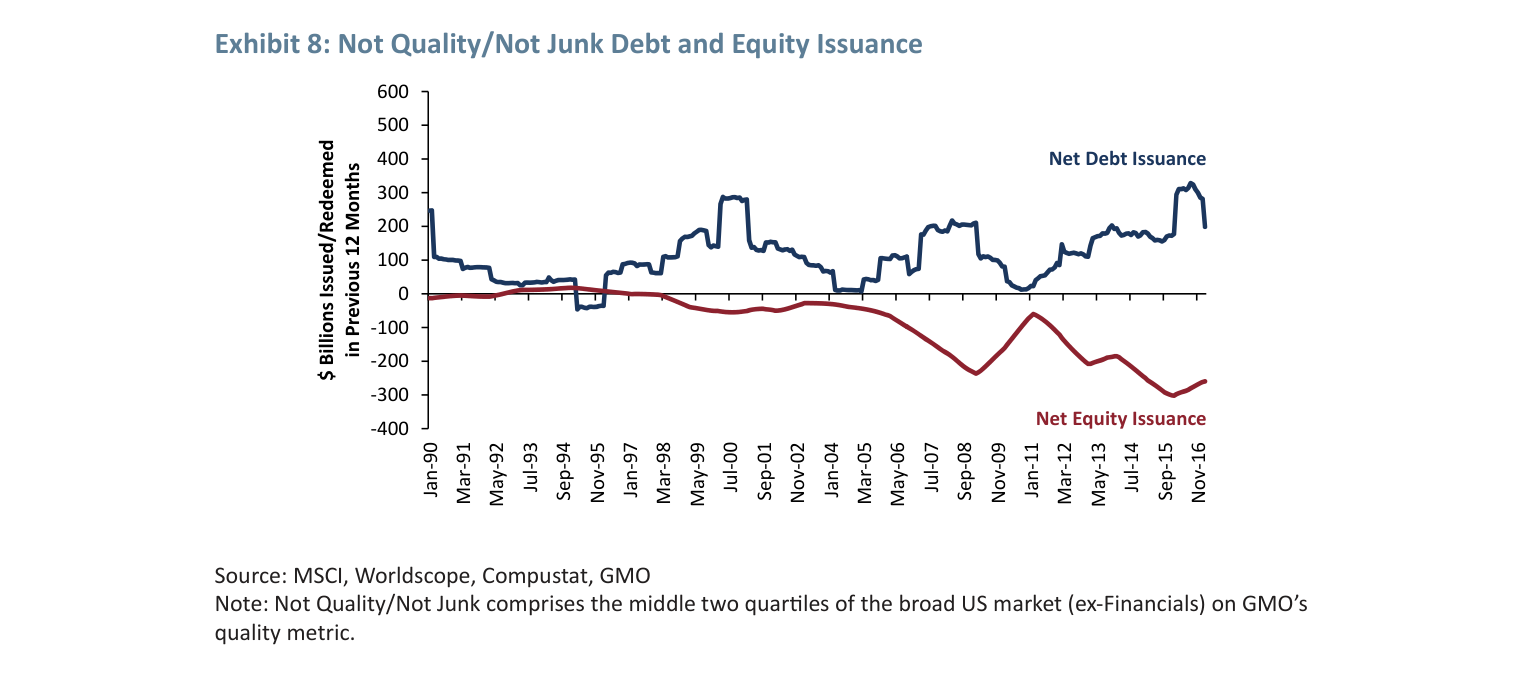
- Data: Net debt issuance by U.S. non-financial companies has been persistently positive, while net equity redemption has been negative (Exhibit 5), indicating heavy debt issuance for share buybacks.
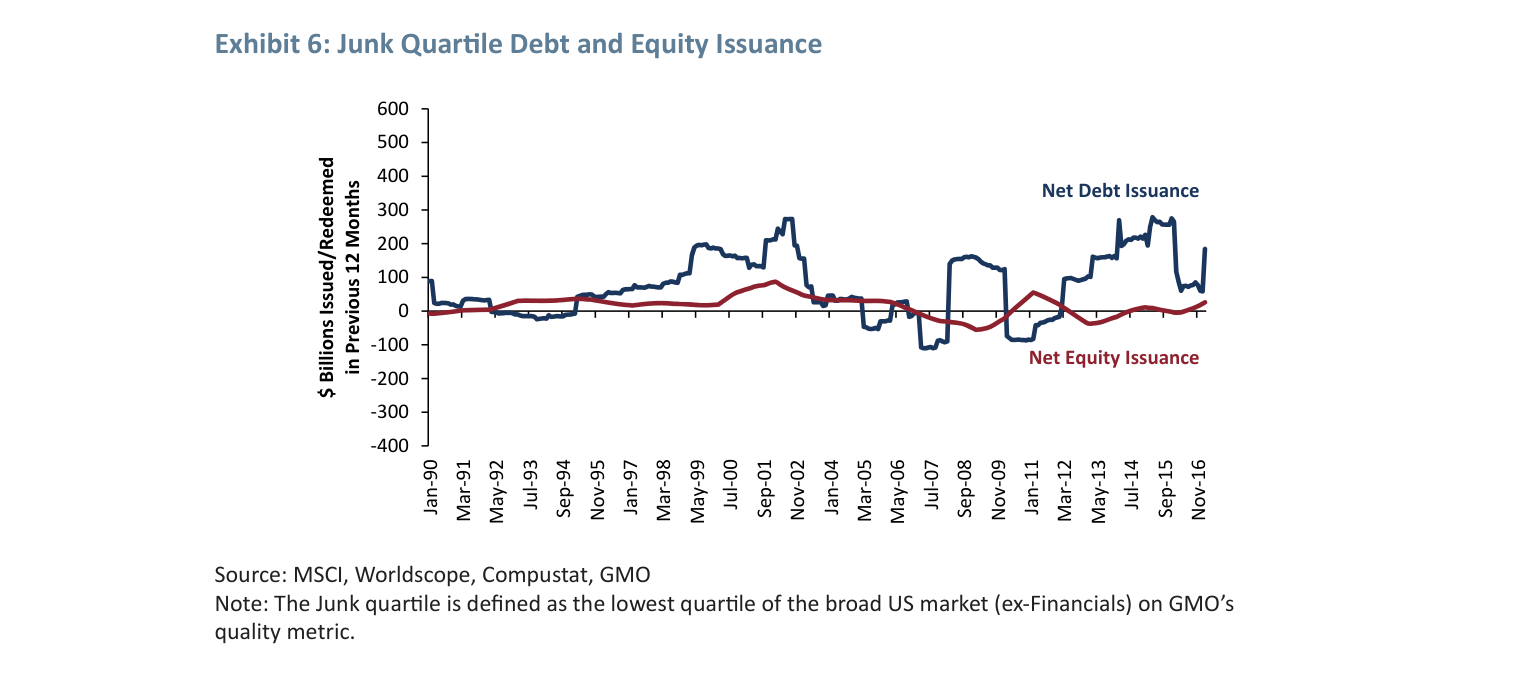
- Quality Divergence: Low-quality companies are not the primary buyers, but highly leveraged firms overall still face risks from rising interest rates.
Companies/Assets Involved
| Category | Specific Assets/Sectors | Role and Key Data | Bullish/Bearish |
|---|---|---|---|
| Bond Surrogates | REITs, Utilities, Telecom Services, Consumer Staples | High-beta bond stocks, 20% premium to market, valuation near 12-year widest | Bearish (rising rates will cause valuation compression) |
| Highly Leveraged Non-Financials | Non-financial high-debt companies | Historical 14% discount has vanished, interest burden not improved | Bearish (fragile during economic downturns) |
| Financial Engineers | Companies issuing debt to buy back shares | Net debt issuance persistently positive, net equity redemption negative | Bearish (deteriorating capital structure) |
| Relative Beneficiaries | U.S. Financials, Materials, High-Quality Value | Low-beta bond stocks, shunned by the market | Bullish (expected to outperform in a tightening environment) |
Investment Implications
- Avoid Bond Surrogates: High-beta bond stocks like REITs, Utilities, Telecom Services, and Consumer Staples face valuation compression risk in a rising rate cycle. Even if low rates persist, the current premium may already be fully priced in.
- Beware of Highly Leveraged Companies: Apparent cheap valuations (no discount) are a trap. The interest burden has not improved with lower rates, and default risk rises during economic downturns.
- Focus on Overlooked Sectors: Low-beta bond stocks such as U.S. Financials, Materials, and high-quality value stocks are relatively expected to outperform in a monetary tightening environment.
Additional Arguments and Data: Capital Structure Distortion and Growth Stock Risk in a Low-Rate Environment
1. Leveraging Behavior of Middle-Quality Companies: The "Frenzy" of Debt-Equity Swaps
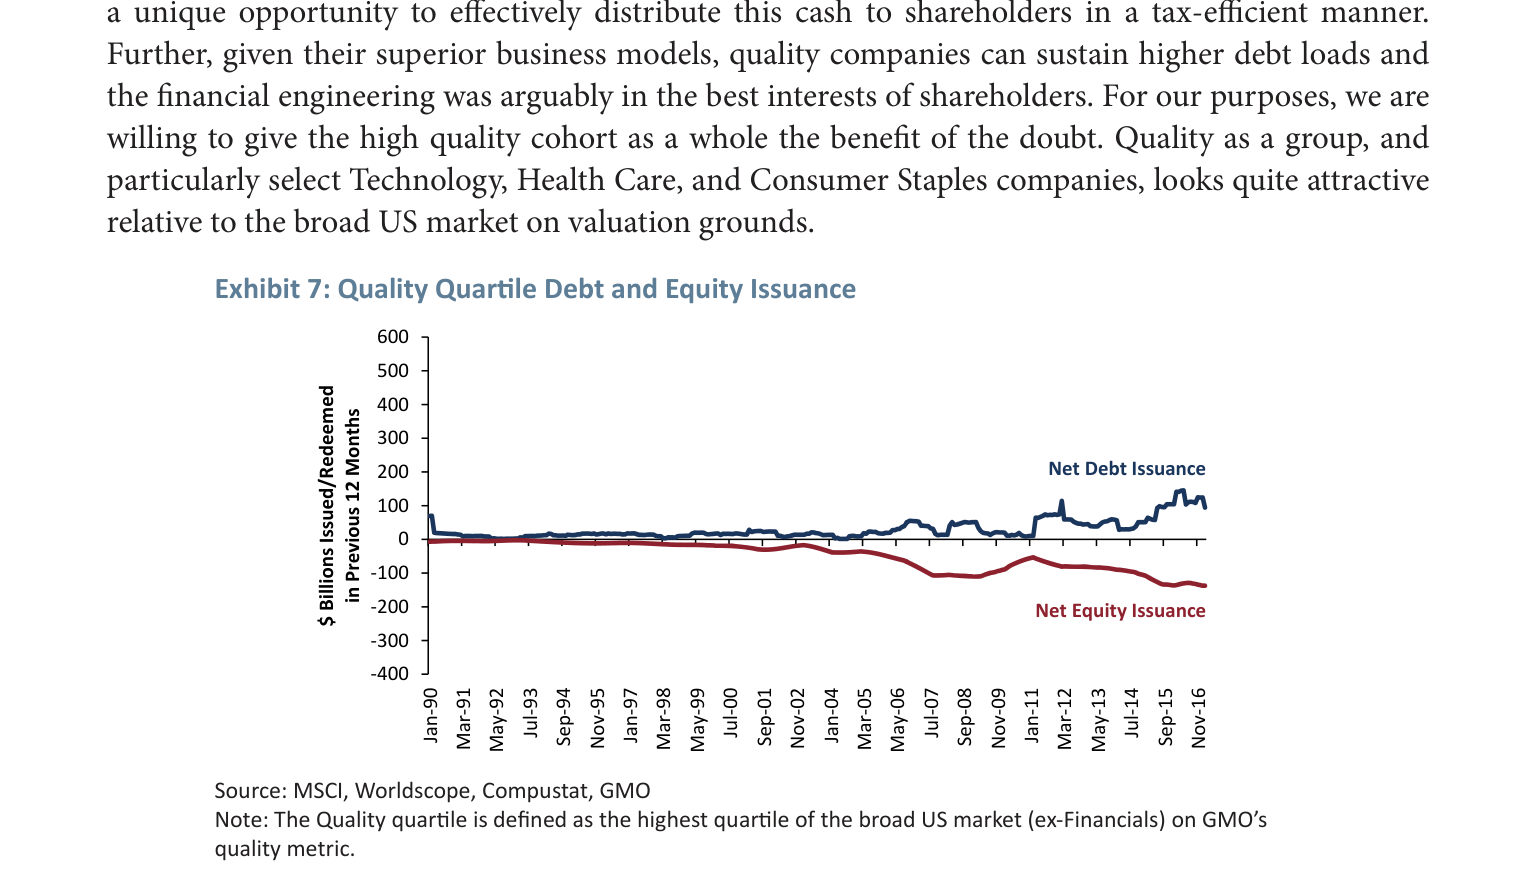
The GMO report divides the market into three quality tiers: High Quality, Low Quality (Junk), and Middle Quality (Not Quality/Not Junk). Middle-quality companies are the primary drivers of debt-equity swaps. Data shows that since the GFC, these companies have spent nearly as much on share buybacks as their total debt issuance (Exhibit 8). This aggressive capital structure adjustment aims to boost earnings per share (EPS) through financial engineering in a low-growth, low-rate environment.
Key Data Comparison:
| Quality Tier | Net Debt Issuance Trend | Net Equity Issuance Trend | Leverage Sustainability |
|---|---|---|---|
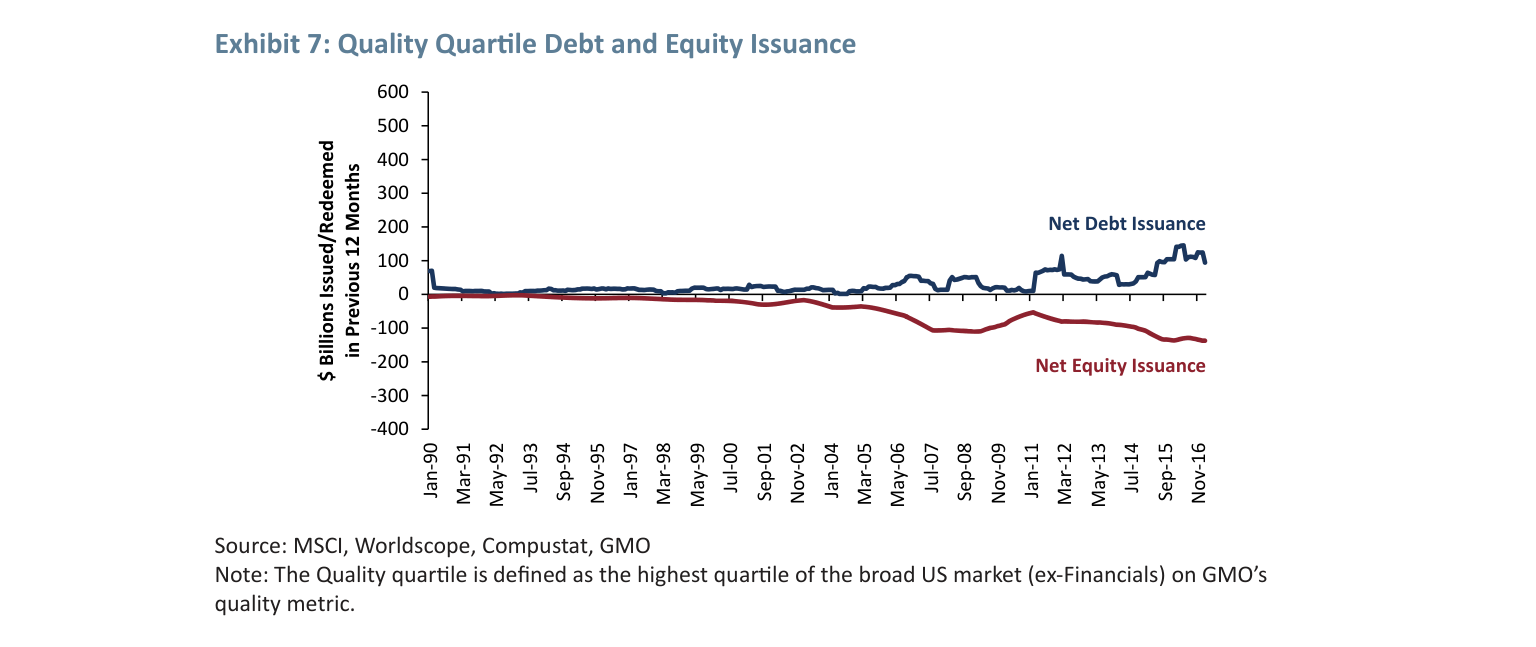
| High Quality | Moderate increase, partly for tax-efficient cash distribution | Persistent net redemption (negative) | High, due to superior business models |
| Low Quality (Junk) | Volatile, cyclical | Persistent net redemption (negative) | Low, affected by economic cycles |
| Middle Quality (Not Quality/Not Junk) | Significant increase, close to buyback amounts | Persistent net redemption (negative) | Medium, but risk surges with rising rates |
Risk Warning: Unlike high-quality companies, middle-quality firms lack sustainable business models to simultaneously support dividends, buybacks, and interest payments on new debt. Once interest rates rise or cash flows contract, these companies face rapid de-rating risk. The report specifically notes that the worst offenders span multiple sectors, including Consumer, Industrials, and Technology.
2. Interest Rate Sensitivity of Growth Stocks: Rising Excess Beta
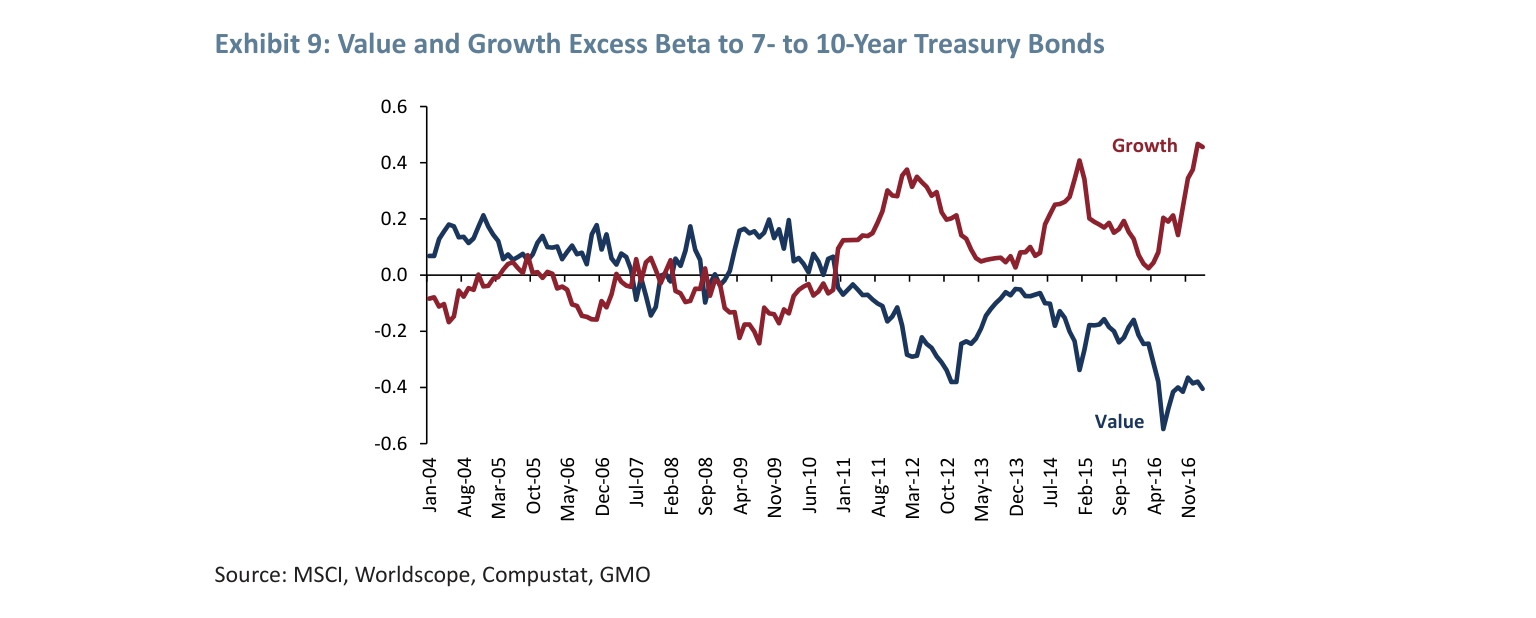
Growth stocks are another major beneficiary of low-rate policies. With a high proportion of future cash flows, low discount rates significantly boost their present value. Since the start of low-rate policies in 2008/2009, the "Excess Beta" of growth stocks to bonds has risen markedly, while that of value stocks has turned from positive to negative (Exhibit 9).
Excess Beta Explanation: This metric measures stock sensitivity to changes in 7-10 year Treasury yields, excluding overall market effects. For example, if bond prices fall by 1% (i.e., rates rise), value stocks are expected to outperform the market by 0.4%, while growth stocks underperform by about 0.5%.
Historical Trend (2004-2016):
| Time Period | Growth Stock Excess Beta | Value Stock Excess Beta | Key Event |
|---|---|---|---|
| 2004-2008 | 0.1~0.2 | 0.0~-0.1 | Fed rate hike cycle |
| 2009-2013 | 0.2~0.3 | -0.1~-0.2 | QE1-QE3 |
| 2014-2016 | 0.4~0.5 | -0.3~-0.4 | Global central bank synchronized easing |
Risk Quantification: If rates rise by 1 percentage point, growth stocks could fall by approximately 5% relative to the market (based on a 0.5x excess beta). The report emphasizes that while the low beta of financial stocks partially explains the value-growth divergence, growth stocks themselves still face significant de-rating risk.
3. Policy Uncertainty: Potential Impact of Trump and Brexit
The report concludes by noting that Brexit and Trump's election have increased economic uncertainty. Taking the U.S. Border Adjustment Tax as an example, the policy would have vastly different impacts across sectors:
| Sector | Potential Impact | Reason |
|---|---|---|
| Retail | Severely Damaged | High import costs |
| Export-Oriented Manufacturing | Potentially Beneficial | Improved export competitiveness |
| Technology (Import-Dependent) | Damaged | Rising supply chain costs |
Furthermore, renegotiation of trade agreements could trigger trade wars, further amplifying corporate earnings volatility. The report advises investors to focus on the following strategies:
- Identify reasonably valued quality names
- Screen out companies with questionable balance sheet management
- Closely monitor corporate bond market dynamics
4. Comprehensive Risk Matrix: Vulnerability of Low-Rate Beneficiaries
The report categorizes companies benefiting from low rates into four groups and assesses their risk from rising rates:
| Category | Typical Sectors | Valuation Level | Rate Sensitivity | Primary Risk |
|---|---|---|---|---|
| Bond Surrogates | Utilities, REITs | High | Very High | Dividend appeal diminishes |
| Highly Leveraged Companies | Energy, Industrials | Medium | High | Rising debt-servicing costs |
| Financial Engineers (Middle Quality) | Consumer, Technology | Medium | High | Unsustainable earnings growth |
| Growth Stocks | Technology, Healthcare | Very High | Very High | Valuation compression from higher discount rates |
Conclusion: Even if the Fed raises rates slowly and modestly, small changes in discount rates can significantly impact these "low-rate beneficiaries." Investors must be wary of valuation correction risks during the interest rate normalization process.
Additional Analysis: Empirical Logic of Uncertainty Premium and Investment Style Rotation
1. Differential Impact of High Discount Rates on Value and Growth Styles
The traditional value investor's warning that "paying too high a price is the greatest sin" gains practical relevance when predicting future asset values becomes more difficult. The author argues that applying high discount rates to future cash flows is a rational response to heightened economic and political uncertainty. This operation, in terms of relative returns, will "favor" value investors while "harming" growth styles. The core mechanism is:
- Value Stock Characteristics: High proportion of current cash flows, low valuation multiples; high discount rates have a relatively limited impact on present value (due to shorter cash flow time horizons).
- Growth Stock Characteristics: High proportion of future cash flows, valuations dependent on distant expectations; high discount rates significantly compress present value (e.g., in a DCF model, the present value of cash flows 10 years out decays exponentially as discount rates rise).
Quantitative Comparison: Assume the following future cash flow distributions for value and growth stocks (in USD):
| Metric | Value Stock (60% current cash flow) | Growth Stock (20% current cash flow) |
|---|---|---|
| Year 1 Cash Flow | 60 | 20 |
| Year 5 Cash Flow | 30 | 40 |
| Year 10 Cash Flow | 10 | 40 |
| PV at 5% Discount Rate | 92.3 | 72.6 |
| PV at 10% Discount Rate | 82.6 | 54.3 |
| Change in PV | -10.5% | -25.2% |
The data shows that when the discount rate rises from 5% to 10%, the present value of growth stocks falls 2.4 times more than that of value stocks, validating the "penalty effect" of high discount rates on growth styles.
2. Immediate Market Reactions: Empirical Evidence from Brexit and the 2016 U.S. Election
The author cites two key events—the Brexit referendum (June 2016) and Trump's election (November 2016)—as empirical support. Following these "black swan" events, global stock markets (especially the U.S. and Europe) saw significant outperformance of value stocks over growth stocks:
- 30 Trading Days After Brexit: The MSCI World Value Index outperformed the Growth Index by approximately +4.2% (Source: MSCI, June 24 to August 5, 2016).
- 30 Trading Days After the 2016 Election: The Russell 1000 Value Index outperformed the Growth Index by approximately +5.8% (Source: FTSE Russell, November 9 to December 20, 2016).
Mechanism Explanation: Both events intensified economic policy uncertainty (the EPU index surged 30% after Brexit and 25% after the election). To hedge against distant risks, investors systematically raised discount rates, putting pressure on growth stock valuations, while value stocks gained a relative advantage due to their "near-term" cash flows.
4. Implications for the Current Market (2025 Perspective)
Although the original report was published in 2017, its logic remains relevant in 2025:
- Current Environment: Persistent global inflation, geopolitical conflicts (e.g., Russia-Ukraine, Middle East), and the AI technology bubble coexist, making the difficulty of forecasting distant cash flows comparable to 2016.
- Discount Rate Sensitivity: If the Fed maintains high rates (e.g., federal funds rate above 5%), growth stocks (especially unprofitable tech stocks) will face renewed valuation pressure, while value stocks (Energy, Financials, Utilities) may benefit from a "cash is king" logic.
- Historical Comparison: In 2022, value stocks outperformed growth stocks by approximately 20% (Russell 1000 Value vs. Growth), a pattern similar to post-Brexit 2016 but with a larger magnitude, reflecting a higher current uncertainty premium.
Key Difference: The 2016 value outperformance was a short-term "event-driven" reaction, while the 2022 trend was a medium-term "rate-cycle-driven" shift. Investors must distinguish between the different impacts of "uncertainty shocks" and "structural rate changes" on discount rates.