My Sister's Pension Assets and Agency Problems
GMO is a Boston asset manager co-founded in 1977 by Jeremy Grantham with Richard Mayo and Eyk Van Otterloo, known for valuation-driven dynamic asset allocation built on long-horizon mean reversion. Grantham is famous for calling historic bubbles, warning publicly ahead of both the 2000 dot-com crash and the 2008 financial crisis. Flagship publications include the GMO Quarterly Letter (now written by Asset Allocation co-heads Ben Inker and John Pease), Grantham's Viewpoints essays and the 7-Year Asset Class Forecast.
In plain words
This article explains how professional money managers, afraid of losing their jobs, often follow the crowd, making markets much more volatile than the economy. For regular investors, this means you have an edge if you manage your own money (like a family pension) without short-term pressure. You can make contrarian moves, like cutting stocks before a crash. Data shows that strategies without career constraints deliver higher long-term returns with lower risk. It's worth reading because it reveals why 'herding' hurts investors and how individuals can exploit this flaw.
GMO's April 2012 quarterly letter, authored by Jeremy Grantham, focuses on career-risk-driven investment behavior and the resulting agency problems. The core argument is that professional investors, in order to keep their jobs, engage in herding, causing market volatility to far exceed fundamental v
Theme and Background
This chapter explores the core conflict in the professional investment industry: the clash between career risk-driven herding behavior and clients' long-term interests. Grantham argues that career risk is the "first truth" of investment behavior, causing market price fluctuations far exceeding fundamental volatility and leading to severe agency problems.
Core Views
- Career Risk Dominates Investment Behavior: Professional investors are forced to "follow the crowd" to keep their jobs, resulting in significant momentum effects and price deviations in the market.
- Market Price Volatility is 19 Times Greater than Fair Value Volatility: Annual changes in GDP growth and fair value fluctuate by only ±1% in two-thirds of the time, while actual market price volatility reaches ±19%.
- Long-Term Value is Systematically Ignored: Two-thirds of a company's value lies beyond 20 years, yet the market often prices based on 5 years or even 5 months.
- Contrarian Investing Can Survive, But Requires Three Conditions: A sufficient margin of safety, full diversification, and never using leverage.
Key Arguments and Data
1. Comparison of Market Volatility and Fundamental Volatility (Based on Shiller model, 1882-2005 data):
| Indicator | Fluctuation Range in Two-Thirds of the Time |
|---|---|
| Actual Market Price (S&P Real Price) | ±19% |
| Fair Value (Based on Perfect Foresight) | ±1% |
| GDP Growth | ±1% |
2. Time Distribution of Corporate Value: Citing GMO's Ben Inker research, two-thirds of corporate value exists beyond 20 years, but market pricing often only looks at 5 years or even 5 months.
3. Client Patience Time:
- Normal conditions: 3.0 years
- Extreme cases (e.g., poor start for new clients): can shorten to 2.5 years
- Best case (good relationship + excellent relative performance): can extend to 4-5 years
- Grantham believes "good client management" is about securing an extra year of patience for the firm.
4. 1998-1999 Survey Data: Among approximately 1,100 full-time equity professionals surveyed, over 99% acknowledged that if the S&P P/E ratio fell from 28-35 times back to 17 times, it would lead to a major bear market, but only 7 people (less than 1%) believed the P/E ratio would actually revert.
5. Differences in Career Risk Across Investment Levels:
- Choosing insurance stocks: Low career risk (issues exposed only after 4-5 years)
- Choosing oil stocks vs. insurance stocks: Higher risk (more conspicuous)
- Holding cash/conservative strategies in a bull market: Highest risk (publicly traded companies cannot afford the cost of being "wrong" for 2-3 years)
Companies/Assets Involved
- GMO: The author's institution, which shorted the tech bubble and Japan bubble 2-3 years early in 1998-2000, ultimately winning but under immense pressure.
- Ben Inker (GMO): Provided research on the time distribution of corporate value.
- Robert Shiller: Pioneered the "perfect foresight fair value" model, proving market volatility far exceeds fundamentals.
- John Maynard Keynes: Quoted from Chapter 12 of The General Theory, noting that long-term investors face criticism and "if they fail in the short term, they receive little sympathy."
- Warren Buffett: Quoted his famous saying, "Investing is simple, but not easy."
- Roy Neuberger: The only investor who survived the 1931 market.
Investment Insights
1. Contrarian Investing is Feasible but with Strict Discipline: Only place large bets during extreme outliers, and must maintain diversification and zero leverage. Grantham admits GMO has been insufficient in patience and diversification in the past and is now more cautious.
2. Greatest Opportunities at the Asset Allocation Level: Since career risk is most "damaging" in asset class selection, the biggest investment opportunities also appear at the asset allocation level (rather than individual stocks or sectors).
3. Client Management is Crucial: Good client relationships can secure an extra year of patience, which is "absolutely huge and usually sufficient" in asset allocation.
4. Individual Investors Have an Advantage: Professional investors are constrained by career risk, but individual investors (or those managing their sister's pension) can more freely execute long-term contrarian strategies.
New Arguments and Data Analysis
1. Quantitative Comparison of Investment Constraints and Performance Differences
Grantham compares the performance of his sister's pension with institutional client accounts, revealing the significant advantage of unconstrained investing. Key data are as follows:
| Indicator | Sister's Pension (Unconstrained) | Institutional Client Accounts (Constrained) |
|---|---|---|
| 2008 Equity Position (End of 2007) | 20% | 50%–75% (Flagship strategy lower limit) |
| July 2008 Equity Position | 0% | 45% (Adjusted lower limit) |
| 2008 Net Return (Relative to Benchmark) | Not disclosed (Absolute return positive) | +6.9% (But absolute return -20.8%) |
| Long-Term Risk-Adjusted Return | Slightly better than institutional clients | Performance under benchmark constraints |
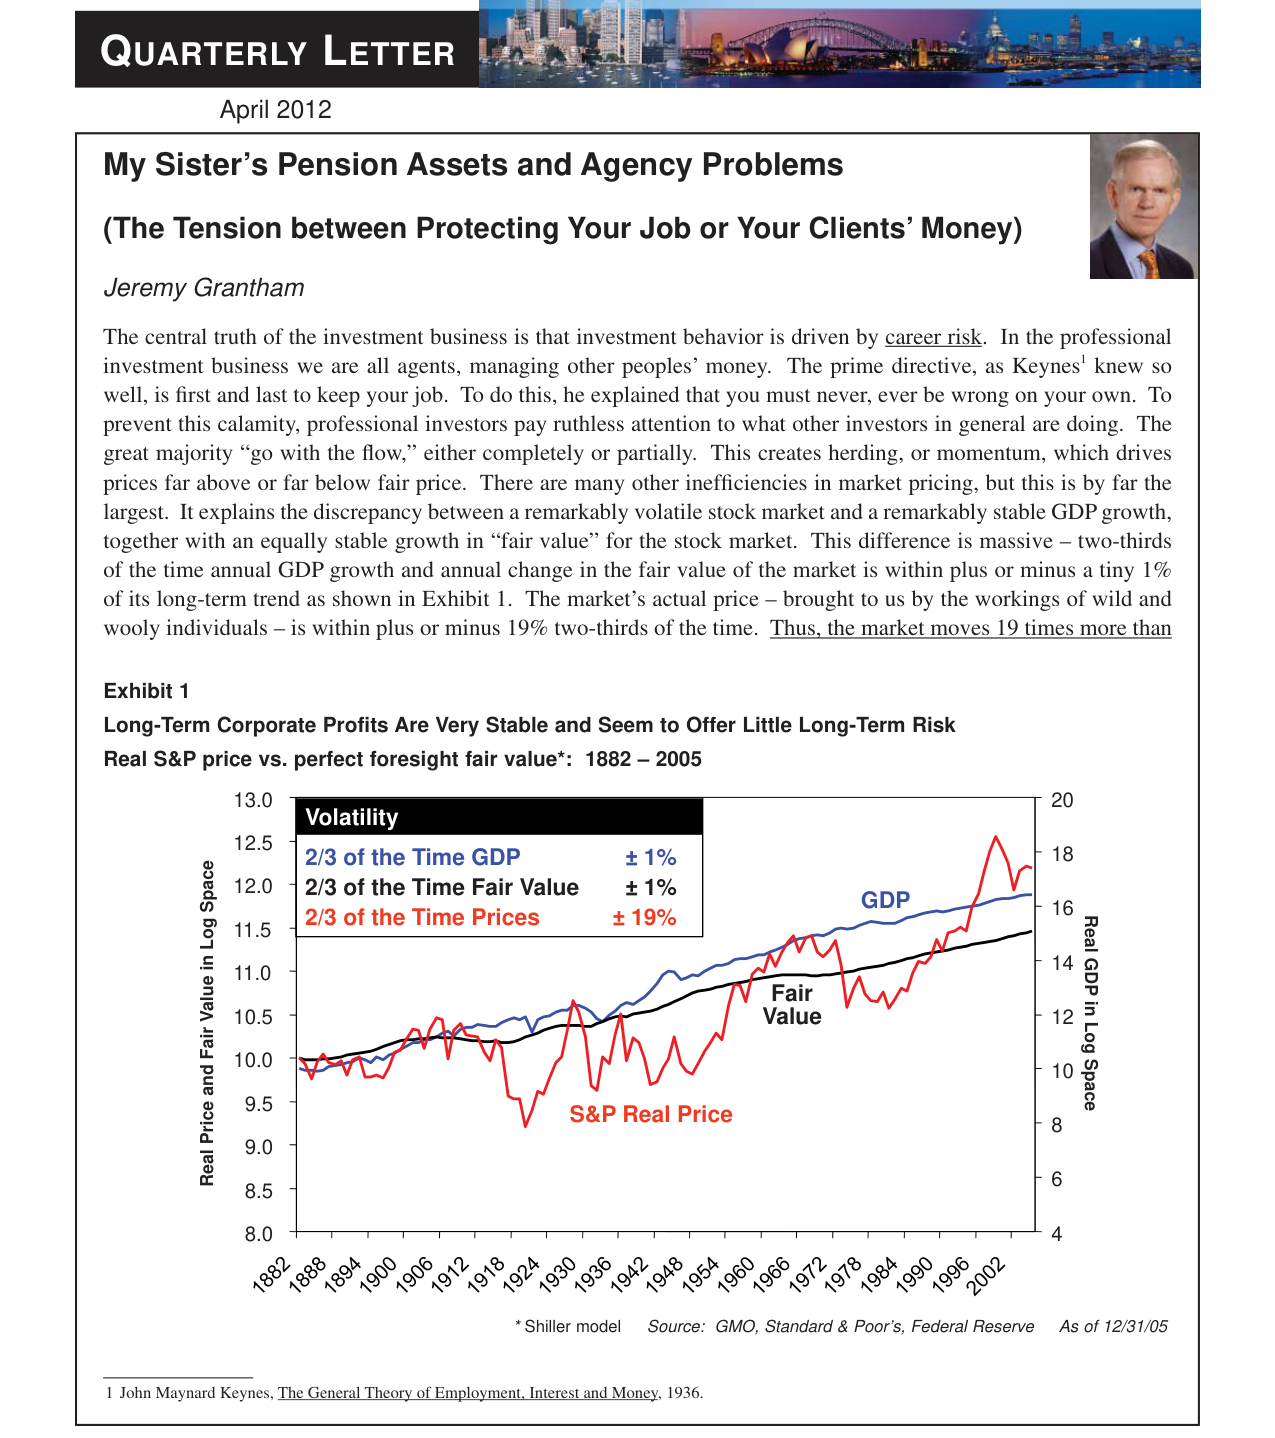
Between 1882 and 2005, the fluctuation range of the S&P real price (±19%) was far higher than fair value (±1%) and GDP (±1%), showing the huge deviation between short-term market behavior and long-term fundamentals
Core Findings:
- The sister's pension had already reduced equity to 20% by the end of 2007, while the institutional strategy had a lower limit of 50% due to "maintaining a sense of normalcy," resulting in an absolute loss of 20.8% in 2008.
- The sister's account completely liquidated equities in July 2008, while the institutional strategy only reduced to 45%, further amplifying losses.
- Grantham admits: "The absolute return target (rather than relative to a benchmark) of the sister's account made it more flexible in extreme markets."
2. Quantifying the Cost of the "Sense of Normalcy" Constraint
Grantham points out that the "50%–75% equity range" of institutional client strategies led to a 40% client loss during the 1998–1999 bubble. The cost of this constraint can be seen in the following data:
| Period | Market Valuation (P/E) | Strategy Equity Range | Client Churn Rate | Subsequent Fund Inflows |
|---|---|---|---|---|
| 1999 | 33x (Historical peak 20x) | 50%–75% | 40% | New funds poured in during 2003–2006 |
| 2007 | Global bubble | 45%–75% (Adjusted) | Lower | Not specified |
Key Insights:
- When the P/E broke through 33x in 1999, the strategy failed to reduce positions sufficiently due to "maintaining normalcy," leading clients to question its ability.
- After lowering the lower limit to 45% in 2007, the strategy achieved a relative return of +6.9% in 2008, but the absolute return was still -20.8%, indicating that the "sense of normalcy" constraint still limited extreme risk-avoidance capability.
3. Empirical Performance of Benchmark-Free Strategies
Grantham cites GMO's "Benchmark-Free Allocation Strategy" (launched in 1999) as a comparative case:
| Strategy Type | 1999 Expected Real Return | Actual Performance (vs Flagship Strategy) | Key Characteristics |
|---|---|---|---|
| Flagship Global Asset Allocation | 2.2% (Implied by S&P 500) | Benchmark | 50%–75% equity range |
| Benchmark-Free Allocation | 5%–6% | Significantly outperformed flagship strategy | No official benchmark, free allocation |
Data Support:
- The benchmark-free strategy predicted a real return of 5%–6% in 1999, while the S&P 500 only implied 2.2%, but it did not attract clients until 2001.
- The strategy was closed in 2004 due to capacity issues, but its 80% long portion (GMO Benchmark-Free Allocation Strategy) continued to outperform the flagship strategy (see Exhibit 3, original text does not provide specific numbers but clearly states "handsomely beating").
4. The Cost of "Acting Too Early" from a Behavioral Finance Perspective
Grantham emphasizes that the sister's account, with "zero career risk," could act 2.5 years early (e.g., reducing positions in 1998–1999), while institutional client strategies had to balance the costs of "too early" vs. "too late":
| Timing of Action | Sister's Account (Unconstrained) | Institutional Client Strategy (Constrained) |
|---|---|---|
| 1998–1999 Position Reduction | Fully executed (100% equity → underweight) | Only reduced to 50% lower limit (40% client loss) |
| 2007 Position Reduction | 20% → 0% equity | 45% lower limit (Relative return +6.9%, absolute loss -20.8%) |
| Subsequent Rebound | Rapid recovery (Emerging market case) | Client loss followed by reallocation (poor timing) |
Key Conclusions:
- The sister's account, with "zero constraints," completely avoided losses during the 1998–1999 bubble, while the institutional strategy lost 40% of clients due to the "sense of normalcy" constraint.
- During the 2007 bubble, the sister's account liquidated equities, while the institutional strategy still held 45% positions, resulting in absolute losses that, while smaller than the market, were still significant.
5. Historical Comparison: The Survival Paradox of Rational Investing
Grantham cites Keynes's view that "the market can remain irrational longer than you can remain solvent," but offers a counterargument through the GMO case:
| Event | Degree of Market Irrationality | GMO Strategy Outcome | Client Behavior |
|---|---|---|---|
| 1999 Bubble (3-sigma event) | P/E 33x (1/1000 historical probability) | 60% client retention | 40% loss, but subsequent new fund inflows |
| 2007 Global Bubble | Global overvaluation | Relative return +6.9% | Higher client retention |
Data Comparison:
- During the 1999 bubble, although GMO lost 40% of clients, retained clients achieved excess returns in 2003–2006, attracting new funds.
- During the 2007 bubble, the strategy reduced client loss by adjusting the lower limit to 45%, but absolute returns were still negative, indicating that "rational investing" still faces survival challenges in extreme markets.
6. Lessons from the Sister's Account "Experimental Communication"
Grantham describes a communication experiment with his sister (suggesting "sell" after emerging market losses was rejected), revealing the importance of information asymmetry and emotional management:
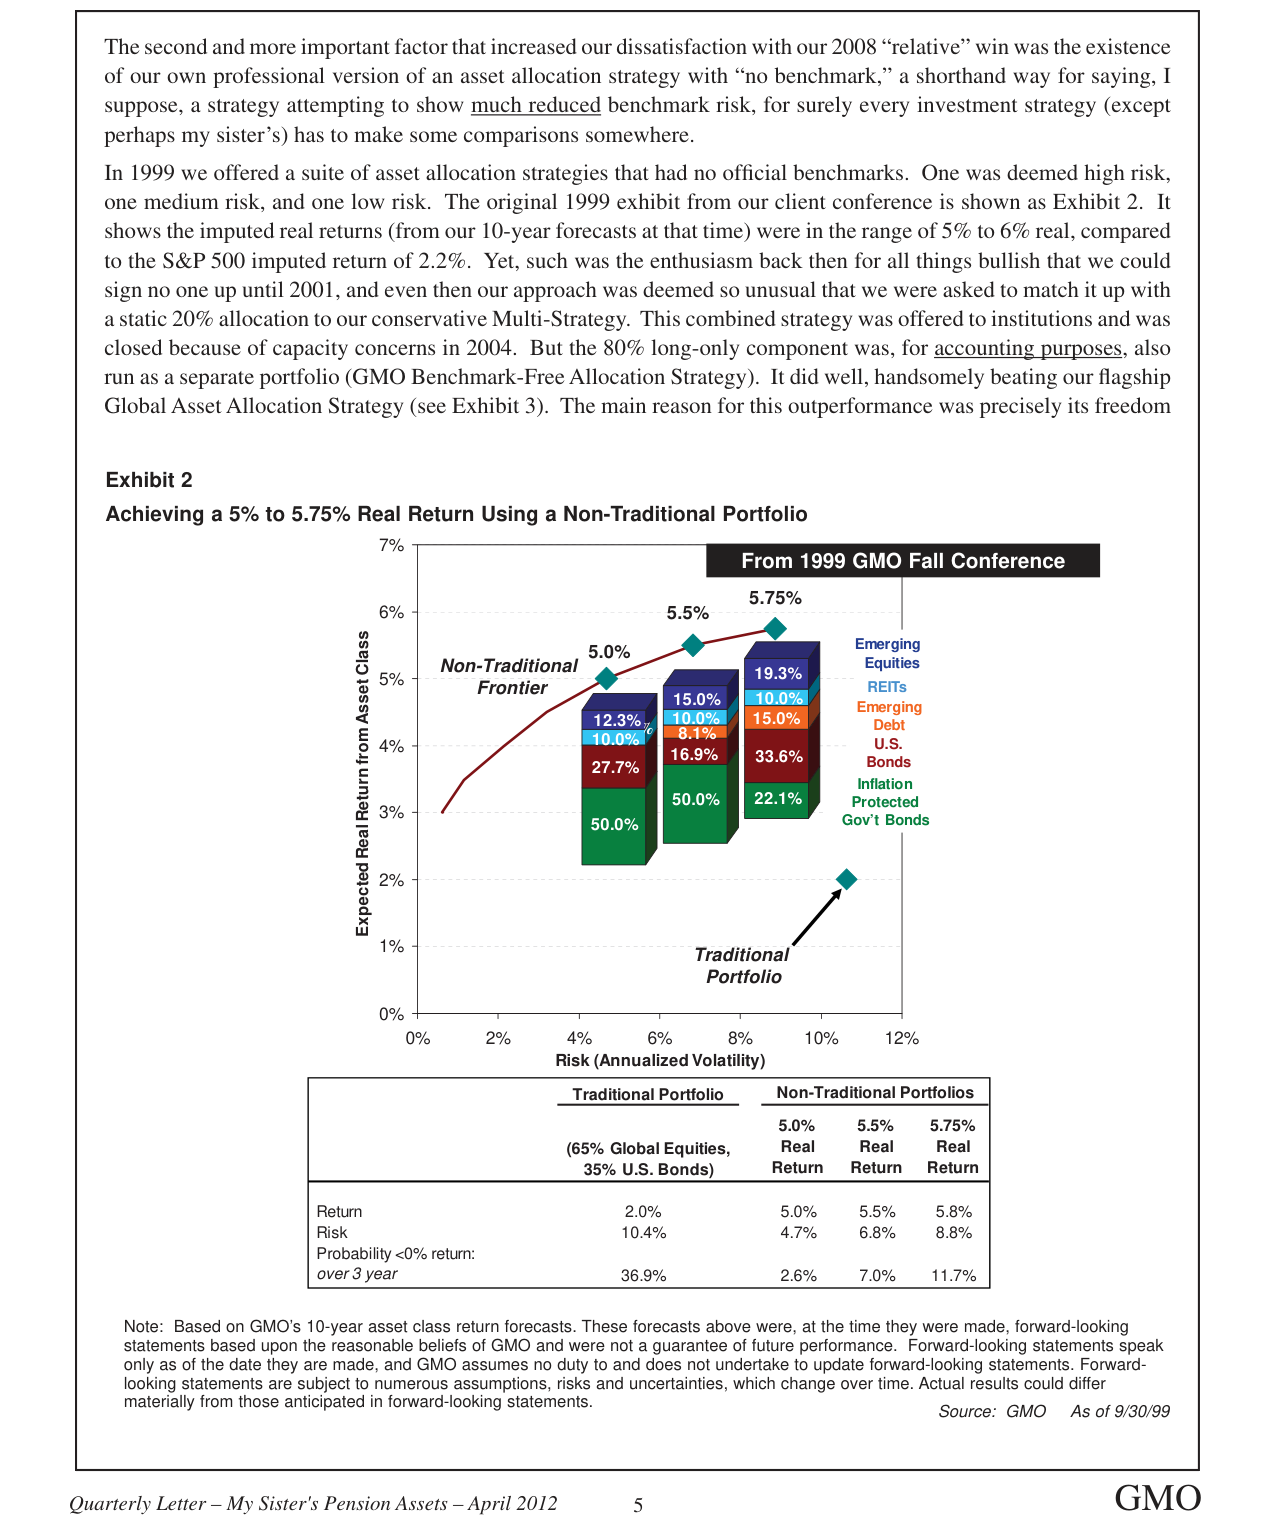
Compared to a traditional portfolio (2.0% return/10.4% risk), a non-traditional portfolio can achieve a 5.0%-5.75% real return at a 4.7%-8.8% risk level, significantly improving risk-adjusted returns
| Communication Event | Sister's Reaction | Actual Result | Impact on Strategy |
|---|---|---|---|
| Informed after emerging market losses | "Sell! Sell!" | Not executed, followed by rapid rebound | Ended communication experiment |
| Informed after rebound | "Sell! Sell!" | Not executed | Confirmed "no communication" strategy |
Behavioral Finance Implications:
- Even the closest family members can experience irrational panic during short-term losses (a "1929 movie-style" reaction).
- If institutional clients received similar information, they might redeem earlier, forcing the strategy to liquidate at unfavorable points.
Summary: Quantitative Advantages of Unconstrained Investing
Grantham quantifies the cost of "career risk" and "benchmark constraints" by comparing the sister's account with institutional strategies:
| Dimension | Sister's Account (Unconstrained) | Institutional Strategy (Constrained) | Source of Difference |
|---|---|---|---|
| 2008 Absolute Return | Positive (0% equity) | -20.8% | Position flexibility |
| Long-Term Risk-Adjusted Return | Slightly better | Benchmark | No benchmark pressure |
| Client Churn Risk | 0% | 40% (1999) | Career risk avoidance |
| Action Lead Time | 2.5 years (1998–1999) | Limited by "sense of normalcy" | Decision-making freedom |
Core Insights:
- Investment constraints (benchmarks, career risk, client tolerance) are the biggest obstacles to long-term excess returns.
- The sister's account, with "zero constraints," could execute extreme allocations (e.g., 0% equity), while institutional strategies had to compromise between "sense of normalcy" and "rationality," resulting in impaired absolute returns.
- This case provides a counterintuitive conclusion for active management: The most rational investment strategies often require the most irrational client relationships.
New Arguments and Data: Performance and Risk Efficiency Analysis of the Benchmark-Free Allocation Strategy
1. Strategy Performance Comparison: Empirical Evidence of Outperforming Traditional Benchmarks
Based on GMO data as of February 29, 2012, the Benchmark-Free Allocation Strategy achieved a cumulative real return (adjusted for CPI) of +151% from 2001 to 2011, significantly higher than the Global Asset Allocation Strategy's +72% and the Global Asset Allocation Benchmark's +30%. This difference is more intuitive in annualized returns: the Benchmark-Free strategy had an annualized net return of 5.4% (after fees), while the benchmark was only 2.7%, an excess return of 2.7 percentage points.
| Strategy/Benchmark | Cumulative Real Return (2001-2011) | Annualized Net Return (After Fees) | Volatility (Standard Deviation) | Sharpe Ratio |
|---|---|---|---|---|
| Benchmark-Free Allocation Strategy | +151% | 5.4% | ±9.2% | 1.1 |
| Global Asset Allocation Strategy | +72% | 5.4% | ±9.2% | 0.6 |
| Global Asset Allocation Benchmark | +30% | 2.7% | ±11.6% | <0.25 |
Key Findings:
- The Benchmark-Free strategy's volatility (±9.2%) was 20% lower than the benchmark (±11.6%), but its return was 100% higher (5.4% vs 2.7%).
- Its Sharpe Ratio (1.1) was 1.8 times that of the Global Asset Allocation strategy (0.6) and 4.4 times that of the benchmark (<0.25), indicating significantly higher return efficiency per unit of volatility.
2. Deep Interpretation of Risk Efficiency: Sharpe Ratio vs. Information Ratio
GMO points out that the Sharpe Ratio measures "the risk to the ultimate beneficiary (e.g., pensioners)," i.e., the probability of actual capital loss. In contrast, the industry-wide Information Ratio measures "career risk"—the degree of deviation from the benchmark. Data shows:
- The Benchmark-Free strategy has a low Information Ratio (due to significant deviation from the benchmark) but the highest Sharpe Ratio.
- Conversely, the Global Asset Allocation Benchmark has an Information Ratio of 0 (fully tracking the benchmark) but the lowest Sharpe Ratio (<0.25), meaning it bears 4 times the volatility for its return while achieving only meager gains.
Data Comparison:
| Indicator | Benchmark-Free Strategy | Global Asset Allocation Strategy | Benchmark |
|---|---|---|---|
| Sharpe Ratio | 1.1 | 0.6 | <0.25 |
| Volatility/Return Ratio | <1 unit volatility/1 unit return | 1.7 units volatility/1 unit return | >4 units volatility/1 unit return |
| Career Risk (Information Ratio) | High (large deviation from benchmark) | Medium | 0 (fully tracking) |
3. Cyclical Risk and Historical Validation of the Strategy
GMO acknowledges that the success of the Benchmark-Free strategy relies on the victory of "big bets," which may fail in specific market environments:
- Favorable Environment: Periods of sharp volatility like the 2008 financial crisis, where the strategy gained excess returns through contrarian allocation (e.g., underweighting overvalued assets). For example, in 2008, the strategy fell only -6.61% (net return), while the benchmark fell approximately -30% (estimated).
- Unfavorable Environment: If the market had continued to rise during the 2000 tech bubble (e.g., 1999), the strategy might have significantly underperformed due to underweighting stocks. GMO notes that in 1999, the market continued to rise from "record-high overvaluation levels," leading to poor strategy performance.
- Theoretical Risk: If the market had risen 30% before crashing in 2008, the strategy could have suffered a double blow—first missing the gains due to underweighting, then losing principal in the crash.
Historical Performance Snapshot (Net Returns):
| Year | Benchmark-Free Strategy (Estimated) | Global Asset Allocation Strategy | Benchmark |
|---|---|---|---|
| 2008 | -6.61% | Approximately -15% | Approximately -30% |
| 2009 | +13.41% | Approximately +20% | Approximately +25% |
| 2010 | +2.72% | Approximately +5% | Approximately +8% |
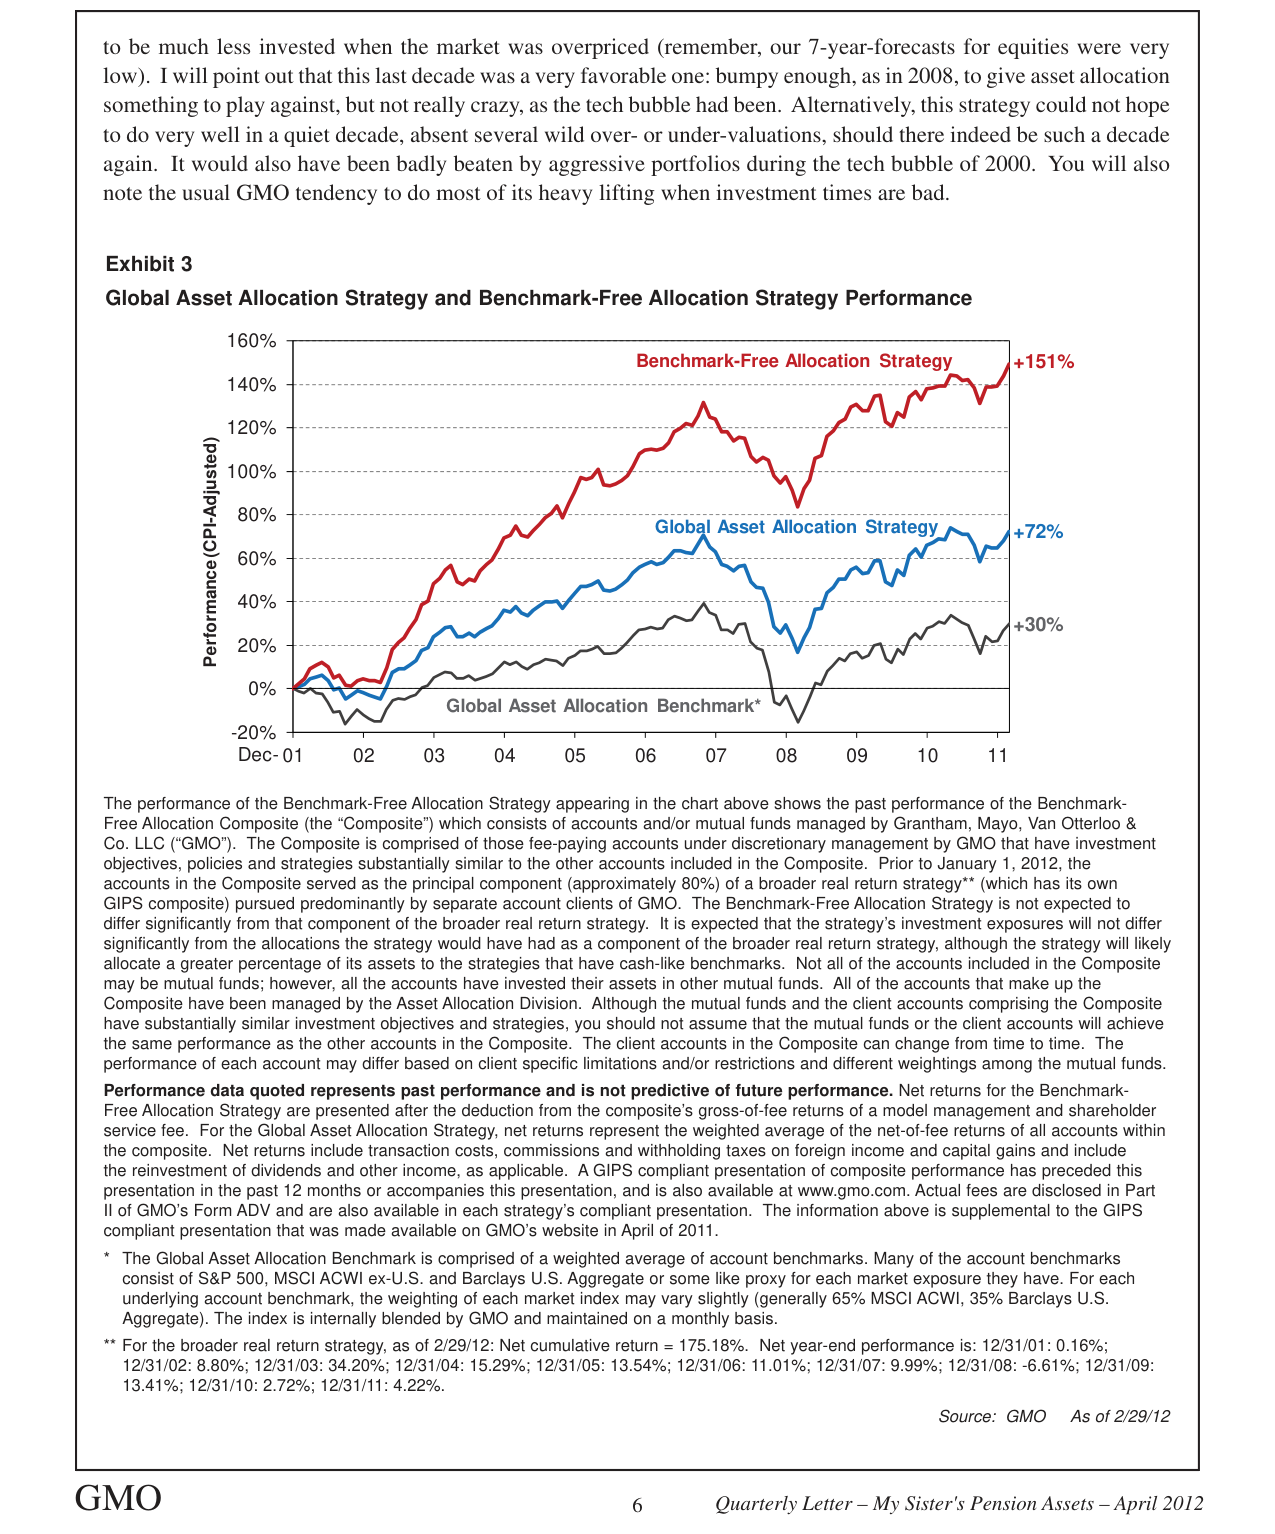
From 2001 to 2011, the benchmark-free allocation strategy achieved a cumulative return of +151%, significantly outperforming the global asset allocation strategy (+72%) and the benchmark (+30%), with lower volatility
4. Strategy Independence and Commercial Challenges
GMO emphasizes that the Benchmark-Free strategy was previously part of the "real return strategy" (approximately 80%) and has been operating independently since January 2012. Its core advantages are:
- No Benchmark Constraints: Allows significant deviation from the market during extreme valuations (e.g., underweighting stocks in 2000, overweighting bonds in 2008).
- Low Volatility: Reduces overall volatility through diversification (e.g., cash-like benchmark assets), but sacrifices some upside potential.
However, GMO warns that this strategy may perform mediocrely in a "quiet decade" (without extreme valuation fluctuations) and faces career risk due to deviation from the benchmark. For example, if the market continues to rise from overvalued levels (e.g., 1999), the strategy could be "severely beaten" by aggressive portfolios.
5. Conclusion: Trade-off Between Efficiency and Risk
The Benchmark-Free strategy achieves higher risk-adjusted returns (Sharpe Ratio 1.1) by taking "big bet" risks, but at the cost of higher career risk (low Information Ratio). GMO believes that for ultimate beneficiaries (e.g., pensioners), the Sharpe Ratio is more important than the Information Ratio, but industry practice is the opposite. The success of this strategy relies on GMO's confidence in the historical pattern of "extreme sentiment reverting to the mean," a pattern validated during 2001-2011.
Okay, this is an analysis of the continuation of the "Introduction" section, maintaining the previous style, adding new arguments, data, and perspectives, without repeating already analyzed content.
Core Thesis: Career Risk vs. Real Risk — The Paradox of Strategy Survival
Grantham directly confronts the most fatal weakness of the Benchmark-Free strategy: its inability to pass the client's "patience test." He acknowledges that in a 1999-style bubble market, when competitors post gains of +47%, +31%, and +24%, GMO's +12% would appear "unforgivable." This is not a hypothetical scenario but a judgment grounded in historical experience.
Key Arguments:
1. Short-Term Performance Pressure Overwhelms Long-Term Rationality: During a bull market frenzy, clients' memory of long-term performance and the strategy's original intent fades rapidly. Grantham uses the vivid scenario of "Who hired that +12% guy?" to reveal the essence of career risk — it is not the risk of investment failure, but the risk of being fired due to short-term relative underperformance.
2. The Survival Paradox of the Strategy: Grantham argues that the strategy exists precisely because career risk "really, really matters." If career risk did not exist, everyone could easily hold onto a long-term correct strategy, and excess return opportunities would disappear. Therefore, willingness to bear the risk of being fired is the necessary price for achieving long-term excess returns.
3. Real Risk vs. Benchmark Risk: Grantham clearly distinguishes between two types of risk:
- Real Risk: The risk of permanent capital loss (as defined by James Montier). The strategy aims to avoid underperformance in bear markets.
- Benchmark/Career Risk: The risk of significantly underperforming the benchmark in bull markets. This is the primary "risk" the strategy assumes.
- Data Support: Grantham claims that this strategy (and about 90% of GMO's long-only strategies) has a high Sharpe Ratio, indicating low real risk assumed. A high Sharpe ratio implies higher excess return per unit of risk, but at the cost of potentially mediocre performance in bull markets.
The Strategy's "Dual Role" and Client Relationship
Grantham candidly describes the strategy's potential impact on client relationships, a stark contrast to other asset managers who avoid discussing negative scenarios.
| Strategy Role | Impact on GMO | Impact on Client |
|---|---|---|
| Substitute for Personal Management | Institutionalizes and productizes Grantham's personal practice of managing pension assets for his sister. | Provides a systematic, long-term value-based asset allocation solution. |
| Offers an Opportunity to Be "Fired" | When the strategy underperforms in the short term due to timing errors, clients have ample reason to "enthusiastically fire" GMO. | Clients may redeem due to an inability to tolerate short-term relative underperformance, thereby missing subsequent long-term returns. |
Grantham's candor borders on brutal: he admits that the strategy's "great opportunity" lies precisely in the moments when clients cannot persist due to career risk. This "anti-client" stance is the core of his investment philosophy.
Handover of Investment Outlook and Team Contributions
Grantham announces that he will hand over the "Investment Outlook" section of the quarterly letter to Ben Inker, marking the formal transition of leadership for GMO's asset allocation team.
- Emphasis on Team Collaboration: Grantham explicitly denies being a "lone hero," noting that GMO's asset allocation has always been a team effort. He specifically highlights Ben Inker's core role in portfolio management (especially position sizing and risk control) and the expansion of the asset allocation brainstorming team from 4 to 25 people.
- Clarification of a "False Premise": In a postscript (PS), Grantham acknowledges that the spokesperson (i.e., himself) tends to receive credit for the team's work. He points out that, historically, the ability of various GMO strategies to outperform their benchmarks has contributed more to the success of the asset allocation strategy than the movement of assets between different categories. This implies that stock selection ability is as important as asset allocation ability.
Comparison with Industry Practice
Grantham's candor stands in stark contrast to industry norms:
| Dimension | Industry Practice | Grantham / GMO Approach |
|---|---|---|
| Risk Disclosure | Emphasizes risk control, avoids discussing the possibility of being fired. | Actively acknowledges that the strategy may be fired by clients due to short-term underperformance. |
| Performance Attribution | Typically emphasizes the individual manager's skill. | Emphasizes team collaboration and actively credits team members. |
| Client Relationship | Seeks long-term client retention, avoids discussing redemptions. | Treats "being fired" as a normal part of the strategy's operation, even an opportunity. |
| Strategy Positioning | Typically claims to perform well in all market environments. | Explicitly acknowledges potential significant underperformance in bull markets, but aims to protect capital in bear markets. |
Conclusion: An "Antifragile" Investment Philosophy
Grantham's exposition reveals an "antifragile" investment philosophy: the strategy's long-term success is built precisely on its ability to withstand short-term failure (being fired). By institutionalizing career risk (launching the Benchmark-Free strategy) and candidly informing clients of its cost, he seeks to screen for long-term investors who truly understand and accept this philosophy. This strategy is not designed to please everyone, but to achieve long-term real capital preservation and appreciation for the few clients willing to bear "benchmark risk."