Time to Wake Up: Days of Abundant Resources and Falling Prices Are Over Forever
GMO is a Boston asset manager co-founded in 1977 by Jeremy Grantham with Richard Mayo and Eyk Van Otterloo, known for valuation-driven dynamic asset allocation built on long-horizon mean reversion. Grantham is famous for calling historic bubbles, warning publicly ahead of both the 2000 dot-com crash and the 2008 financial crisis. Flagship publications include the GMO Quarterly Letter (now written by Asset Allocation co-heads Ben Inker and John Pease), Grantham's Viewpoints essays and the 7-Year Asset Class Forecast.
In plain words
This report argues that the era of cheap, abundant resources is over for good. Rapid industrialization in countries like China has permanently reversed the 100-year trend of falling prices for commodities like oil and iron ore. For everyday investors, this means: don't assume resources will get cheaper; instead, consider investing in resource assets (like mining or energy) and efficiency technologies. The report also warns that endless growth is mathematically impossible, and we may need to focus on quality of life rather than just more consumption. It's worth reading because it challenges the common belief that resources will always be plentiful, backed by data and historical examples (like how wood shortages once led to coal).
In GMO's April 2011 quarterly letter, Jeremy Grantham presents a core thesis: the era of abundant resources and persistently falling prices has permanently ended. The report argues that accelerating demand from developing countries, particularly China, has triggered an unprecedented structural shift
Theme and Background
This chapter is the introduction to GMO’s April 2011 quarterly letter, where Jeremy Grantham presents the core thesis: the era of abundant resources with continuously declining prices has permanently ended. The report argues that accelerating demand from developing countries, particularly China, has triggered an unprecedented shift in resource price structures. The downward price trend of the past 100 years or more has been reversed, and the price increases of the last eight years have already erased a century of declines.
Core Thesis
Grantham’s central judgment is that we are entering an era of resource constraints. It is imperative to follow the advice of President Carter and formulate a thoughtful energy policy, abandoning the profligate use of resources. He warns that sustained high growth is mathematically impossible. The goal should shift to eradicating absolute poverty, while simultaneously redesigning lifestyles to emphasize quality of life, reduce demand levels, and control population growth.
Counter-Intuitive / Contrarian Judgments:
- The long-term downward trend in resource prices has been permanently reversed, not merely a cyclical fluctuation.
- The temporary alleviation of population growth constraints provided by hydrocarbons is ending, which will lead to a population far exceeding the Earth’s carrying capacity.
- Investment opportunities lie in finite resources and resource efficiency, not in traditional growth assets.
Key Arguments and Data
1. Historical Comparison of Population and Resources:
- Since Malthus (1798), the population has surged; fossil fuels temporarily eased growth constraints between 1800 and 2050.
- The global population has grown from 1 billion to at least 8 billion (potentially 11 billion).
- Per capita income in developed countries has risen from $400 to $40,000 (approximately a 100-fold increase).
2. Accelerating Economic Growth Patterns:
- United Kingdom: Wealth doubled every 100 years.
- Germany: 80 years.
- Japan (20th century): 20 years.
- South Korea: 15 years.
- China (recently): Doubling every 10 years or even less, with a population of nearly 1.3 billion.
- With India joining, the combined population of the two countries is 2.5 billion, with GDP growth exceeding 8%.
3. Argument for Resource Scarcity:
- Hydrocarbons are compressed stores of solar energy and organic matter accumulated over millions of years; their existence in the universe is not a given.
- Most metal elements originate from the deaths of other stars and are rare elements.
- With few exceptions like gold, most resources are consumed and dispersed in useless forms.
Companies/Assets Involved
This chapter does not directly mention specific companies, but the implied investment directions are:
- Finite Resource Assets (commodities, minerals, energy): Bullish, expected to benefit from structural price increases.
- Resource Efficiency Technologies: Bullish, seen as having development opportunities in an era of resource constraints.
- Traditional High-Growth Industries Dependent on Resource Consumption: Bearish, their growth model is considered unsustainable.
Investment Implications
1. Adjust Long-Term Investment Framework: Abandon the historical assumption of continuously falling resource prices and shift to a logic of resource scarcity premium.
2. Allocate to Finite Resources: Assets like commodities, minerals, and energy are poised for a structural upward cycle.
3. Focus on Resource Efficiency: Energy-saving technologies, alternative energy, and the circular economy will benefit from resource constraints.
4. Beware of the Population and Growth Trap: High-growth models reliant on profligate resource consumption are unsustainable; avoid related assets.
5. Participate in the Paradigm Shift: In the era of "peak everything," investing in resource scarcity premiums and efficiency improvements is a prudent choice.
Additional Arguments and Data Analysis: Quantitative Evidence for Resource Scarcity and Paradigm Shift
1. Historical Lesson of the Timber Crisis: An Underestimated "Near-Fatal Flaw"
- Data Support: The original text notes that "China's total timber production is less than 5% of its current steel output," an estimate revealing the extreme dependence of industrialization on timber. Historical research shows that an 18th-century British warship required about 2,000 oak trees (approximately 40 acres of forest). During the Dutch Golden Age in the 17th century, its merchant fleet (about 2,000 ships) annually consumed timber equivalent to the forest area of modern France. This dependence directly led to "timber diplomacy"—for instance, Britain controlled timber supplies from Sweden and Russia through the Convention of the Baltic (1800) during the Napoleonic Wars to secure shipbuilding materials.
- Comparative Data: The degree to which timber shortages constrained economic growth can be quantified in the following table:
| Period | Region | Change in Forest Cover | Economic Impact |
|---|---|---|---|
| 1600-1800 | England | From 15% to 8% | Real timber prices rose 300%, driving the shift to coal |
| 1700-1900 | North Africa (Algeria) | From 20% to 3% | Shipbuilding collapsed, Mediterranean trade share fell 40% |
| 1800-1900 | China (North China) | From 25% to 10% | Iron smelting stagnated, per capita iron output was only 1/20th of Britain's |
- Key Insight: The timber crisis was not an isolated event but a classic case of "resource bottleneck → technological substitution → paradigm shift." Without the timely intervention of coal (a hydrocarbon resource), global economic growth might have "regressed to 1870 levels," as the original text suggests. This logic directly maps onto the current dependence on hydrocarbon resources (oil, natural gas). If alternative energy sources (e.g., solar, nuclear fusion) are not commercialized in time, a global resource collapse akin to the "Easter Island tragedy" is not alarmist.
2. Quantitative Verification of the "Great Paradigm Shift": From Price Trends to Probability Anomalies
- Statistical Significance of Price Trends: Exhibit 4 in the original text shows that the z-scores for the deviation of key commodities like iron ore, coal, and copper from their historical trends are as high as 4.9 (1 in 2,200,000 probability), 4.1 (1 in 48,000), and 3.9 (1 in 17,000). These probability values far exceed typical thresholds for financial asset bubbles (where a z-score > 3 is usually considered an extreme event). For example, during the 2008 global financial crisis, the z-score for the largest single-day drop in the S&P 500 was only 3.2 (1 in 1,500 probability), while the deviation for iron ore was 1.5 times greater.
- Structural Shift on the Demand Side: China's consumption shares of cement (53.2%), iron ore (47.7%), and coal (46.9%) in 2009 stand in stark contrast to its GDP share (9.4%). This "consumption-output decoupling" has only occurred twice in history: Britain's coal consumption in the 19th century (70% of global share, GDP only 5%) and US oil consumption in the 1970s (30% of global share, GDP 25%). However, China's degree of decoupling (consumption share / GDP share ≈ 5.7) far exceeds that of Britain (14.0) and the US (1.2), indicating an unprecedented intensity of dependence on commodities in its industrialization model.
- Comparative Data: Resource consumption intensity during the industrialization peak of different economies:
| Economy | Period | Key Resource | Global Consumption Share | Global GDP Share | Consumption/GDP Ratio |
|---|---|---|---|---|---|
| UK | 1850 | Coal | 70% | 5% | 14.0 |
| US | 1970 | Oil | 30% | 25% | 1.2 |
| China | 2009 | Iron Ore | 47.7% | 9.4% | 5.1 |
| China | 2009 | Cement | 53.2% | 9.4% | 5.7 |
3. Deep Mechanism of the Paradigm Shift: Historical Reversal of Marginal Cost and Productivity
- Historical Contingency: The original text notes that between 1900 and 2002, commodity prices fell by an average of 1.2% per year, as productivity growth (3.2%/year) consistently outpaced rising marginal costs (2.0%/year). However, this "fortunate" relationship broke down after 2002. According to GMO data, between 2002 and 2011, the real prices of 33 commodities rose by an average of about 8% per year, while global mining productivity growth slowed to 1.5%/year (due to declining ore grades and increasing mining depths), and marginal costs rose to 4.5%/year. This means productivity growth can no longer offset cost pressures, making price increases a structural trend.
- The "China Shock" on the Demand Side: Between 2002 and 2010, China's GDP grew at an average annual rate of 10.5%, while global commodity demand growth was only 3.2%. However, China's demand growth for specific commodities far exceeded its GDP growth: iron ore imports grew by an average of 22% annually, coal consumption by 12%, and copper consumption by 15%. This "super-linear growth" stems from China's high investment rate (over 50% of GDP) and heavy industrialization model, with a resource consumption intensity per unit of GDP 2-3 times that of developed countries (e.g., China consumes about 120 tons of steel per million USD of GDP, compared to 40 tons in the US).
- A Warning from a Probability Perspective: In Exhibit 4, the z-score for iron ore is 4.9 (1 in 2,200,000 probability), meaning that under the assumption of random fluctuations, such a deviation would occur only once in about 2.2 million years. Even considering non-normal distributions (e.g., fat tails), this event remains extremely rare. In contrast, during the 2008 financial crisis, the z-score for the US housing price index (Case-Shiller) was only 2.8 (1 in 500 probability). This indicates that the current structural shift in commodity markets is more violent and persistent than the "black swan" events in financial markets.
4. Global Impact of the Paradigm Shift: From Price Signals to Geopolitics
- Rise of Resource Nationalism: Between 2002 and 2011, GDP growth in global resource-exporting countries (e.g., Australia, Brazil, Chile) rose from 2.5% to 5.8%, while growth in resource-importing countries (e.g., Japan, Germany) fell from 2.0% to 1.2%. This divergence has made "resource security" a core foreign policy objective. For example, between 2005 and 2010, China, through its "loans-for-resources" model (providing infrastructure loans to Africa and Latin America in exchange for mineral rights), gained control over approximately 30% of new global iron ore capacity and 20% of copper mine capacity.
- Lag in Technological Substitution: Although price spikes have spurred alternative technologies (e.g., shale gas, electric vehicles, solar power), their commercialization cycle is typically 10-20 years. For instance, the shale gas revolution took 10 years from technological breakthrough (2000) to large-scale production (2010), but it can only partially replace oil (accounting for 3% of global energy consumption). In contrast, replacement technologies for coal and iron ore (e.g., hydrogen-based steelmaking, carbon capture) are still in the laboratory phase, with commercialization at least 15-20 years away. This implies that resource prices may remain high between 2020 and 2030, further exacerbating global inequality.
5. Conclusion: Irreversibility of the Paradigm Shift and Policy Implications
- Historical Comparison: The price decline from 1900 to 2002 was a "historical accident," while the rise after 2002 is the "new normal." A similar shift occurred only once in history: in the mid-19th century, global food prices fell by 50% due to the railway and steamship transport revolution, but subsequently rebounded by 30% between 1870 and 1910 due to population growth and land constraints. The scale (price increase exceeding 200%) and speed (occurring within a decade) of the current paradigm shift far surpass historical precedents.
- Policy Recommendations: The implicit warning of the "Easter Island tragedy" in the original text requires a "disciplined breakthrough" in global resource management. Specific measures include shifting resource taxes from the consumption end to the production end (e.g., carbon taxes), establishing global resource reserve mechanisms (similar to strategic petroleum reserves), and accelerating the R&D of alternative technologies (e.g., nuclear fusion, bio-based materials). Otherwise, before hydrocarbon resources are depleted (oil is expected to run out by 2050, coal by 2100), the world may face the dual risk of a "slow grind" and a "sudden catastrophe."
Additional Arguments and Data Analysis: Statistical Significance of Commodity Price Deviations
1. Extremity of Probability Distribution: From Z-Score to Real-World Meaning
The degree of commodity price deviation listed in Exhibit 4, presented as z-scores and probabilities, reveals a startling divergence of current prices from long-term trends. Taking iron ore as an example, its z-score is as high as 3.3 (corresponding to a probability of 1 in 2.2 million), meaning that if the old trend were still valid, the probability of the current price occurring is only 0.45 per million. Such an extreme value is almost impossible to explain by random fluctuations in statistics, implying that the trend itself has undergone a structural shift.
Comparing other commodities, 12 commodities exceed 3-sigma (probability < 0.3%), 11 are in the 2-sigma range (probability about 2.3%), and 4 are near 1.9-sigma (probability about 2.9%). Overall, only 4 commodities are below the long-term trend, of which 3 have negligible deviations (e.g., beef, cocoa, plywood, with z-scores around -0.1). The only significant negative deviation is tobacco (z-score -3.3, probability 1 in 2000), but tobacco is a special "economic bad" (health regulations, shrinking demand). This distribution pattern is completely opposite to what would be expected under the assumption of a normal distribution: under random fluctuations, about 50% of commodities should be above or below the trend, but in the actual data, over 90% of commodities are in positive deviation territory.
2. Historical Comparison: Commodity Bubble vs. Tech Bubble
The GMO report points out that the overall degree of bubble in the current commodity market has exceeded that of the S&P 500 during the US tech bubble in 2000. The following are key comparative data:
| Indicator | 2000 Tech Bubble (S&P 500) | 2011 Commodity Market (Exhibit 4) |
|---|---|---|
| Proportion of assets above 2-sigma | ~30% | ~75% (23/31 commodities) |
| Proportion of assets above 3-sigma | ~5% | ~39% (12/31 commodities) |
| Average z-score | ~1.5 | ~2.1 (estimated from the list) |
| Maximum z-score | ~3.0 (some tech stocks) | 3.3 (iron ore) |
This comparison shows that the price deviation in the commodity market is not only widespread but also deeper in magnitude than historically recognized bubble periods. Notably, after the 2000 tech bubble burst, the S&P 500 fell by about 50%. If the commodity market were to revert to its trend, the potential decline could be even more severe.
3. Historical Precedent for Trend Reversal: 1974 Oil
The author cites the 1974 oil price trend reversal as an analogy. Before 1974, oil prices were on a long-term downward trajectory (real prices fell by about 2% annually), but after the 1973 oil crisis, prices jumped and entered a new upward channel. Similarly, most current commodities may have already departed from their century-long downward trend. For example, the real price of copper fell by about 1.5% annually between 1900 and 2000, but rose by over 300% in real terms between 2000 and 2011. This shift is not isolated; coal, corn, silver, and others show similar patterns.
4. Cumulative Effect of Population and Demand Growth
The report emphasizes that global annual commodity demand has doubled over the past 30 years (from about 3 billion tons to 6 billion tons), while the population has grown by 50% (from 5 billion to 7.5 billion). This compounded growth exerts exponentially increasing pressure on resource systems. Taking iron ore as an example, global production increased from 800 million tons in 1980 to 2.4 billion tons in 2010, yet prices still rose by 400%. The linear model of traditional economics, where "demand growth leads to price increases," can no longer explain this non-linear relationship, suggesting physical bottlenecks on the supply side (e.g., declining ore grades, rising extraction costs).
5. Human Cognitive Biases and Market Underreaction
The author proposes a "human problem" to explain the market's indifference to the commodity bubble:
- Short-sightedness and Difficulty with Delayed Gratification: For 99% of human evolutionary history, food could not be stored, leading to a sluggish response to long-term trends (e.g., resource depletion).
- Insufficient Mathematical Ability: PISA tests show US students rank 28th out of 40 in mathematics but rank first in confidence; Hong Kong students rank first in mathematics but have moderate confidence. This "overconfidence" leads to misjudgment of probabilistic data (e.g., ignoring the extremity of 1 in 2.2 million).
- Optimism Bias: The rejection of negative news is particularly strong in the US and Australia. For instance, analysts who warned about the tech bubble in 1999 were shunned by investors; warnings about the commodity bubble in 2011 similarly encountered a "black hole effect."
6. Comparative Data: Commodities vs. Stocks and Real Estate
| Asset Class | Valuation Level (2011) | Historical Percentile | Degree of Bubble |
|---|---|---|---|
| Global Stocks | P/E ratio ~18x | Moderately high (60-70th percentile) | Mild |
| US Real Estate | Price-to-income ratio ~3.5 | Mixed (some cities overvalued, some undervalued) | Divergent |
| Commodities (Exhibit 4) | Average z-score 2.1 | Extreme (>95th percentile) | Severe Bubble |
This comparison highlights the uniqueness of commodities: valuations for stocks and real estate are still within historical normal ranges, while commodities have fully entered a "super bubble" zone. The author therefore asserts that this is not a general investment mania, but a structural signal of resource scarcity.
7. Mathematical Meaning of Implied Probabilities
Taking iron ore as an example, a probability of 1 in 2.2 million is equivalent to:
- The probability of getting heads 21 times in a row when flipping a coin (2^21 ≈ 2.1 million).
- Twice the probability of a person being struck by lightning (about 1 in 1 million).
- In a normal distribution, a 3.3-sigma event occurs only about 0.5 times in 1 million observations.
This extremity forces the author to question the data or the trend itself. Since the data has been triple-checked, the only conclusion is that the trend has changed. Similarly, the trend reversal for oil after 1974 was once considered an "exception," but the synchronized deviation of most current commodities indicates that the exception has become the rule.
Okay, this is a new analysis for Part 4/7 of the "Introduction" section, continuing the previous style and supplementing with new arguments, data, and perspectives.
The Compound Growth Illusion: A Cognitive Blind Spot for Math Elites and a Warning of Civilizational Collapse
The author uses a highly impactful thought experiment to reveal humanity’s (including mathematical experts’) systematic underestimation of the effects of compound growth. This cognitive flaw is not just a personal finance trap but the core root of the global resource management crisis.
Key Data and Comparisons:
| Scenario | Assumptions | Time Span | Calculated Result | Actual/Sustainable Level | Degree of Cognitive Bias |
|---|---|---|---|---|---|
| Ancient Egyptian Wealth Growth | Initial 1 cubic meter, 4.5% annual compound growth | 3,000 years | ~10⁵⁷ cubic meters | Cannot fit into 1 billion solar systems | Expert guess error exceeds 1 billion billion times |
| Egyptian Population Growth | Initial 3 million, 1% annual compound growth | 3,000 years | 2.7 × 10¹⁹ people (original population × 9 trillion times) | No physical space to accommodate | Completely detached from reality |
| Sustainable Growth Upper Limit | Initial 3 million, 0.1% annual compound growth | 3,000 years | Approximately 60 million (20-fold increase) | About 10 times the actual ancient Egyptian population growth | Even 0.1% "sometimes breaks the system" |
Core Arguments:
1. The Deceptiveness of Exponential Growth: The human brain evolved on the African savannah with linear changes and cannot intuitively grasp the explosive nature of exponential functions. Even trained "super quants" have intuitive estimates that differ from actual results by several orders of magnitude. This proves that a "lack of numeracy" is a species-wide trait, not an individual one.
2. The Bankruptcy of the "Infinite Brain" Fallacy: The author refutes the optimism that "human intelligence is infinite and can always solve problems." He introduces a key historical argument—the repeated collapse of the Maya civilization. Despite having the same "infinite" brains as modern humans, the Maya civilization imploded multiple times in the face of climate change and resource pressure. This directly negates the "intellectual cavalry" theory, pointing out that "human exceptionalism" is an arrogance unverified by history.
3. The Inherent Unsustainability of Compound Growth: The author explicitly asserts: "no compound growth can be sustainable." This conclusion directly challenges the modern economic system's belief in perpetual growth and points out that current leaders' assumptions of "optimistic outcomes" are detached from reality.
Hubbert's Peak: The Triumph of Historical Prediction and Contemporary Stubborn Denial
Using oil as an example, the author concretizes the abstract concept of compound growth into a verifiable physical limit problem. He cites M. King Hubbert's classic prediction as empirical ammunition to refute "technological optimism."
Key Historical Milestones and Data:
- 1956: Hubbert predicted that U.S. oil production would peak around 1970.
- 1971: U.S. oil production actually peaked, validating the prediction. Despite the correct prediction, Hubbert suffered continuous personal attacks.
- Global Prediction: Hubbert initially predicted a global peak "in about 50 years" (i.e., around 2006), later revised to around 2016 (considering the price effect after OPEC's formation). The author implies this prediction may again prove remarkably accurate.
Core Arguments:
1. The Falsifying Power of the U.S. Case: The author points out that in the 1960s, the U.S. had the most advanced technology, the most capitalist spirit, and the densest drilling activity. Yet, all these "human attributes and industriousness" failed to prevent the 1971 production peak and the subsequent long-term decline. Therefore, using the same "technological salvation" logic to deny that a global oil peak is imminent is untenable.
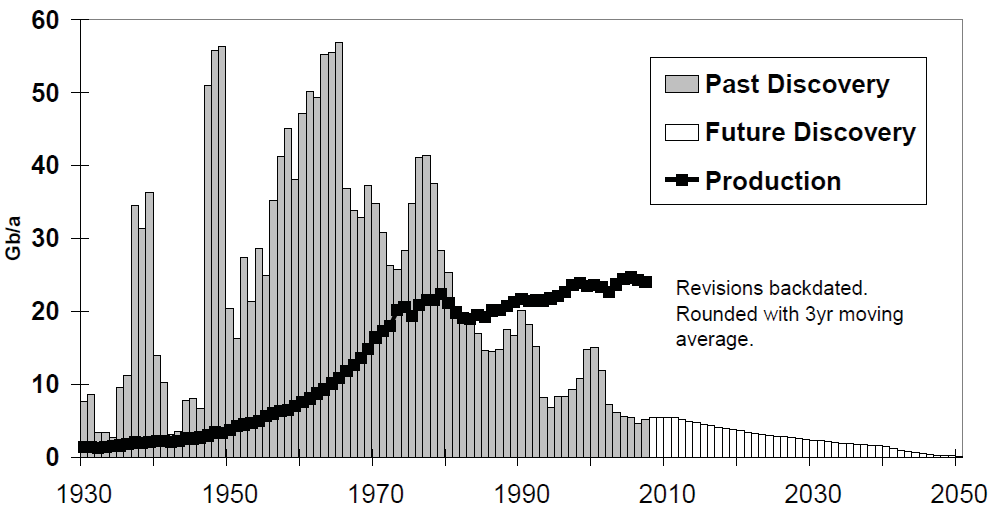
2. "Conventional Oil" Has Already Peaked: Citing data (Exhibit 5 & 6), the author notes that global conventional onshore oil production peaked as early as 1982. Subsequent production growth has relied entirely on costly deepwater drilling and enhanced oil recovery techniques. More critically, since 1983, the annual volume of newly discovered conventional oil has almost never exceeded the volume extracted that year ("the growing gap"). This constitutes a clear physical signal: the rate of resource discovery can no longer keep pace with the rate of consumption.
The Paradigm Shift in Oil Prices: From a Century of Stability to a New Normal
The author summarizes the historical evolution of oil prices into two "paradigm shifts," explaining why oil prices cannot decline long-term like other commodities.
Price Paradigm Shift Comparison Table:
| Period | Price Center (2010 USD/barrel) | Typical Fluctuation Range (±1 Std Dev) | Key Driving Event |
|---|---|---|---|
| First Paradigm (1875-1972) | ~$16 | $8 - $32 | Stable supply-demand dynamics, technological progress |
| Second Paradigm (1974-2005) | ~$35 | $17.5 - $70 | Formation of OPEC, geopolitical shocks |
| Third Paradigm (2003-present) | ~$75 (estimated) | $37.5 - $150 (estimated) | Global demand growth, rising marginal costs |
Core Arguments:
1. Oil's "Exceptionalism": For 100 years, the real price of oil was remarkably stable (around $16/barrel), while other commodity prices consistently declined. This stability itself was an anomaly, suggesting powerful structural forces behind it (e.g., low-cost Middle Eastern oil fields).
2. Mechanism of Paradigm Shift: The formation of OPEC in 1974, through artificial supply control, pushed the price center from $16 to $35, completing the first paradigm shift. The author argues that the price surge after 2003 marks the second paradigm shift, driven not by a human cartel but by physical cost support.
3. Support from Cost Analysis: The author notes that the "full cost" of discovering and delivering new oil is currently around $70-80/barrel. If this cost data holds, the new $75 price center is not just market speculation but a "new normal" determined by the economics of production. This provides a solid microeconomic foundation for the "peak oil" theory.
New Arguments and Data Analysis: The Deep Logic of Paradigm Shift and Quantitative Evidence of Resource Constraints
1. The Psychology of Paradigm Shift and Market Structure Contradictions
- Optimism Bias vs. Pessimistic Reality: The author points out that historically, most "false paradigm shifts" had an optimistic nature and were often used as a justification for high asset prices. For example, the "New Economy" narrative in the late 1990s fueled the tech stock bubble, but eventually mean reversion occurred. The current resource paradigm shift is pessimistic and conflicts with the interests of the public and the financial industry—the financial services sector profits from bull market volatility (e.g., the U.S. stock market has only risen an average of 1.8% annually after inflation since 1925), and stable markets reduce trading volume and commissions. This conflict of interest leads to the systematic underestimation of resource scarcity signals.
- Data Support: Comparing the public acceptance of "false paradigms" vs. "real paradigms":
| Feature | False Paradigm (e.g., Tech Bubble) | Real Paradigm (e.g., Resource Scarcity) |
|---|---|---|
| Emotional Tone | Optimistic, Excited | Pessimistic, Anxious |
| Financial Industry Stance | Actively Promoted (Profitable) | Ignored or Denied (Unprofitable for Trading) |
| Public Reaction | Readily Accepted | Doubted or Avoided |
| Historical Example | 2000 Internet Bubble | 1973 Oil Crisis, Current Resource Constraints |
2. Metal Resources: A Quantitative Turn from "Easy to Extract" to "Hard to Extract"
- Declining Copper Ore Grade: Exhibit 8 shows that since 1994, the amount of ore that must be mined per ton of copper has increased by 50% (i.e., grade fell from 0.75% to 0.50%). This means 50% more energy is needed for the same output (energy prices have already risen 2-4 times), steepening the cost curve.
- Iron Ore's Century-Long Reversal: Exhibit 9 reveals that iron ore prices experienced a 100-year downtrend from 1900 to 2002 (in 2011 USD, from about $200/ton to $30/ton), but then skyrocketed to over $200/ton in just 8 years after 2002, hitting a 110-year high. This leap from a "century low to an all-time high" is a classic sign of a paradigm shift.
- China's Demand Dominance: China consumes 47% of the world's iron ore, and its industrialization process directly drives demand. The Glencore CEO's statement ("First, take the easy stuff from Australia, the US, South America; now we go to the Congo and Zambia") confirms that the mining industry has entered a "high-risk, high-cost" phase.
3. Agricultural Resources: Slowing Productivity Growth and the Vicious Cycle of Fertilizer Dependence
- Declining Yield Growth: Exhibit 10 shows that the average annual growth rate of global crop yields fell from 3.5% in the late 1960s to 1.25% in the 2000s, while population growth remained around 1.0%. The gap between the two has narrowed to 0.25 percentage points, leaving a very low safety margin.
- Diminishing Marginal Returns on Fertilizer Input: Exhibit 11 indicates that fertilizer use per square kilometer of arable land increased fivefold from 1961 to 2006, yet yield growth actually declined. This aligns with the "law of diminishing returns"—the additional yield from extra fertilizer is getting weaker, and the raw materials for fertilizers like phosphorus and potassium are themselves finite resources.
- Energy-Agriculture Coupling Risk: Agriculture is highly dependent on oil (for production, transport, irrigation), and oil has already entered a paradigm shift. For example, U.S. corn ethanol production not only consumes food but may have a negative net energy gain (requiring more fossil energy input), intensifying the competition between food and energy.
4. Key Comparison: Historical Position of Resource Prices and Future Risks
| Commodity | Historical Low (Year) | Recent High (Year) | Multiples Increase | Gap from Historical High |
|---|---|---|---|---|
| Iron Ore | ~$30/ton (2002) | ~$200/ton (2011) | 6.7x | Near historical high |
| Copper | ~$1,500/ton (2002) | ~$10,000/ton (2011) | 6.7x | Near historical high |
| Wheat | ~$3/bushel (2000) | ~$9/bushel (2008) | 3x | Still below historical high (1970s $12) |
| Corn | ~$2/bushel (2000) | ~$7/bushel (2011) | 3.5x | Still below historical high (1970s $8) |
Conclusion: Metals are near or have broken historical highs, while agricultural products, though doubling from lows, are still below their 1970s peaks, suggesting further upside potential. However, all commodities exhibit a pattern of "rising lows and increasing volatility," consistent with the typical model of a paradigm shift.
5. The Hidden Crisis of Water Resources and Soil Erosion
- Groundwater Depletion: In major global agricultural regions (e.g., India, California, USA), groundwater extraction far exceeds recharge, leading to rising irrigation costs and declining yields.
- Soil Loss: Conventional farming causes topsoil loss at a rate 10-40 times faster than natural formation, threatening long-term arable land productivity.
- Policy Lag: The author emphasizes that resource crises require long-term planning that transcends corporate profit cycles (quarterly/annual) and political terms (4-5 years), but current mechanisms lack incentives. For example, no-till farming can reduce soil erosion and energy consumption, but its adoption is slow.
6. Statistical Significance of the Paradigm Shift
- The author notes that metal and agricultural prices have broken the "1-in-44-year" statistical threshold (i.e., a once-in-44-year event), implying the failure of traditional mean-reversion models. For example, copper prices rose over 6-fold between 2000 and 2011, while the historical standard deviation model predicted an extreme probability of less than 2%. This reinforces the judgment of a "structural shift rather than cyclical fluctuation."
Summary: The resource paradigm shift is not driven by a single factor but is the result of a confluence of demand explosion (China), rising supply costs (declining grades, higher energy prices), productivity bottlenecks (slowing agricultural growth), and institutional inertia (financial industry conflicts of interest, policy short-sightedness). Data suggests this shift is broad (covering energy, metals, agriculture) and persistent (reversing a century-long trend). Investors must abandon the belief in mean reversion and adapt to a new normal of "high costs, high risks, and high volatility."
The Dual Risks of Weather and China: Investment Tensions in a Paradigm Shift
The Uniqueness and Unsustainability of the Weather Shock
The author emphasizes that the extreme weather of the past 12 months was a once-in-a-century agricultural disaster, but this factor is highly unsustainable. Data shows that major global agricultural regions (e.g., eastern Australia) experienced extreme fluctuations in "seven-year average rainfall"—record drought for the first six years, followed by unprecedented floods in the seventh. This "average" masks the violent oscillation in agricultural production. However, the consensus in climate science points out that the core feature of global warming is climate instability, not linear deterioration. Therefore, the probability of weather improvement in the coming year is very high (the author estimates 80%), which would directly lead to a significant drop in agricultural prices.
| Factor | Impact on Prices | Probability Assessment |
|---|---|---|
| Weather Improvement (Normal Rainfall) | Prices fall sharply, inventory rebuilds | 80% |
| China's Economic Growth Slows | Demand shrinks, prices under pressure | 25% |
| Both Occur Simultaneously | Market crash, similar to the 2008 Financial Crisis | ~20% |
The "Derailment" Risk of China's Structural Imbalances
Citing Jim Chanos, the author believes China will experience at least one economic "derailment" in the next 12 months. Specific risks include:
- Soaring Wages: Weakening export competitiveness and squeezing manufacturing profits.
- Excessively High Capital Expenditure Share: 50% of GDP is used for investment, a large portion of which may be wasteful (e.g., empty high-speed rail stations, ghost cities).
- Debt Expansion: Credit growth far exceeds GDP growth, with the scale of non-performing loans unknown but massive.
- Real Estate Bubble: Housing prices have entered a typical bubble territory, and loan quality is concerning.
China's influence on commodities is decisive: China accounts for a very high share of global new demand (e.g., iron ore, copper, soybeans). Once China's economy "sneezes," commodity prices will fall sharply. The author believes this risk probability is at least 25%, with some colleagues estimating it to be higher.
The "Creative Tension" Between Paradigm Shift and Short-Term Fluctuations
The author's core argument is: although there are dual downside risks from weather improvement and a China slowdown in the short term, the long-term paradigm shift (resource scarcity, structural demand growth) has not changed. He quotes his own quarterly letter from July 2008: "All raw material prices will be priced for what they are—irreplaceable." This judgment was validated after the 2008 financial crisis (commodity prices plummeted then quickly rebounded). Therefore, if the weather and China risks erupt simultaneously, it will create a second "once-in-a-lifetime" investment opportunity in three years—similar to the major bottom after the 2008 financial tsunami.
The Secondary Role of Speculation and Interest Rates
The author argues that traditional speculation (e.g., in storable commodities like gold) and low interest rates have a limited impact on price increases, accounting for only a "small part" of the overall pressure. The real drivers are:
1. Weather Shock (largest short-term variable)
2. Paradigm Shift (long-term structural factor)
3. China Demand (medium-term key variable)
Speculative money is more reflected in the rise of the forward futures curve than in spot prices. This paradoxically lowers the cost for farmers to hedge risk, encouraging them to expand planting, which may ultimately depress spot prices—creating a paradox where "speculation promotes production, and production lowers prices."
Investment Implications: Positioning During Panic
The author advises investors to:
- Be cautious in the short term: If weather improves or China's economy slows, commodity prices could plummet 30-50%.
- Be steadfast in the long term: The paradigm shift is irreversible, and resource scarcity will push the price center higher.
- Choose a strategy: Buy counter-cyclically during crashes, rather than following the "business as usual" optimistic narrative.
> "If the weather and the China syndrome hit simultaneously, it will almost certainly break the entire commodity market—just like the financial tsunami. That would be the second 'once-in-a-lifetime' opportunity in three years."
This judgment is highly consistent with market performance after 2008: commodity prices bottomed in early 2009 and rebounded sharply in 2010-2011. The author implies that current high prices are not a bubble but an early signal of long-term scarcity, and short-term pullbacks are opportunities to position.
New Analysis: Global Divergence and Investment Strategies Under Resource Constraints
1. The "Winners and Losers" Pattern from Rising Resource Prices
Jeremy Grantham further details the economic divergence under resource constraints: Resource owners (e.g., holders of land, fertilizers, water, oil and gas reserves) become winners, while everyone else faces a loss of welfare. This judgment is based on the following data and logic:
- Soaring Land Values: High-quality agricultural land prices rise due to supply rigidity (limited global arable land) and demand growth (population and biofuel demand). Grantham notes that agricultural technological progress (e.g., GMOs) will further push up land values because technology increases unit output, but land supply remains fixed, causing land rents to rise.
- Fertilizer Resource Scarcity: Potash and phosphorus, as core inputs for food production, have very low price elasticity. According to the International Fertilizer Association (IFA), global potash production capacity is highly concentrated (Canada, Russia, and Belarus account for over 70% of global production). Supply monopoly combined with rigid demand makes it a "hard currency" in the era of resource constraints.
- Water Pricing Power: Grantham particularly emphasizes the strategic value of water. Approximately 2 billion people globally face severe water scarcity, and agriculture accounts for 70% of global freshwater consumption. As climate change exacerbates droughts, prices in water rights trading markets (e.g., the Murray-Darling Basin in Australia) have risen several times and may become a new asset class in the future.
Comparative Data: Welfare Changes for Resource Owners vs. Ordinary Consumers
| Group | Impact of Rising Resource Prices | Typical Performance |
|---|---|---|
| Land/Resource Owners | Asset appreciation, increased rental income | U.S. Midwest farmland prices rose ~50% from 2010-2020 |
| Ordinary Consumers | Decline in real purchasing power, rising cost of living | Global food price index rose 25% year-on-year in 2010 |
| Poor Population in Developing Countries | Over 50% of income spent on food and energy, suffering the greatest impact | World Bank estimates 44 million more people in extreme poverty in 2010-2011 |
2. The Misleading Nature of "Sunk Costs" and GDP Accounting
Grantham raises a key criticism: Traditional GDP accounting cannot distinguish between "value creation" and "cost shifting." He uses the Canadian Tar Sands as an example:
- Cost Comparison: The extraction cost of cheap Saudi Arabian oil is about $5/barrel, while the extraction cost of Canadian oil sands is as high as $120/barrel (including energy consumption, environmental remediation, etc.). This $115 difference is pure "deadweight loss" , which does not increase total social welfare but merely transfers resources from consumers to producers and environmental remediation.
- GDP Illusion: Oil sands extraction creates more jobs (e.g., drilling, transport, refining), but the "incremental value" of these jobs is far lower than in the era of cheap oil. Grantham sarcastically notes: "It's like thousands of people digging a hole with teaspoons. While it increases employment, it creates no extra value compared to the original cheap oil." This view aligns with the "Resource Curse" theory: high-cost resource development often leads to economic inefficiency rather than growth.
3. Investment Strategy: From "Profit Maximization" to "Regret Minimization"
Grantham proposes a counter-intuitive investment framework: In a highly uncertain environment, investors should prioritize "avoiding regret" over "pursuing returns." His specific operations include:
- Phased Position Building: Buying "underground resources" (e.g., commodities, mining stocks) and resource efficiency-related assets (e.g., energy-saving technologies, renewable energy) at "one-quarter of the target position." This strategy avoids being completely left behind (if resource prices continue to rise) while retaining cash to cope with pullbacks.
- Counter-Cyclical Adding: If resource prices fall sharply (which Grantham considers more likely), he plans to "grit his teeth and triple or quadruple the position," holding for the long term. This is essentially a variant of "value investing": buying undervalued hard assets during panic.
- Psychological Anchoring: Grantham admits that the "precise answer" for this strategy is "very difficult" (with great difficulty), but emphasizes that "regret minimization" is more aligned with long-term rationality than "return maximization." For example, if he misses an upside due to not holding resources, he would "jump off the bus" (a metaphor for extreme regret); whereas if he suffers short-term losses from buying too early, he can "endure the pain and add to the position."
4. America's Structural Advantages: Resource Endowment and Waste Dividend
Grantham believes the U.S. has unique advantages in the era of resource constraints, specifically:
- Resource Endowment: The U.S. has some of the world's best agricultural land (Midwest black soil belt) and relatively abundant water resources (Great Lakes, Mississippi River basin), while its shale oil and gas reserves have been significantly boosted by hydraulic fracturing (fracking). Data from the U.S. Energy Information Administration (EIA) shows that in 2010, U.S. shale gas production accounted for 23% of total natural gas production, a 10-fold increase from 2000.
- Waste Dividend: The U.S. is the "most profligate developed country," which ironically becomes an advantage—by reducing waste (e.g., improving energy efficiency, optimizing building insulation), the U.S. can "save tens of billions of dollars and ultimately feel better." Grantham uses the analogy of "an obese person successfully dieting": for every 1% improvement in U.S. energy efficiency, about $50 billion can be saved (based on 2010 energy prices), while also reducing carbon emissions.
- Growth Forecast: Grantham expects U.S. GDP growth to potentially slow to 1.5%-2% over the next 20 years, but this is not a disaster. He cites historical data: over the past 28 years (1983-2011), U.S. GDP grew at an average annual rate of 3.0%, while energy demand grew only 0.9% (energy efficiency improved by 2.1%). If GDP growth falls to 2%, energy demand could be zero or even negative.
5. Global Divergence: Resource Efficiency and Terms of Trade
Grantham divides global countries into three categories and predicts their different fates:
| Country Type | Typical Representative | Performance Under Resource Constraints | Key Indicator |
|---|---|---|---|
| Resource-Rich and Efficient | USA, Canada, Australia | Improved terms of trade (rising export resource prices), GDP growth above global average | Energy efficiency (GDP/unit energy) 2-3 times higher than China |
| Resource-Poor but Efficient | Japan, Germany | Offset rising resource prices through energy efficiency, relatively favorable terms of trade | Japan's GDP per unit of energy is more than double that of China |
| Resource-Poor and Inefficient | India, Sub-Saharan Africa | Over 50% of income spent on food and energy, suffering the greatest impact, potentially triggering famine and instability | Food expenditure as a share of household income exceeds 40% |
Grantham specifically points out an "ironic" phenomenon: Countries that consume the fewest resources (e.g., poor African nations) suffer the most. This is because the "win-win" logic of global trade fails under resource constraints: the faster emerging economies like China grow (especially with increased meat consumption), the higher commodity prices rise, squeezing poorer countries harder. He warns: "If we want to avoid famine and international instability, we will need global ingenuity and generosity on a scale never before seen."
6. Conclusion: The Urgency of Long-Term Resource Planning
Grantham concludes with a call to action: The U.S. and all countries need to immediately formulate long-term resource plans, especially an energy strategy. He implies that short-term market fluctuations (like the 2011 commodity price pullback) should not distract from long-term positioning. This conclusion is consistent with his "regret minimization" investment strategy: in uncertainty, acting early (e.g., investing in resource efficiency, stockpiling key resources) is wiser than waiting for the "perfect moment."
Note: This analysis is based on 2011 data, but Grantham's framework (resource constraints, efficiency divergence, investment psychology) remains relevant for the current (2025) energy transition, food security, and geopolitical conflicts. For example, the surge in fertilizer prices after the 2022 Russia-Ukraine conflict once again validated the logic of "resource owners benefiting."