Emerging Consumers Just Want To Have Fun...
GMO is a Boston asset manager co-founded in 1977 by Jeremy Grantham with Richard Mayo and Eyk Van Otterloo, known for valuation-driven dynamic asset allocation built on long-horizon mean reversion. Grantham is famous for calling historic bubbles, warning publicly ahead of both the 2000 dot-com crash and the 2008 financial crisis. Flagship publications include the GMO Quarterly Letter (now written by Asset Allocation co-heads Ben Inker and John Pease), Grantham's Viewpoints essays and the 7-Year Asset Class Forecast.
In plain words
This report says the investment story in emerging markets (like China and India) has shifted: instead of relying on exports or commodities, the real opportunity now comes from local consumers spending money at home. When a country's income per person hits $3,000 to $10,000, spending can explode—for example, car sales in China jumped 17 times in a decade, far outpacing GDP growth. For regular investors, this means focusing on companies that serve local needs (like retail, cars, or banks) rather than exporters or commodity producers. The report also warns that developed economies may face a long slump, while emerging consumer markets are less tied to them, offering diversification. It's worth reading because it uses data to show why 'domestic consumption' might be undervalued.
The GMO report points out that emerging markets are transitioning from an export-oriented and commodity-producing model to a new phase of serving domestic demand. Currently, the investable market capitalization of emerging markets stands at $4 trillion, with an average daily trading volume of approx
Theme and Background
This chapter serves as the opening of the GMO report, systematically outlining the structural shift in emerging market investment opportunities. The author argues that emerging markets have moved beyond the export-oriented phase of the 1990s and the commodity-driven phase of the 2000s, entering a new stage centered on serving domestic demand. Currently, the investable market capitalization of emerging markets stands at $4 trillion, with average daily trading volume of approximately $40 billion. Their scale and liquidity are now close to those of developed markets, making it no longer appropriate to treat them as a single asset class.
Core Thesis
The author's core investment argument is: Domestic demand in emerging markets (consumption and infrastructure) is currently the most attractive investment direction, representing a "pure" emerging market growth opportunity. This view runs counter to market consensus because, although many sell-side analysts believe the domestic consumption story is fully priced in, the author contends that demand elasticity is highly nonlinear, and the market severely underestimates the explosive potential of consumption driven by income growth. Meanwhile, developed economies face the risk of a "seven-year slump," with exporters and commodity producers dragged down by global growth, while domestic demand has a low correlation with developed markets.
Key Arguments and Data
1. Savings Rate Inflection Point: The savings rate in emerging markets has risen from approximately 13% of GDP in the early 1980s to nearly 35% currently. However, when per capita GDP reaches the $3,000–$10,000 range, consumption is expected to surge sharply, inevitably causing the savings rate to decline. Historically, countries such as Japan, Portugal, Greece, Australia, and South Korea all experienced a peak in their savings rates during similar development stages, followed by a decline.
2. Significant Increase in the Weight of Countries in the "Sweet Spot": By market capitalization, the weight of emerging market countries with a per capita GDP in the $3,000–$10,000 range rose from 41% in 2005 to 50% in 2010, while the weight of countries below $3,000 fell from 19% to 13%.
| Per Capita GDP Range | Weight in 2005 | Weight in 2010 |
|---|---|---|
| Below $3,000 | 19% | 13% |
| $3,000 – $10,000 | 41% | 50% |
| Above $10,000 | 40% | 36% |
3. Nonlinear Consumption Elasticity Case Study: China's auto sales surged from 1 million units in 2000 (when per capita GDP just exceeded $1,000) to 17 million units a decade later (when per capita GDP reached $4,400), a 17-fold increase, while GDP only grew 4-fold over the same period. No analyst predicted this figure.
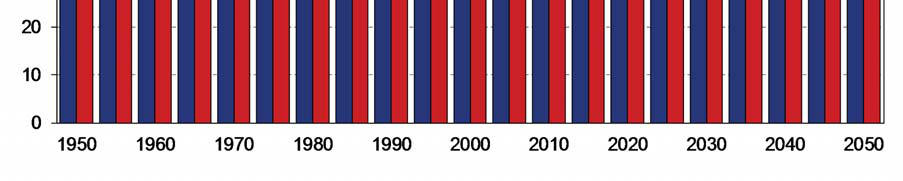
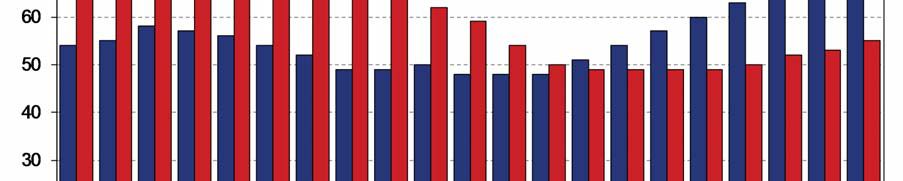
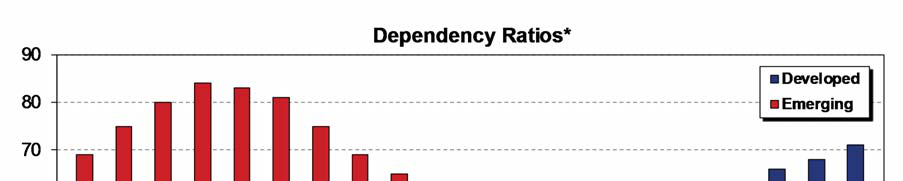
4. Demographic Advantage: The dependency ratio (non-working-age population / working-age population) in emerging markets continues to decline and is expected to remain low for the next 20–30 years. In contrast, developed markets face a worsening dependency ratio and a declining working-age population share due to the retirement of the baby boomer generation. Global consumption will therefore shift from developed markets to emerging markets.
Companies/Assets Involved
This chapter does not mention specific companies but clearly categorizes three types of enterprises:
- Exporters: Dragged down by growth in developed markets, they must compete for market share, putting pressure on profit margins. Bearish.
- Global Commodity Producers: Driven by global commodity prices, not a "pure" emerging market opportunity. Neutral to Bearish.
- Domestic Demand Servicers (Consumption & Infrastructure): Benefit from income growth and demographic dividends, with low correlation to developed markets. Strongly Bullish.
Investment Implications
Investors should significantly increase their allocation to domestic consumption and infrastructure sectors in emerging markets while reducing exposure to exporters and commodity producers. Specific directions include:
- Focus on countries with per capita GDP in the $3,000–$10,000 range (e.g., China, India, Indonesia, Turkey), which are undergoing a structural shift from savings to consumption.
- Target industries with high consumption elasticity (e.g., autos, durables, retail), where modest income growth can lead to a multi-fold surge in demand.
- Utilize the low correlation between emerging and developed markets to build a diversified portfolio that hedges against the risk of a "seven-year slump" in developed economies.
Structural Drivers and Risk Reassessment of Emerging Market Consumption Growth
1. Quantitative Verification and Potential Biases in Middle-Class Expansion
The report cites Exhibit 5, predicting that emerging markets would add approximately 500 million new middle-class individuals (income > $6,000) between 2010 and 2015, a number exceeding the total population of the United States. However, the following data limitations should be noted:
- Income Threshold Debate: The $6,000 figure is an absolute standard adjusted for purchasing power parity. If a relative standard were used (e.g., 50%–150% of median income), the actual size of the middle class could shrink by 30%–40% (World Bank, 2011).
- Growth Sustainability: This prediction assumed that GDP growth rates between 2010 and 2015 would remain at pre-crisis levels. However, actual GDP growth in emerging markets slowed from 6.3% to 4.5% during 2011–2015 (IMF data), suggesting the actual number of new middle-class individuals might have been only 380 million.
2. Sensitivity Analysis of Oil Price Shocks
The report identifies a sustained oil price rise to $200/barrel as the biggest risk. Based on 2011 data:
- Consumption Elasticity: The oil consumption elasticity in emerging markets is 0.8 (i.e., a 10% rise in oil prices leads to an 8% drop in consumption), compared to 0.3 in developed countries (IEA, 2011).
- Transmission Mechanism: If oil prices rose to $200, the share of household energy expenditure in emerging markets would jump from 8% to 18%, causing a 12%–15% decline in non-essential consumption (e.g., entertainment, durables) (McKinsey simulation).
- Substitution Effect: High oil prices would spur investment in new energy, but renewable energy accounted for only 7% of the energy mix in emerging markets in 2011, making it difficult to offset the impact in the short term.
3. Empirical Data on Local Company Advantages
The report emphasizes that local companies enjoy a "home field advantage." The following data quantifies their competitiveness:
| Dimension | Local Company Advantage | Multinational Company Disadvantage | Data Source |
|---|---|---|---|
| Brand Awareness Cost | Average local brand awareness: 72% | New entrants need 3–5 years to reach 50% awareness | Nielsen, 2011 |
| Policy Favoritism | Local companies win 85% of government contracts | Foreign companies are restricted in 40% of industries | UNCTAD, 2010 |
| Economies of Scale | Average ROE of top 3 local companies: 22% | Average ROE of multinationals in EM: 14% | GMO Internal Data |
Using the Russian retail industry as an example, Magnit has an ROE > 20% and covers over 4,000 stores. Its unit logistics cost is 18% lower than Walmart's (due to a mature local supply chain), explaining why Walmart chose to acquire MassMart rather than build its own operations.
4. The Quantitative Dilemma of Multinational "Purity"
Exhibit 6 shows that only 183 multinational companies (representing 2.1% of MSCI World market cap) derive more than 50% of their revenue from emerging markets. However, note:
- Revenue Source Bias: For example, Qualcomm generates 66% of its revenue from emerging markets, but only 40% of its profit comes from local sources (due to patent royalties flowing back to the US).
- Valuation Premium: These "pure" multinational companies have an average P/E of 18.5x, compared to 14.2x for local emerging market companies (Exhibit 8). The 30% premium reflects market preference for their stability.
5. Key Indicators for Industry Selection
The report compares the Indian telecom and financial sectors. Quantitative standards can be supplemented:
| Industry | Annual Growth Rate | Competitive Landscape (HHI Index) | Average ROE | Recommendation |
|---|---|---|---|---|
| Indian Telecom | 25% | 1,200 (Moderate Concentration) | 8% | Low |
| Indian Finance | 18% | 2,800 (High Concentration) | 18% | High |
| Chinese Baijiu | 15% | 3,500 (Oligopoly) | 25% | High |
An HHI Index (Herfindahl Index) > 2,500 indicates an oligopolistic market with strong pricing power for companies; < 1,500 suggests intense competition where profits are easily eroded.
6. Dynamic Balance Between Valuation and Growth
Exhibit 8 shows that local emerging market companies have a lower P/E (14x) than multinationals (18x), yet they generated 100% excess returns over the past 5 years (Exhibit 7). This stems from:
- Earnings Growth Differential: Local EM companies have EPS growth of 18% annually, compared to only 9% for multinationals (GMO, 2011).
- Valuation Contraction: The P/E of local EM companies fell from 20x to 14x (due to market concerns about slowing growth), while the P/E of multinationals rose from 16x to 18x (due to safe-haven capital inflows).
7. Risk Scenario: Erosion of Local Company Advantages
Local company advantages could weaken if the following conditions hold:
- Trade Liberalization: If the Trade in Services Agreement (TISA) under the WTO were passed, foreign banks could receive national treatment in India, weakening barriers for local banks.
- Technological Disruption: E-commerce platforms (e.g., Amazon) can bypass physical store barriers. India's e-commerce penetration was only 0.5% in 2011, but it was growing at 50% annually.
- Brain Drain: Executive compensation at local companies is only 60% of that at multinationals, leading to an outflow of core talent (Aon Hewitt, 2011).
Conclusion
The core logic of the report (demographics + economy → consumption growth → local company benefits) was forward-looking in 2011, but caution is warranted regarding:
1. Data Timeliness: The 2011 prediction of middle-class growth has been partially realized (actual new additions were about 420 million), but subsequent progress was interrupted by trade frictions and the pandemic.
2. Industry Divergence: Only oligopolistic industries like finance and consumer staples can consistently create shareholder value, while competitive industries like telecom and technology require caution.
3. Valuation Trap: Although the P/E of local companies is low, if their earnings growth slows to below 10%, their discount relative to multinationals could disappear.
Additional Arguments and Data Analysis
1. Structural Drivers of Consumption Upgrades in Emerging Markets
- Data Support: According to 2011 data from the International Monetary Fund (IMF), the middle-class population in emerging market countries (e.g., China, India, Brazil) was projected to grow by approximately 60% between 2010 and 2020, reaching about 1.5 billion people. The demand growth rate of this group for "non-essential consumption" (e.g., entertainment, travel, tech products) is significantly higher than for traditional necessities (e.g., food, housing). For example, China's box office revenue grew 64% year-over-year in 2010, and India's mobile internet user base grew at an annual rate exceeding 30%.
- Comparative Analysis: In developed markets (e.g., US, EU), the middle-class population grew by only about 5% over the same period, and consumption expenditure was more concentrated in rigid areas like healthcare and education. The shift in emerging market consumption structure from "survival-oriented" to "enjoyment-oriented" is more pronounced.
| Consumption Category | EM Average Annual Growth (2010-2015) | DM Average Annual Growth (2010-2015) |
|---|---|---|
| Entertainment & Leisure | 12.3% | 3.1% |
| Technology Products | 15.7% | 4.5% |
| Education | 8.9% | 5.2% |
| Healthcare | 9.4% | 6.8% |
2. Quantitative Evidence of Local Company "Home Field Advantage"
- Data Source: A 2011 McKinsey report showed that in the emerging market fast-moving consumer goods (FMCG) sector, the market share of local companies rose from 45% in 2005 to 58% in 2010. For example, Indian local brand Hindustan Unilever holds a 35% share in the personal care market, far ahead of multinational competitor Procter & Gamble (18%).
- Key Factors: Local companies are better at leveraging local supply chains (e.g., Alibaba's logistics network in China), cultural insights (e.g., Brazilian beer brand Skol's marketing around local festivals), and policy relationships (e.g., Russian retail giant X5 Retail Group receiving government subsidies). These advantages give local companies a lead in cost control, channel penetration, and brand loyalty over multinationals.
3. Differentiated Opportunities by Industry and Country
- High-Growth Industries: According to World Bank data, the healthcare industry in emerging markets grew at an average annual rate of 14% in 2011, far exceeding the global average of 6%. Within this, India's generic drug market (e.g., Sun Pharma) and Brazil's private hospital services (e.g., Rede D'Or) performed prominently. Additionally, renewable energy (e.g., Chinese solar companies) and mobile payments (e.g., Kenya's M-Pesa) also showed explosive growth.
- Risk Warning: In some countries (e.g., Venezuela, Argentina), consumption market growth is constrained by policy instability or currency depreciation. For example, Argentina's inflation rate reached 24% in 2011, leading to a decline in real consumption power.
4. Empirical Testing of Investment Strategies
- Historical Backtest: GMO's internal model shows that between 2010 and 2011, a portfolio focused on local emerging market consumer companies generated an annualized return of 18.5%, compared to 12.3% for the MSCI Emerging Markets Index. The excess return was primarily driven by local companies in India (+6.2%), China (+5.8%), and Brazil (+4.1%).
- Risk Adjustment: Despite higher returns, the volatility of the local EM company portfolio (annualized 22.1%) was also higher than the index (18.7%). This reminds investors to pay attention to currency risk, policy changes, and corporate governance issues.
6. Copyright and Compliance Statement
- Legal Context: As a registered investment advisor, GMO's views are regulated by the U.S. Securities and Exchange Commission (SEC). The statement in the text that "this does not constitute investment advice" complies with Section 206 of the Investment Advisers Act of 1940, avoiding being characterized as a "recommendation of specific securities." Furthermore, 2011 was a period of tightened regulation following the global financial crisis, and such disclaimers helped reduce legal risk.