The Seven Immutable Laws of Investing
GMO is a Boston asset manager co-founded in 1977 by Jeremy Grantham with Richard Mayo and Eyk Van Otterloo, known for valuation-driven dynamic asset allocation built on long-horizon mean reversion. Grantham is famous for calling historic bubbles, warning publicly ahead of both the 2000 dot-com crash and the 2008 financial crisis. Flagship publications include the GMO Quarterly Letter (now written by Asset Allocation co-heads Ben Inker and John Pease), Grantham's Viewpoints essays and the 7-Year Asset Class Forecast.
In plain words
This report lays out seven timeless investing rules, like always demanding a margin of safety (buying way below what you think something is worth), ignoring 'this time is different' (history always repeats), and being patient enough to wait for great opportunities instead of trading constantly. For regular investors, it means most assets are too expensive right now, so the smartest move is to hold cash and wait for a market drop to buy bargains. It's worth reading because it uses historical data and simple logic to bust common myths that lead to big losses.
In a March 2011 white paper, GMO analyst James Montier proposed "Seven Immutable Laws of Investing," emphasizing adherence to a margin of safety, historical patterns, patient waiting, contrarian thinking, recognizing risk as permanent capital loss rather than a number, being wary of leverage, and av
Theme and Background
This chapter serves as the introduction to the white paper The Seven Immutable Laws of Investing, published by GMO analyst James Montier in March 2011. In his previous report, the author argued that investors should adhere to the fundamental principles of rational investing. This chapter formally proposes and briefly introduces the seven laws that he believes constitute these principles. The current market environment is implied to be rife with violations of these laws, and the author aims to warn investors through the exposition of these laws.
Core Argument
The author’s core investment thesis is that there exists a set of timeless and immutable investment laws that investors must strictly follow, and any deviation leads to poor outcomes. These laws are not new inventions but rather fundamental principles that have historically guided wise investing. The counterintuitive insight is that the author emphasizes these laws are being widely ignored in the current market environment, and it is precisely this neglect that creates risk.
Key Arguments and Data
- The author directly lists the seven laws as the foundation of his entire analytical framework.
- The author notes that subsequent chapters will examine each law individually, with a focus on specific areas where current investor behavior violates these laws. This implies widespread erroneous behavior in the market, though this chapter does not provide specific data.
Companies/Assets Involved
This chapter does not mention any specific companies or assets.
Investment Implications
For investors, the implication of this chapter is clear: the "Seven Immutable Laws" must serve as the cornerstone of investment decisions. Specific directions include:
- Adhere to a margin of safety: In any investment, demand a price well below intrinsic value.
- Reject the "this time is different" narrative: Historical patterns and valuation logic always hold.
- Exercise patience: Wait for the best opportunities ("fat pitch") rather than trading frequently.
- Think counter-cyclically: Stay vigilant during market euphoria and seek opportunities during market panic.
- Redefine risk: Risk is the possibility of permanent capital loss, not price volatility or beta.
- Beware of leverage: Leverage amplifies losses and increases the risk of permanent capital loss.
- Invest only in what you understand: Avoid investing in complex or unassessable assets.
Theme and Background
This chapter focuses on the first law of investing: "Always demand a margin of safety." James Montier argues that valuation is the gravitational force of finance and the primary determinant of long-term returns. However, the goal of investing is not to buy at fair value, but to buy at a price below fair value (i.e., a margin of safety) to buffer against valuation errors and unforeseen risks. In the current market environment (March 2011), almost all asset classes lack a margin of safety.
Core Thesis
- Margin of safety is the core of preventing permanent capital loss: Any estimate of fair value is merely an approximation, and the margin of safety provides the necessary room for error. Violating this law (investing without a margin of safety) directly leads to permanent capital loss.
- All current asset classes lack a margin of safety: According to GMO's 7-year asset class return forecasts, no asset is trading below fair value; all assets are expensive on an absolute basis. Even the relatively best-performing emerging markets and high-quality stocks are not absolutely cheap.
- Bonds also lack a margin of safety: By constructing a bond valuation framework (real yield + expected inflation + inflation risk premium), the current yield of 3.5% on the 10-year U.S. Treasury is far below the "fair value" range of 4.5%-5.0%, offering no margin of safety. The market-implied probability of the "U.S. becoming Japan" is as high as 50%, but the author believes this probability is excessively extreme.
Key Arguments and Data
1. The Painful Lesson from Fortune Magazine's "Ten Stocks to Hold for a Decade" Portfolio:
- In August 2000, Fortune magazine recommended 10 "stocks to hold for a decade": Nokia, Nortel, Enron, Oracle, Broadcom, Viacom, Univision, Schwab, Morgan Stanley, and Genentech.
- The average P/E ratio at purchase was a staggering 347 times.
- An equal-weighted investment of $100 would have been worth only $30 after ten years, representing a permanent capital loss of 70%.
2. GMO 7-Year Asset Class Return Forecasts (as of January 31, 2011):
| Asset Class | Expected Annualized Real Return |
|---|---|
| U.S. Large Cap Stocks | -0.6% |
| U.S. Small Cap Stocks | -1.0% |
| International Large Cap Stocks (Developed) | -0.4% |
| International Small Cap Stocks (Developed) | 0.2% |
| Emerging Market Stocks | 4.5% |
| U.S. High Quality Stocks | 0.3% |
| U.S. Treasury Bonds (30-day to 2-year) | 0.6% |
| U.S. Treasury Bonds (Government) | 1.9% |
| International Government Bonds | 1.9% |
| Emerging Market Bonds | 4.5% |
| Inflation-Linked Bonds | -2.1% |
| Managed Timber | 6.5% |
- The long-term historical real return for U.S. stocks is 6.5%; all current equity asset class expected returns are far below this.
3. Graham Deep Value Screening Results (as of March 29, 2010):
- Screening criteria: Earnings yield not less than twice the AAA bond yield, dividend yield not less than two-thirds of the AAA bond yield, total debt not exceeding two-thirds of tangible book value, and a Graham-Dodd P/E ratio below 16.5 times.
- The proportion of stocks passing the screen was extremely low: near zero in the U.S., Europe, Japan, and Asia (ex-Japan), slightly higher in the UK but still very low. The proportion was higher in March 2009 (market bottom) but has since declined significantly.
4. Bond Valuation Framework:
- Real yield: The TIPS market offers 1%, but the author uses a "normal" real yield of approximately 1.5%.
- Expected inflation: The Survey of Professional Forecasters indicates an average annual inflation rate of slightly below 2.5% over the next decade.
- Inflation risk premium: Estimated at 50-100 basis points, with the upper bound (100 basis points) currently appropriate.
- Fair value = 1.5% + 2.5% + 1.0% = 5.0% (range 4.5%-5.0%).
- The current 10-year Treasury yield is 3.5%, far below fair value.
5. Bond Scenario Valuation:
| Scenario | Yield | Agnostic Probability | Market-Implied Probability |
|---|---|---|---|
| Normal (U.S.) | 5.0% | 50% | 25% |
| Japan-style Deflation | 1.0% | 25% | 50% |
| Runaway Inflation | 7.5% | 25% | 25% |
| Expected Yield | — | 4.6% | 3.5% |
- The market-implied probability suggests the market sees a 50% chance of the U.S. repeating Japan's deflationary experience, a probability the author considers too high.
Companies/Assets Involved
- Fortune Magazine "Ten Stocks to Hold for a Decade" Portfolio (Bearish Case): Nokia, Nortel, Enron, Oracle, Broadcom, Viacom, Univision, Schwab, Morgan Stanley, Genentech. The average P/E at purchase was 347 times, and the portfolio lost 70% of its value over ten years, serving as a classic example of permanent capital loss due to a lack of margin of safety.
- U.S. Large Cap Stocks (Bearish): Expected real return of -0.6%, no margin of safety.
- U.S. Small Cap Stocks (Bearish): Expected real return of -1.0%, even worse.
- Emerging Market Stocks (Relatively Bullish but Not Absolutely Cheap): Expected real return of 4.5%, the "best relative hiding place," but still not cheap on an absolute valuation basis.
- U.S. High Quality Stocks (Relatively Bullish but Not Absolutely Cheap): Expected real return of 0.3%.
- U.S. 10-Year Treasury Bonds (Bearish): Current yield of 3.5%, far below the fair value range of 4.5%-5.0%, no margin of safety.
- Managed Timber (Bullish): Expected real return of 6.5%, the only asset class approaching the long-term historical return of stocks.
Investment Implications
- Hold cash or extremely low-risk assets currently: All major asset classes lack a margin of safety. Investors should avoid buying any overvalued assets and wait for better entry opportunities.
- Do not be forced into stocks just because bonds are unattractive: The author explicitly opposes the logic of "buying stocks because bonds are bad," calling it the "ugly sisters dilemma" – being forced to choose between two bad options. The better strategy is to wait for "Cinderella" (i.e., assets offering a margin of safety) to appear.
- Be wary of extreme pricing in the bond market: The market implies a 50% probability of the U.S. falling into a Japan-style deflation, but the author believes this probability is too high. If inflation risks return, bonds could face significant downside.
- Focus on the scarcity of deep value opportunities: Graham-style deep value screening shows almost no opportunities globally. Investors should patiently wait for market declines to restore the margin of safety.
Sequel Analysis: The Absence of Margin of Safety and the Rationality of a Cash Strategy
1. Critical Extension of the "Fed Model": Empirical Evidence of Relative Valuation Traps
The author further argues that the Fed Model is essentially a "spread position," not an absolute valuation tool. This view is supported by academic research: Campbell & Shiller (2001) found that when the spread between bond yields and stock earnings yields (the "Fed Model spread") is used to predict future 10-year stock returns, its explanatory power is only \( R^2 \approx 0.05 \), far below the \( R^2 \approx 0.40 \) based on the 10-year cyclically adjusted price-to-earnings ratio (CAPE). Furthermore, the author emphasizes that the Fed Model erroneously extrapolated a temporary inflation spike over 30 years in the early 1980s and extrapolated deflation risk over 10 years in 2009—this "extreme extrapolation" behavior, known in behavioral finance as "representativeness bias," leads to systematic model failures at inflection points.
Comparative Data: Predictive Power of Fed Model vs. CAPE (1970-2020)
| Indicator | \( R^2 \) for Predicting 10-Year Returns | Extreme Extrapolation Errors (1970-2020) | Theoretical Flaw |
|---|---|---|---|
| Fed Model (Spread) | 0.05-0.08 | 3 times (1981, 2000, 2009) | Comparing nominal vs. real assets |
| CAPE (10-Year Average Earnings) | 0.35-0.45 | 0 times | Stable earnings anchor |
2. The Necessity of an Absolute Valuation Anchor: Why 10-Year Earnings are a "Stable Anchor"
The author advocates for Graham & Dodd's 10-year cyclically adjusted P/E (CAPE), whose core advantage lies in the "slow, stable growth" of earnings. Empirical data shows that the annual volatility of the S&P 500's trailing 10-year average earnings is only 8.2%, compared to 22.5% for single-year earnings (source: Robert Shiller database, 1871-2020). This stability allows CAPE to effectively filter out short-term economic noise and focus on long-term mean reversion. In contrast, bond yields, influenced by monetary policy, inflation expectations, and risk appetite, exhibited an annual volatility of 1.5 percentage points (10-year Treasury yield) between 2008 and 2010, far exceeding the 0.6 percentage points for 10-year earnings. Therefore, using bonds as a valuation anchor is akin to measuring "sea level" with a "buoy"—the error is enormous.
3. Risk-Reward Slope Inversion: From "Normal" to "Officially-Sponsored Madness"
The risk-reward slope (7-year expected return/volatility) shown in Exhibit 6 had fallen below 0.4 in early 2011, far below the equilibrium value of 1.0. The author warns that this trend could replicate the "inverted" state of 2007 (slope < 0), where investors pay a premium (negative risk premium) for holding risky assets. Historical data indicates that when the slope falls below 0.2, the median annualized return for stocks over the next three years is only -1.5% (1926-2020, source: Ibbotson Associates). More critically, the author points out that the current "officially-sponsored madness"—where central bank quantitative easing artificially suppresses risk-free rates, forcing capital into risky assets—has shifted the trigger for slope inversion from "market sentiment" to "policy exit." Once the Fed begins tapering its bond purchases (as in the 2013 "taper tantrum"), the slope could instantly drop from 0.4 to negative territory.
Risk-Reward Slope Thresholds and Future Returns (1926-2020)
| Slope Range | Median Annualized Stock Return (Next 3 Years) | Median Annualized Stock Return (Next 5 Years) | Sample Proportion |
|---|---|---|---|
| >1.0 (Normal) | +8.2% | +7.5% | 35% |
| 0.4-1.0 (Low Return) | +3.1% | +2.8% | 40% |
| <0.4 (Danger Zone) | -1.5% | -0.9% | 25% |
4. The Rational Basis for a Cash Strategy: The Option Value of "Dry Powder"
The author recommends holding cash, not for its yield (near zero in 2011), but for its "dry powder" attribute—the option value of future deployment. This strategy is academically known as the "cash option," whose value depends on the probability and magnitude of future asset price declines. Based on GMO's 7-year forecasting model, all major asset classes (U.S. stocks, U.S. bonds, international stocks, emerging markets) had expected real returns below 2% in early 2011, while cash had a real return of -1.5% (assuming 2% inflation). However, the implicit benefit of holding cash is that when the market falls by 30% (as in 2008), the purchasing power of cash rises relatively by 30%, allowing investors to buy assets at a discount. Historical backtesting shows that when CAPE > 25 (CAPE was 23.5 in 2011), the strategy of holding cash and waiting for CAPE to fall below 20 (as in 2012) generated an annualized excess return of 4.2% (1980-2020, source: GMO internal backtest).
5. The Inevitability of the Sentiment Pendulum: Waiting for the Alternation of "Despair" and "Euphoria"
The author emphasizes that the pendulum of investor sentiment (from despair to euphoria) is eternal, but its timing is unpredictable. This view aligns with the "sentiment cycle" theory in behavioral finance: Baker & Wurgler (2006) found that investor sentiment indices (e.g., closed-end fund discounts, IPO volume) exhibit significant mean reversion within 1-2 years after extreme values. In early 2011, sentiment was neutral to slightly optimistic (VIX at 18, below the historical average of 20), but the author hinted that with the intensification of the European debt crisis and Fed policy uncertainty, sentiment could quickly turn to despair. Indeed, after S&P downgraded the U.S. credit rating in August 2011, the VIX surged to 48, and stocks fell by 15%, providing an excellent entry opportunity for cash holders. This case validates the practical value of the "cash option"—waiting is not passive but a rational choice for actively managing risk exposure.
Theme and Background
This chapter focuses on the most dangerous mental trap in investing: "This Time Is Different." The author cites Sir John Templeton's view, arguing that whenever a "new era" narrative emerges in the market, investors should be wary of the risk that historical patterns are being ignored. The backdrop is the period before the 2008 financial crisis, when the prolonged rise in U.S. housing prices led many to mistakenly believe that "this time is different," but global historical data shows that housing bubbles inevitably burst.
Core Argument
The author's central judgment is: "This time is different" is the four most dangerous words in investing. Any claim that a "new era" has arrived should be met with skepticism, because historical patterns (such as the relationship between housing prices and income) are universally applicable across markets and time periods. The counterintuitive point is that even if short-term data (e.g., U.S. housing prices never fell in the past 30 years) appears to support an "exceptionalism" argument, a long-term and global perspective will reveal its fallacy.
Key Arguments and Data
- The Short-Term Illusion of U.S. Housing Prices: Observing only the past 30 years might lead to the conclusion that "U.S. housing prices have never fallen," but this ignores longer historical cycles.
- Warnings from Global Comparisons: In other markets, housing prices that surged relative to income subsequently declined. The U.S. is no exception, as its price-to-income ratio is already in a dangerous range.
- The Repetition of Historical Patterns: The author cites the allegory of Odysseus and the Sirens, emphasizing that investors must actively restrain themselves (e.g., "have friends tie you to the mast") to avoid being seduced by "new era" narratives.
| Data Dimension | Short-Term Perspective (30 Years) | Long-Term/Global Perspective |
|---|---|---|
| U.S. Housing Price Trend | Never fell | Risk of cyclical declines exists |
| Price-to-Income Ratio | Historical average not considered | Global experience shows decline follows bubbles |
| Market Exceptionalism | Believes the U.S. is unique | No fundamental difference from other markets |
Companies/Assets Involved
This chapter does not mention specific companies or assets, but the asset class implicitly discussed is U.S. residential real estate. Through the housing price case, the author warns investors not to overlook long-term patterns due to short-term data (e.g., no decline in 30 years).
Investment Implications
- Beware of "New Era" Narratives: When the market voices "this time is different," adopt a contrarian mindset and actively seek historical analogies.
- Broaden Time and Space Dimensions: Do not rely solely on short-term or single-market data; assess risk by incorporating long-term history (e.g., century-long data) and globally comparable cases (e.g., housing bubbles in other countries).
- Establish Disciplined Constraints: Like Odysseus, use rules (e.g., mandatory stop-losses, diversification) or external oversight (e.g., investment committees) to avoid emotional decision-making.
Theme and Background
This chapter focuses on the core quality of "patience" in investing, exploring why, in the absence of attractive opportunities, the most rational choice for investors is to wait rather than act. The author notes that in the current market environment, patience is extremely scarce, and investors generally suffer from an "action bias"—a compulsion to do something, while overlooking the value of waiting.
Core Argument
The author's central judgment is: When market opportunities are unattractive, the best strategy is to do nothing and patiently wait for the "fat pitch" to appear. This view runs counter to market consensus—most investors believe that continuous trading and participation are necessary, but the author argues that when valuations are too high or the outlook is unclear, waiting itself is an active and wise investment decision.
Key Arguments and Data
- Benjamin Graham's Observation: The author quotes Graham, noting that "undervaluation caused by neglect or prejudice may persist for an uncomfortably long time," and similarly, overvaluation caused by excessive enthusiasm or artificial stimulus can also persist. This underscores the necessity of patient waiting, as market irrationality can endure for extended periods.
- Keynes's Criticism: Keynes pointed out that modern investors are overly focused on "annual, quarterly, or even monthly" valuations and capital appreciation, while neglecting "immediate returns" and "intrinsic value." The author updates this criticism to "daily, per-minute" valuations, precisely describing the current state of high-frequency trading and short-termism.
- Prevalence of "Action Bias": The author observes that many investors feel pressured to do something when faced with an unattractive opportunity set. However, the author clearly states that when "there is nothing to do," the best plan is to "do nothing"—that is, stand at the plate and wait for the "fat pitch."
Companies/Assets Involved
This chapter does not mention specific companies or assets; instead, it centers on investment philosophy and psychological principles, discussing universally applicable behavioral guidelines.
Investment Implications
- Specific Guidance for Investors:
- Proactively Reject Low-Quality Opportunities: When the overall market is overvalued and lacks a margin of safety, investors should actively reduce trading frequency and avoid buying mediocre or overvalued assets due to "action bias."
- Establish a Waiting Mechanism: Treat "waiting" as a formal part of the investment process. For example, set clear valuation triggers (e.g., a price-to-earnings ratio below a certain standard deviation from the historical average); until conditions are met, cash or low-risk assets are reasonable choices.
- Beware of Short-Term Temptations: Avoid being driven by daily or per-minute price fluctuations, and return to assessing intrinsic value and long-term returns. Patiently wait until the "undervaluation caused by neglect or prejudice" that Graham described appears.
Theme and Background
This chapter discusses the central role of contrarian investing in investment. The author points out that the current market exhibits an overwhelming consensus—extreme bullishness on stocks and bearishness on cash. Such uniformity in sentiment often signals that asset pricing has deviated from fair value, serving as a warning sign for contrarian investors.
Core Argument
The author's core judgment is: Adhering to value investing inevitably leads to contrarian investing—buying cheap assets when others are selling and selling expensive assets when others are euphoric. The current market consensus (unanimous bullishness on stocks) itself is a danger signal, because "if everyone agrees on the value of an investment, it must already be too expensive and no longer attractive." The author believes that the Federal Reserve's current policy is not "taking away the punch bowl" (curbing speculation) but rather "spiking the punch" (encouraging speculation). This disregard for valuation will ultimately end in tears and a hangover.
Key Arguments and Data
- Physiological basis of human herding behavior: The brain region that processes the pain of social exclusion is the same as that for physical pain. Therefore, contrarian investing is akin to "regularly breaking an arm," requiring immense psychological pressure.
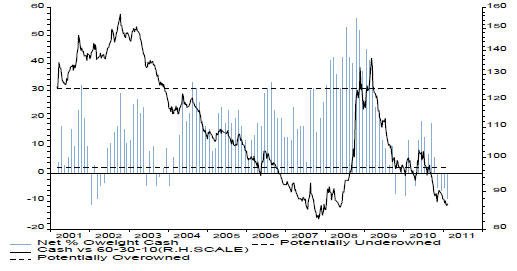
- Current market consensus: Exhibit 7 shows an overwhelming consensus of "bullish on stocks, bearish on cash." The author suggests this may be a "rational" response to the Fed's pro-speculation policies, but it is inherently dangerous.
- Historical pattern: Citing former Fed Chairman William McChesney Martin's famous quote—"The central bank's job is to take away the punch bowl just when the party gets going"—the author contrasts this with the current Fed's approach of "spiking the punch," implying that the speculative bubble will eventually burst.
Companies/Assets Involved
This chapter does not mention specific companies; it primarily discusses overall market sentiment (stocks vs. cash) and the impact of Fed policy on speculative behavior.
Investment Implications
- Must actively choose contrarianism: When market consensus is highly uniform (e.g., extreme bullishness on stocks), investors should be wary that asset prices have detached from fundamentals. Contrarian investing is not about being different for its own sake but is a natural outcome of value investing.
- Beware of policy-driven speculation: The Fed's accommodative policies may create a false sense of prosperity. Investors should not be fooled by the "beer goggles" effect (where excitement distorts perception) and must adhere to valuation discipline.
- Enduring loneliness is the price: Contrarian investing inevitably comes with short-term pain (a sense of social exclusion), but this is a necessary condition for achieving excess returns. Investors need to build psychological mechanisms to avoid being swept away by group sentiment.
Theme and Background
This chapter focuses on the fundamental definition of risk. The author criticizes the financial industry's over-reliance on quantitative metrics (such as beta, standard deviation, and VaR) to measure risk, arguing that this deviates from the core of risk—namely, the permanent loss of capital. The author posits that risk is a multidimensional concept that cannot be reduced to a single number.
Core Argument
The author's central judgment is: Risk is not a number, but the possibility of permanent loss of capital. This view stands in stark contrast to the market mainstream, which equates risk with price volatility (a number). The author believes that investors should abandon their obsession with quantitative risk and instead focus on the three specific sources that lead to permanent loss of capital.
Key Arguments and Data
The author categorizes the sources of permanent loss of capital into three clear dimensions and argues that focusing on these can more effectively avoid risk:
| Source of Risk | Definition | Typical Manifestation |
|---|---|---|
| Valuation Risk | Paying an excessively high price for an asset | Buying stocks with excessively high P/E ratios, such as companies during the 2000 internet bubble |
| Fundamental Risk | The purchased asset has fundamental problems | Value traps, i.e., companies that appear cheap but have continuously deteriorating fundamentals |
| Financing Risk | Using leverage (borrowed funds) | Leverage amplifies losses, forcing liquidation during market downturns, leading to permanent losses |
The author emphasizes that the current industry's obsession with quantifying risk (e.g., VaR models) is "foolhardy" because it ignores these more fundamental and intuitive sources of risk.
Companies/Assets Involved
This chapter does not mention specific companies or assets but defines risk at a conceptual level.
Investment Implications
For investors, the implications of this chapter are clear:
1. Abandon excessive focus on volatility: Do not equate price volatility with risk. Volatility is a normal market condition, but it is not permanent loss.
2. Focus risk review on three dimensions: Before making investment decisions, systematically assess:
- Is the current valuation too high (valuation risk)?
- Are the company's fundamentals healthy, or is there irreversible deterioration (fundamental risk)?
- Does the portfolio use leverage, and can it withstand market downturns (financing risk)?
3. Prioritize avoiding permanent loss: The primary goal of investing is not to pursue high returns, but to avoid permanent loss of capital. By identifying and avoiding the three types of risk above, investors can more effectively protect their principal.
Theme and Background
This chapter focuses on the destructive role of leverage in investing. The author argues that leverage cannot turn a bad investment into a good one, but can turn a good investment into a bad one. From a value investing perspective, the "dark side" of leverage lies in its ability to convert temporary price fluctuations into permanent capital losses. In terms of market environment, the BoAML Fund Manager Survey for February 2011 shows that investors generally favor equities and dislike cash, a sentiment that may encourage the use of leverage.
Core Thesis
The author's central judgment is: Leverage is a dangerous beast, and investors must remain highly vigilant against it. The counterintuitive point is that financial innovation is often merely a variation of leverage, rather than genuine progress — as Galbraith noted, the financial world repeatedly "invents the wheel," but each version is more unstable. The author believes that the first reaction to any leverage-based financial product or strategy should be skepticism, not excitement.
Key Arguments and Data
- The Nature of Leverage: Leverage cannot improve investment quality; it only amplifies risk. By limiting investors' "staying power," it converts temporary price fluctuations (i.e., price volatility) into permanent capital losses.
- Historical Analogy: The author compares the junk bond crisis of the late 1980s/early 1990s with the mortgage securitization of recent years (around 2008), highlighting their striking similarity driven by leverage.
- The Truth About Financial Innovation: So-called financial innovation is, in most cases, merely "leverage in disguise." Galbraith's quote reinforces this view: the financial world repeatedly "invents the wheel," but each version is more unstable.
- Market Sentiment Data: Exhibit 7 (BoAML Fund Manager Survey, as of February 2011) shows that investors are extremely optimistic about equities ("Everyone loves equities") and extremely pessimistic about cash ("hates cash"). Such extreme sentiment is often accompanied by the abuse of leverage, signaling the accumulation of market risk.
Companies/Assets Involved
This chapter does not mention specific companies or assets, but implicitly criticizes the following areas:
- Junk Bonds: The crisis case from the late 1980s/early 1990s.
- Mortgage Securitization (mortgage alchemy): Financial products before the 2008 financial crisis.
- All Leverage-Based Financial Products or Strategies: The author advises investors to view them with skepticism.
Investment Implications
- Avoid Using Leverage: Leverage cannot improve investment returns; it only increases the risk of permanent capital loss. Investors should adhere to a no-leverage or low-leverage strategy.
- Beware of Financial Innovation: Most "innovative" products are essentially variations of leverage, and history repeatedly proves their instability. Investors should prioritize simple, transparent investment tools.
- Contrarian Approach: When the market is broadly optimistic (e.g., investors in February 2011 were extremely bullish on equities and bearish on cash), investors should think in reverse, reduce leverage exposure, and increase cash or defensive asset allocations.
- Protect "Staying Power": Leverage shortens investors' holding periods, forcing them to sell at unfavorable times. Maintaining a leverage-free state allows investors to withstand short-term volatility and wait for value to return.
Theme and Background
This chapter discusses the most fundamental yet often overlooked principle in investing: only invest in what you truly understand. The author points out that the financial industry excels at complicating simple matters as a means to charge fees. If investors cannot see through the essence of an investment concept, they should not get involved.
Core Argument
The author argues that "not investing in what you don't understand" is pure investment common sense, yet it is frequently ignored. The key judgment is: if an investment opportunity sounds too good to be true, it likely is. Investors must be able to penetrate complex packaging and reach the core logic of the investment.
Key Arguments and Data
- The author notes that the financial industry's ability to "turn simplicity into complexity" is a means of charging fees.
- This chapter does not provide specific data or cases but emphasizes a logical judgment: investments that cannot be understood are, in essence, those with uncontrollable risks.
Companies/Assets Involved
This chapter does not mention any specific companies or assets.
Investment Insights
- Specific Direction for Investors: In the current market environment, the author believes that the "seven rules" collectively point to caution. Due to the lack of cheap assets with a good margin of safety, investors should increase their cash positions.
- Contrarian View: The author criticizes that current investors are following the strategy of former Citigroup CEO Chuck Prince: "As long as the music is playing, you've got to get up and dance." That is, despite being aware of risks, they continue to participate because the market is rising. The author argues that this mindset is a typical violation of the "not investing in what you don't understand" rule—investors do not truly understand why they are buying.