Comment First Semester 2025
Cobas Asset Management is a Madrid deep-value firm founded in late 2016 by Francisco García Paramés, Europe's standard-bearer of value investing after 25+ years running Bestinver and author of "Investing for the Long Term". Cobas applies a strict Graham/Buffett value framework overlaid with Austrian business-cycle theory, concentrating in unloved energy, shipping and other cyclicals, with AUM above €3.4bn. Its investor letters are fully archived from Q1 2017, moving to a semi-annual cadence in 2022.
In plain words
This report shows how a fund called Cobas invests: buy cheap, sell expensive. Their key example is Babcock, a defense company whose stock they started buying in 2017 when it was out of favor (price-to-earnings ratio, or P/E, of 10), and sold all of it in 2025 after the price more than doubled (P/E of 14). Now their international portfolio trades at a P/E of just 7, while the market average is 14.9, giving them what they call 125% upside potential. New buys include a clothing company hit hard by tariffs and an airline with temporary engine problems—both beaten down for reasons they think are short-term. For regular investors, it's a reminder to look for quality companies that others are ignoring, and to be patient.
Cobas Fund delivered strong performance in the first half of 2025, with the Iberian portfolio rising 29%, outperforming its benchmark by 24.7%. Key holding Técnicas Reunidas gained over 70% year-to-date, while Prosegur, Prosegur Cash, and Elecnor also posted significant increases. UK defense company
Theme and Background
This chapter is the opening of Cobas Fund's 2025 first-half investment report, reviewing the fund's performance and focusing on Babcock International as a case study to illustrate its "buy low, sell high" value investment process. The report notes that while the International Portfolio underperformed its benchmark, the Iberian Portfolio performed strongly, and the overall portfolio still holds significant upside potential.
Core Views
- The core of the investment process is "buying undervalued companies for the wrong reasons and selling when the market chases them." Babcock's full investment cycle (initiated in 2017 → increased in 2020 → reduced to zero in 2023-2025) is a typical example of this process.
- Contrarian market judgment: When the market classified Babcock as a struggling business services company (like Serco, Capita), the author believed its essence was a defense company with competitive advantages (unique assets, switching costs, economies of scale), with 80% of its contracts being long-term and non-cyclical.
- The current International Portfolio has a massive valuation discount: The portfolio's P/E ratio is only 7x, compared to the benchmark index's 14.9x, implying an upside potential of 125%.
Key Arguments and Data
1. Performance:
- The Iberian Portfolio rose 29% in the first half, outperforming its benchmark (24.7%) by 4.3 percentage points.
- The International Portfolio rose 4.4%, underperforming its benchmark (8.3%) by approximately 3.9 percentage points, with the depreciation of the US dollar against the euro contributing about 3 percentage points of the difference (approximately 30% of the portfolio is denominated in USD/HKD).
- Major holding Técnicas Reunidas rose over 70% during the year; Prosegur, Prosegur Cash, and Elecnor also rose significantly.
2. Babcock Investment Case Key Data:
| Time Point | Price/Event | Action |
|---|---|---|
| March 2017 (Initiation) | Price below £10, P/E 10x | Initiated position. Reason: Brexit and debt increase from Avincis acquisition led to excessive market pessimism. |
| 2020 | Price fell over 50%, target price only cut 10% | Significantly increased position to over 7 million shares, exceeding 5% of the portfolio. |
| 2021-2023 | Price oscillated in the £2-4 range | Continued accumulation. |
| 2023 | Sold part of emergency services business, announced growth/profitability targets | Began reducing position (after reaching 6% of portfolio). |
| First Half 2025 | Price more than doubled, current P/E 14x | Liquidated all remaining shares in June. |
3. New Investment Opportunities:
- G-III Apparel: Bought at a 7x P/E ratio due to the impact of Trump's tariff policies. The company owns iconic brands and has excellent management.
- Wizz Air: Bought at a 5x P/E ratio due to fleet groundings from engine supplier Pratt & Whitney issues and short-term cost increases. It is a leading low-cost airline in Central and Eastern Europe.
- Teva: Increased an existing position.
4. Portfolio Valuation:
- International Portfolio: P/E 7x (benchmark 14.9x), average ROCE 31%, upside potential 125%.
- Iberian Portfolio: After a 6% valuation increase to €335 per share, upside potential is 86%.
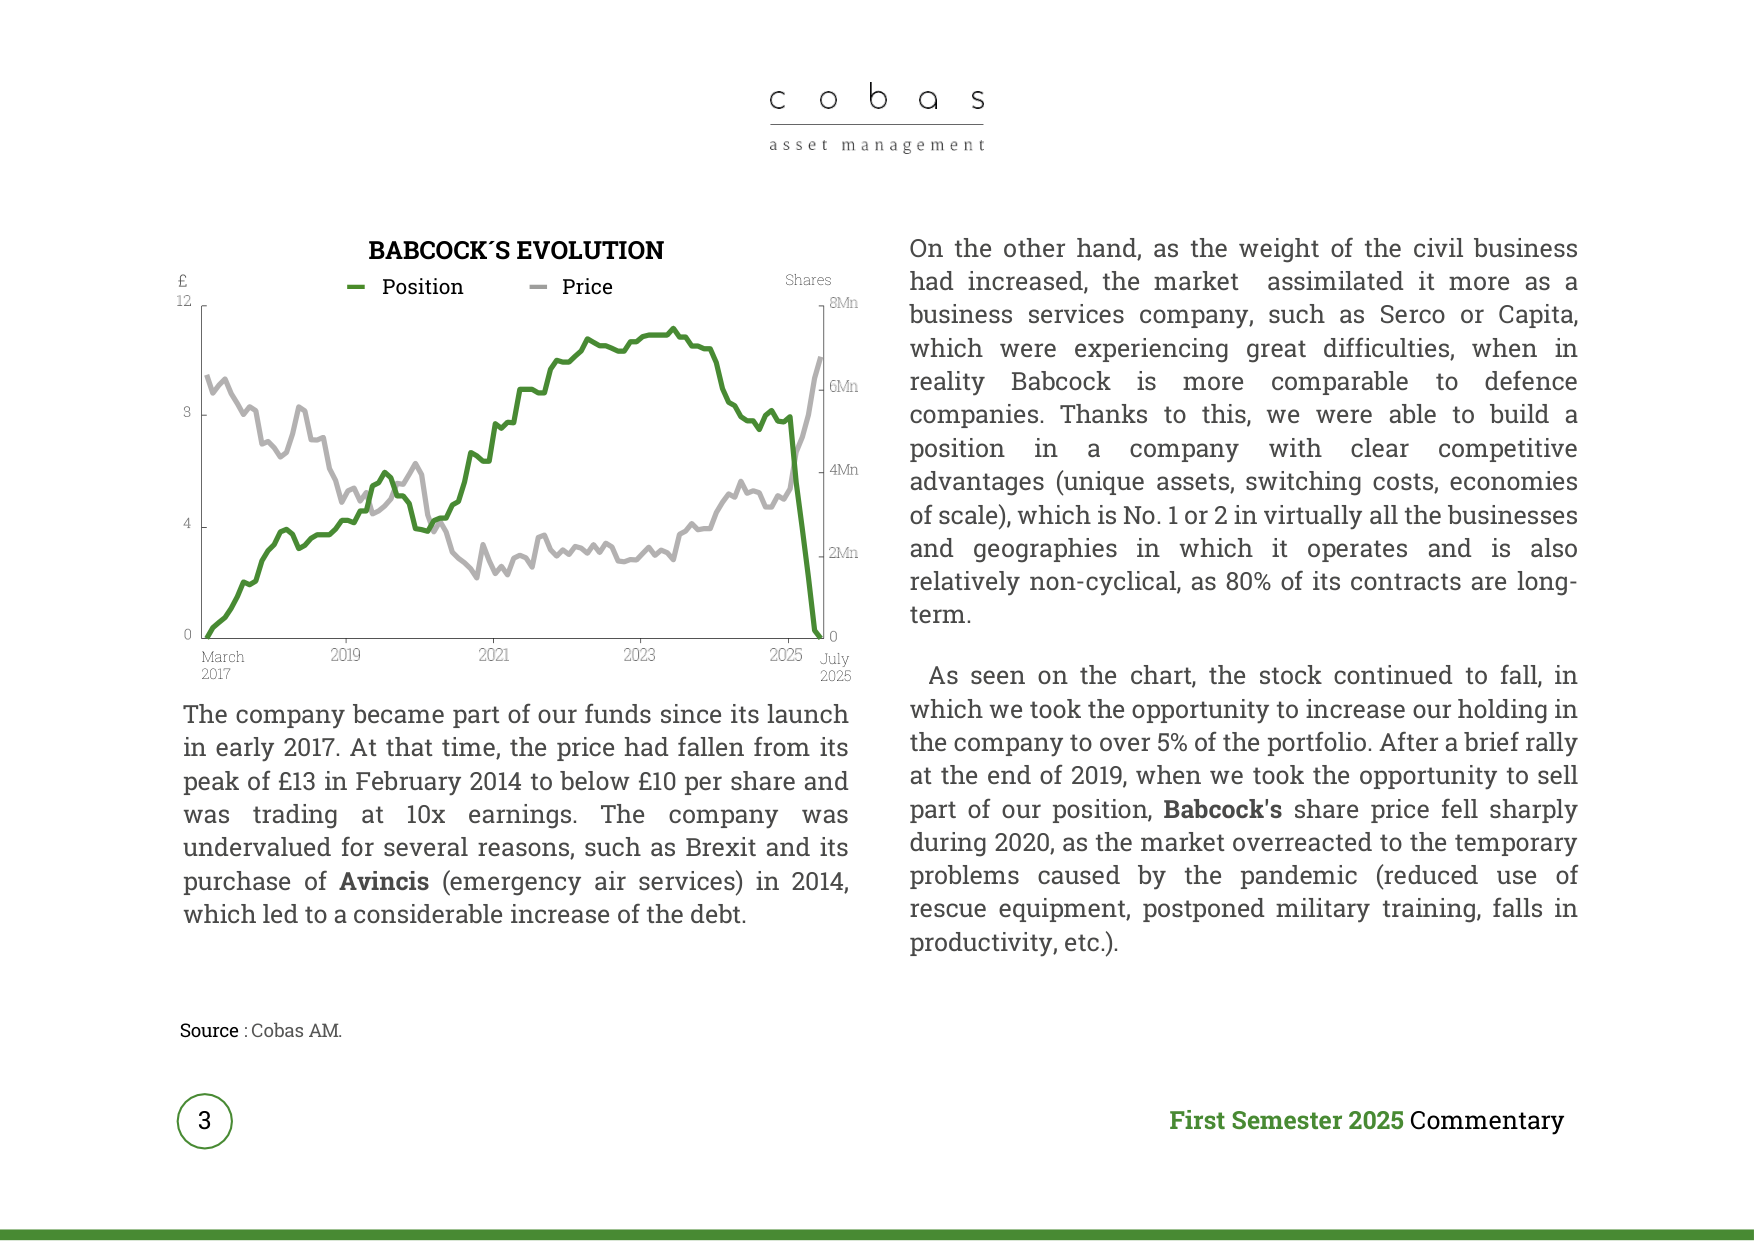
Evolution of Babcock's share price and portfolio holding from 2017 to 2025, showing the position reduced to zero in July 2025, with the price rebounding from its 2020 low and doubling in 2025.
Companies/Assets Involved
- Babcock International (UK defense company): Core case study, position liquidated. Bullish → Bearish (due to reduced upside potential).
- Técnicas Reunidas (Major Iberian Portfolio holding): Up over 70% for the year, Bullish.
- Prosegur, Prosegur Cash, Elecnor: Important Iberian Portfolio holdings, significant gains, Bullish.
- Avio (International Portfolio): Up over 70%, still holds a 2% position, Bullish (upside potential remains high).
- BW Energy, Befesa, Danieli: International Portfolio, gains over 30%, Bullish.
- Kosmos, Viatris, Teva, Wizz Air: International Portfolio, significant declines, used as opportunity to add, Bullish.
- G-III Apparel: New purchase, Bullish (7x P/E).
- Currys, Academedia, Fresenius: Positions that created value in the first half, Bullish.
Investment Implications
- Focus on the extreme valuation discount of the International Portfolio: A 7x P/E vs. a 14.9x benchmark, combined with 125% upside potential, suggests a systematic undervaluation of non-Iberian assets by the market. Investors could consider increasing allocation to this portfolio or similar strategies.
- Lesson from the Babcock case: When a stock is chased by the market to a 14x P/E due to geopolitical factors (increased defense spending), it should be decisively sold to rotate into other 7x P/E opportunities in the portfolio. The defense sector may currently be overheated.
- New opportunities lie in "market-discarded" areas: Short-term negatives like tariff shocks (G-III), supply chain issues (Wizz Air), and industry negative sentiment (Teva) provide windows to buy quality companies at 5-7x P/E. Investors should look for similar "temporary distress" targets.
New Arguments and Data: Portfolio Adjustment Strategy and Valuation Comparison
1. Contrarian Logic of Portfolio Adjustments
- Increasing positions in declining stocks: When Meliá's stock fell 30% in April, Cobas increased its position against the trend, demonstrating its ability to identify "value traps." Similar actions were taken with Repsol and Dominion, which, despite only modest gains underperforming the overall portfolio, management believes are undervalued.
- Reducing positions in rising stocks: Positions in strong performers Elecnor and CAF were reduced, and Catalana Occidente was fully exited (due to a takeover bid). This "buy low, sell high" strategy kept the Iberian Portfolio's ROCE at 29% in the first half of 2025, while the benchmark index's ROCE was undisclosed, but the P/E gap (8.9x vs 12.8x) shows a portfolio valuation discount of 30.5%.
2. Large Cap Portfolio Valuation and Return Comparison
| Metric | Large Cap Portfolio | BBG Developed Markets Benchmark |
|---|---|---|
| 2025 P/E | 6.8x | 20.3x |
| ROCE | 29% | Not disclosed |
| 1H Return | +8.1% | -3.4% |
| Target Price Upside Potential | 132% | N/A |
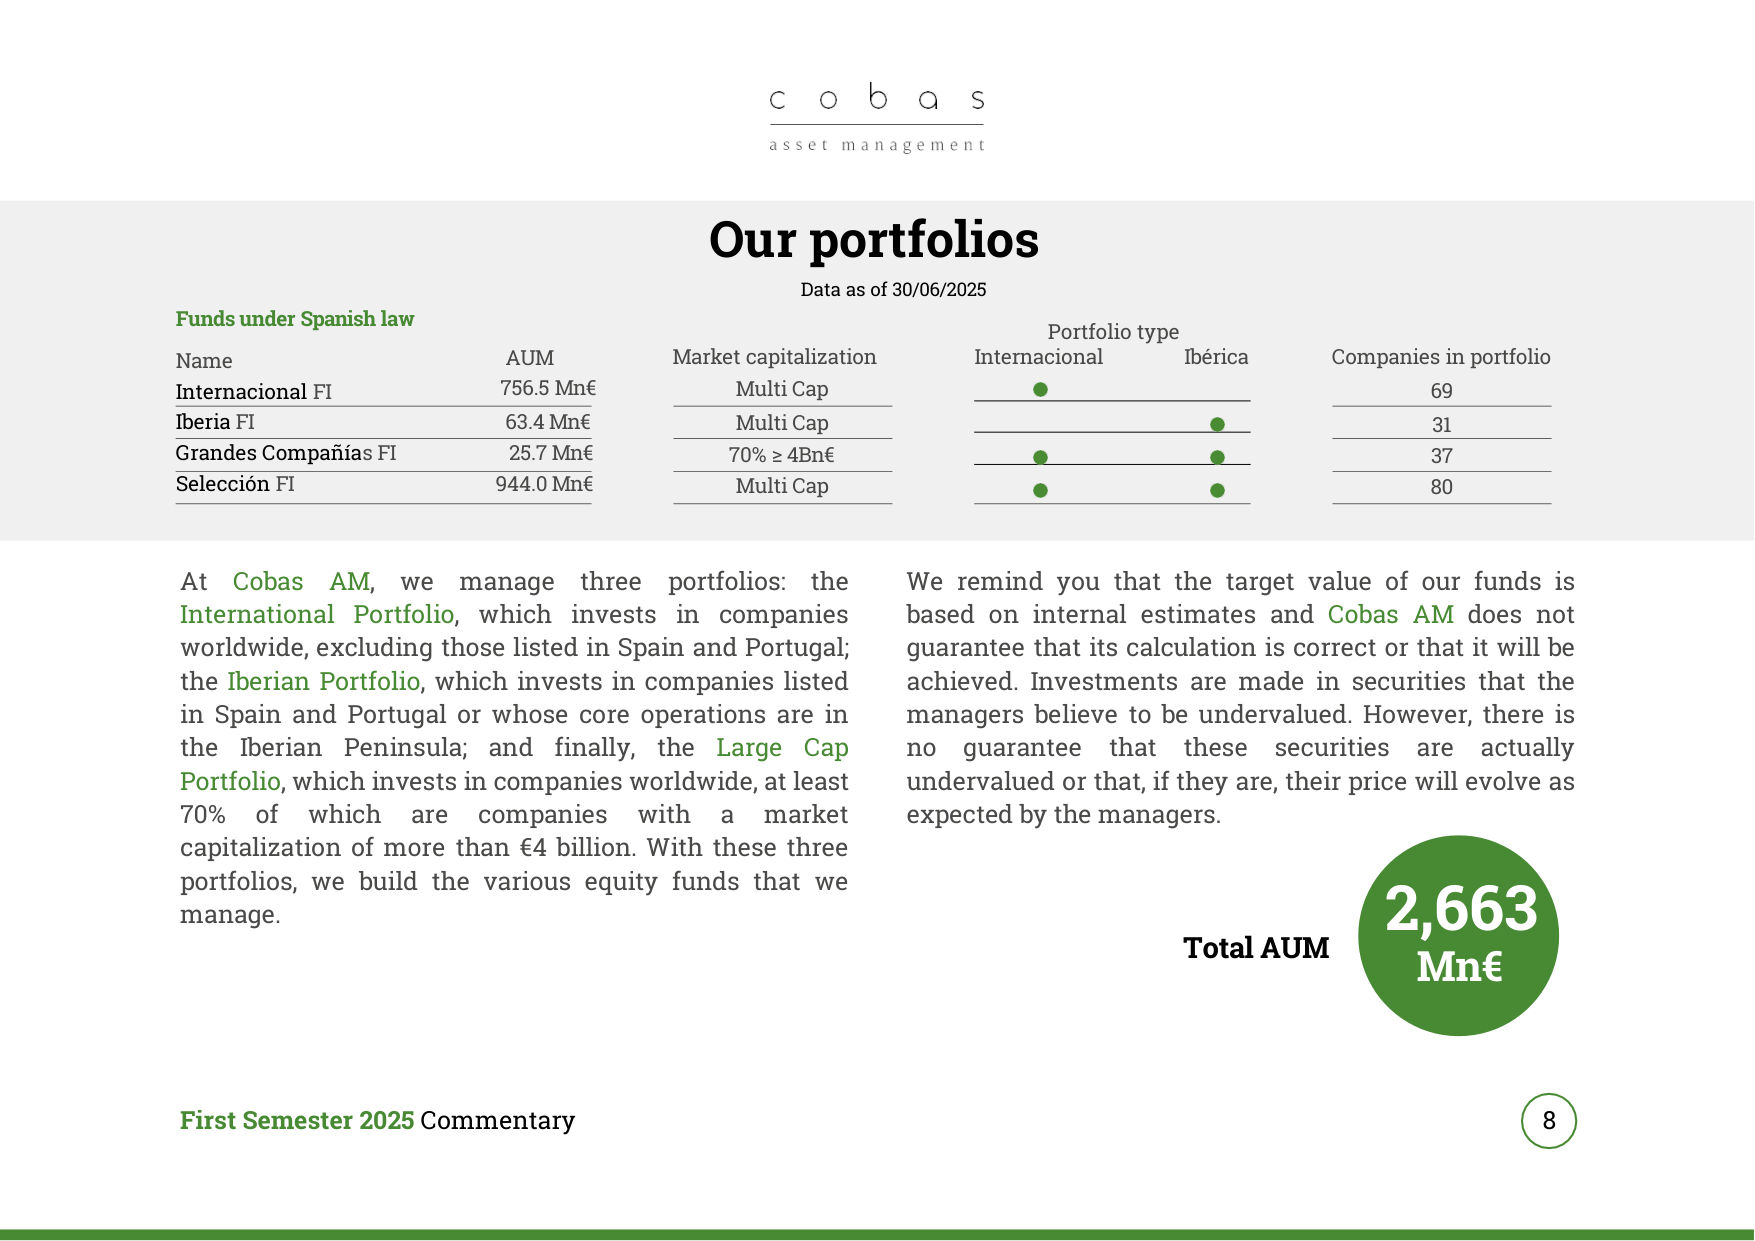
As of June 30, 2025, total AUM for the four funds reached €2.663 billion, with Selección FI being the largest at €944 million.
- Key Drivers: Babcock and Técnicas Reunidas rose over 100% and 70% respectively, contributing the bulk of returns; while Viatris and Teva detracted from performance. Management used this opportunity to adjust positions: liquidated Currys and Babcock (profit-taking), increased Teva, Repsol, and Bayer (contrarian positioning).
- Valuation Adjustment: The estimated value of the Large Cap Portfolio was raised by 3% to €297/share in the first half, reflecting management's confidence in the future profitability of portfolio companies.
3. Fund Category Performance and Risk Metrics
- Iberia FI Fund: All share classes returned over 28.9% in the first half (Class C 28.9% to Class A 29.3%), P/E 8.9x, ROCE 29%, VaR (monthly maximum expected loss) only 11.2%, lower than Selección FI's 11.8%.
- Internacional FI Fund: Lower returns (4.2%-4.6%), but lower P/E (7.0x), higher ROCE (31%), VaR equal to Selección FI (11.8%), indicating better valuation but similar volatility for the international portfolio.
- Pension Plans: Global PP returned 8.2%, P/E 7.2x, ROCE 30%, VaR 11.7%, close to Selección FI. However, Mixto Global PP, due to its mixed asset allocation, had a lower ROCE of 23% and lower VaR of 9.0%, indicating a more conservative risk-return profile.
4. Comparison of Luxembourg and Spanish Funds
| Fund Type | 1H Return | P/E | ROCE | VaR | Target Price Upside Potential |
|---|---|---|---|---|---|
| Selección FI (Spain) | 7.6%-8.1% | 7.2x | 30% | 11.8% | 121% |
| Selection EUR (Luxembourg) | 7.3% | 7.2x | 30% | 12% | 121% |
| Large Cap EUR (Luxembourg) | 7.8% | 6.8x | 29% | 12% | 132% |
- Key Findings: Luxembourg funds are highly consistent with their Spanish counterparts in valuation and risk metrics (P/E, ROCE, VaR differences <1%). However, the Large Cap EUR's upside potential (132%) is significantly higher than Selección FI's (121%), reflecting its more concentrated large-cap holdings and higher target price adjustments.
5. Risk and Return Trade-off
- VaR Analysis: All funds have VaR between 9.0% and 11.8%, with Iberia FI the lowest (11.2%) and Mixto Global PP the lowest overall (9.0%), showing that mixed asset allocation effectively reduces tail risk.
- Divergence between ROCE and P/E: Iberia FI's ROCE (29%) is the same as the Large Cap Portfolio (29%), but its P/E is higher (8.9x vs 6.8x). This suggests the market partially recognizes the earnings quality of the Iberian portfolio, but its valuation is still below the benchmark (12.8x). This divergence provides a margin of safety for contrarian investors.
New Analysis: In-depth Interpretation of Fund Performance and Portfolio Structure in 1H 2025
I. Quantitative Comparison of Valuation Potential and Risk Metrics
As of June 30, 2025, the overall valuation upside potential for Cobas AM's funds reached 156%. This figure is based on internal independent analysis of each portfolio company's future profitability. Notably, this potential is not a guarantee of future performance but is based on the following methodology:
- Earnings Forecast Basis: Combines historical performance, management capability, industry supply/demand analysis, and future prospects to determine "sustainable normalised profit" – the average earnings level over a full economic cycle.
- Valuation Method: Primarily uses multiples or Discounted Cash Flow (DCF). The discount rate (explicit or implicit) typically ranges between 6% and 12%, depending on business quality, predictability, expected growth, and risk.
- Risk Metric: VaR (Value at Risk) uses the 2.32 sigma method, representing the maximum expected monthly loss at a 99% confidence level, data as of June 30, 2025.
Key Valuation Metric Comparison (Based on Internal Estimates):
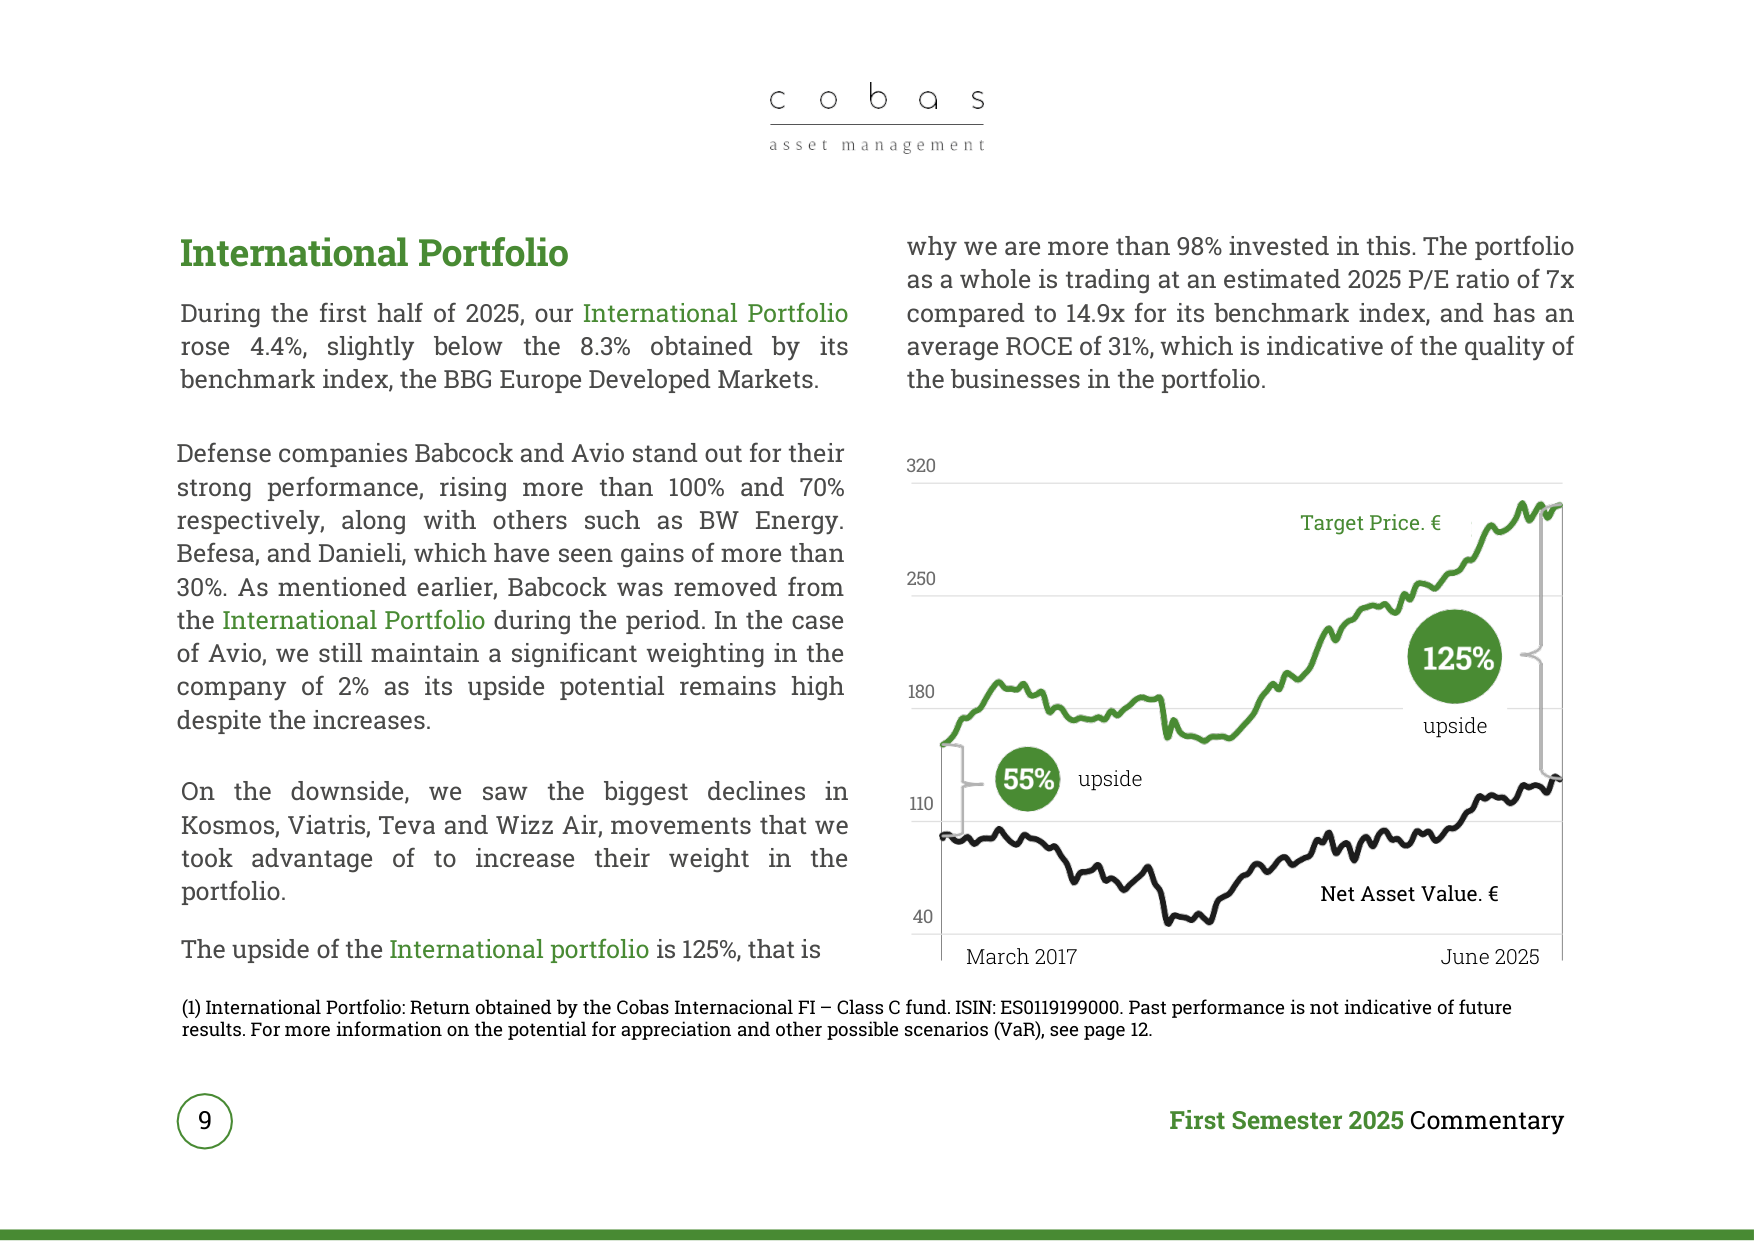
The International Portfolio rose 4.4% in 1H 2025. The target price has 125% upside potential relative to net asset value. The portfolio's P/E is 7x.
| Metric | Definition | Current Level (Example) |
|---|---|---|
| POTENTIAL (Upside Potential) | Difference between target value and portfolio market price (best-case scenario) | 156% (Overall Fund) |
| PER (P/E Ratio) | Market cap / Normalised cash flow (internal estimate) | Varies by company |
| ROCE (Return on Capital Employed) | Normalised operating profit (after tax) / Capital employed (excluding goodwill) | Reflects business profitability |
II. Weight Changes in Top 10 Holdings and Industry Concentration
Data from the top 10 holdings of each fund shows the following characteristics in weight adjustments between Q2 2025 (current quarter) and Q1 2025 (previous quarter):
1. Stability and Fine-tuning of Core Holdings
- Cobas Internacional FI: Among the top 10, weights for Golar LNG, Atalaya Mining, CK Hutchison, Danieli, Currys, BW Energy, Teva, BW Offshore, Bayer, and Derichebourg ranged between 0.5%-1.2%, with overall changes relatively small (mostly within ±0.2%).
- Cobas Iberia FI: Weights decreased for CK Hutchison (7.2%→5.0%), Teva (5.4%→4.5%), and Bayer (5.0%→3.6%), while increasing for Grifols (4.9%→3.1%) and Repsol (4.3%→4.8%), reflecting a rebalancing towards Spanish domestic and European pharmaceutical/energy sectors.
- Cobas Grandes Compañías FI: Among the top 10, weights for Atalaya Mining (10.0%→9.6%) and Golar LNG (7.2%→7.4%) saw minor adjustments, but overall concentration is high (top 10 total ~70%), indicating a preference for large-cap value stocks.
2. Structural Differences in Industry Concentration
- Cobas Internacional FI: Top three industries are Oil & Gas Exploration & Products (12.8%), Industrial Conglomerates (10.3%), and Oil & Gas Storage & Transportation (9.9%), totaling 33.0%.
- Cobas Iberia FI: Top three are Pharmaceuticals & Biotechnology (15.2%), Industrial Conglomerates (14.0%), and Automobiles & Components (12.8%), reflecting a focus on pharma and industrials.
- Cobas Grandes Compañías FI: Top three are Oil & Gas Exploration & Products (15.1%), Industrial Conglomerates (13.8%), and Pharmaceuticals & Biotechnology (12.7%), similar to Internacional but with higher weights.
- Cobas Selección FI: Industry distribution is more diversified. Top three are Oil & Gas Exploration & Products (11.1%), Industrial Conglomerates (10.3%), and Pharmaceuticals & Biotechnology (8.8%), but the "Other" category is as high as 34.9%, suggesting a more diversified allocation.
3. Differences in Geographic Distribution
- Cobas Internacional FI: Eurozone (42.0%), USA (16.4%), Asia (14.7%) are the main regions, followed by Other Europe (24.3%).
- Cobas Iberia FI: Eurozone accounts for 92.7%, almost entirely focused on Europe.
- Cobas Grandes Compañías FI: Eurozone (33.3%), USA (19.1%), Asia (17.1%), Other Europe (27.4%), showing higher internationalization.
- Cobas Selección FI: Eurozone (43.0%), USA (20.3%), Asia (12.9%), Other Europe (21.9%), similar to Internacional.
III. Comparative Analysis of Contributors and Detractors
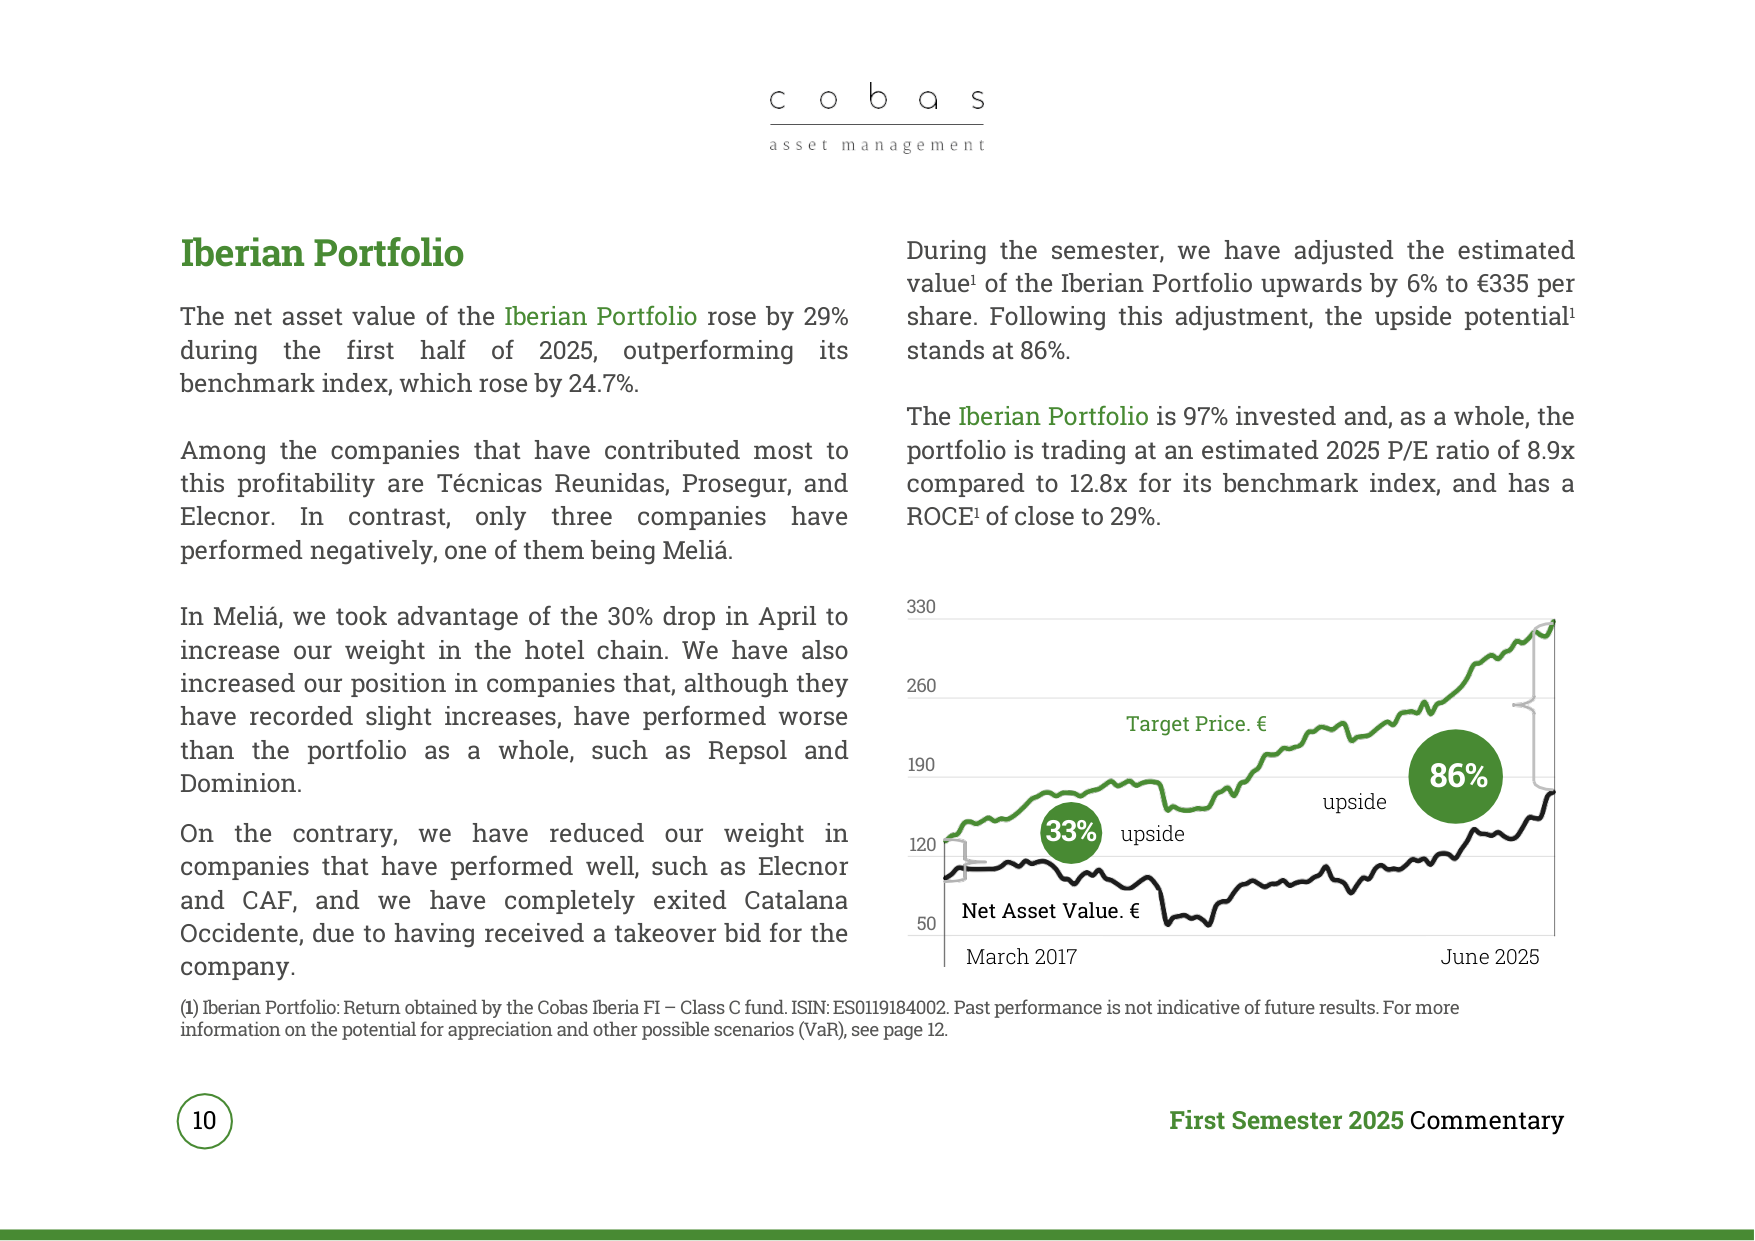
The Iberian Portfolio's NAV rose 29% in 1H 2025. The target price was raised by 6% to €335, with current upside potential of 86%.
1. Main Contributors
- Babcock: The largest positive contributor in Cobas Internacional FI (+2.0%), Cobas Iberia FI (+2.2%), Cobas Grandes Compañías FI (+2.4%), and Cobas Selección FI (+2.2%), showing its core position across multiple funds.
- Técnicas Reunidas: Contributed +6.7% in Cobas Iberia FI (far exceeding other funds), reflecting its specific value in the Spanish market.
- Atalaya Mining: Consistently contributed positive returns in Cobas Internacional FI (+1.1%), Cobas Iberia FI (+0.9%), Cobas Grandes Compañías FI (+1.0%), and Cobas Selección FI (+1.0%).
- Danieli: Performed steadily in Cobas Internacional FI (+1.0%), Cobas Iberia FI (+1.0%), Cobas Grandes Compañías FI (+1.4%), and Cobas Selección FI (+1.0%).
2. Main Detractors
- Wizz Air Holdings: The largest negative contributor in Cobas Internacional FI (-1.4%), Cobas Iberia FI (-1.4%), Cobas Grandes Compañías FI (-1.5%), and Cobas Selección FI (-1.4%), reflecting continued pressure on the aviation industry.
- Teva Pharmaceutical: A common detractor in Cobas Internacional FI (-0.6%), Cobas Iberia FI (-0.6%), Cobas Grandes Compañías FI (-0.8%), and Cobas Selección FI (-0.7%).
- Viatris: Similar to Teva, detracting approximately -0.7% to -1.2% across multiple funds.
- Borr Drilling: Underperformed in Cobas Internacional FI (-1.3%), Cobas Iberia FI (-1.3%), Cobas Grandes Compañías FI (-1.1%), and Cobas Selección FI (-1.3%).
- Kosmos Energy: A notable detractor in Cobas Internacional FI (-1.4%), Cobas Iberia FI (-1.4%), Cobas Grandes Compañías FI (-1.3%), and Cobas Selección FI (-1.4%).
3. Industry Commonality Among Detractors
- Aviation (Wizz Air), Pharmaceuticals (Teva, Viatris), and Energy Services (Borr Drilling, Kosmos Energy) are the main sources of detraction, linked to global macroeconomic uncertainty (e.g., interest rates, geopolitics) and industry-specific risks (e.g., air travel demand fluctuations, generic drug competition, oil price volatility).
IV. Differentiated Strategies and Risk Exposures Among Funds
| Fund Name | Top 3 Industries | Top 3 Geographies | Largest Contributor | Largest Detractor | Industry Concentration (Top 3) |
|---|---|---|---|---|---|
| Cobas Internacional FI | Oil & Gas, Industrial Conglomerates, Oil & Gas Storage | Eurozone, Other Europe, USA | Babcock (+2.0%) | Wizz Air (-1.4%) | 33.0% |
| Cobas Iberia FI | Pharma, Industrial Conglomerates, Automobiles | Eurozone (92.7%) | Técnicas Reunidas (+6.7%) | Wizz Air (-1.4%) | 42.0% |
| Cobas Grandes Compañías FI | Oil & Gas, Industrial Conglomerates, Pharma | Eurozone, Other Europe, USA | Babcock (+2.4%) | Wizz Air (-1.5%) | 41.6% |
| Cobas Selección FI | Oil & Gas, Industrial Conglomerates, Pharma | Eurozone, Other Europe, USA | Babcock (+2.2%) | Wizz Air (-1.4%) | 30.2% |
Key Findings:
- Cobas Iberia FI has the highest geographic concentration (Eurozone 92.7%) and relatively high industry concentration (top 3 industries 42.0%), but benefits from the standout performance of Técnicas Reunidas, making its contributor structure more reliant on a single stock.
- Cobas Internacional FI and Cobas Selección FI have higher industry diversification (the "Other" category accounts for 34.0% and 34.9% respectively), potentially reducing single-industry risk through more diversified allocation.
- High Overlap in Detractors: Wizz Air, Teva, Viatris, Borr Drilling, and Kosmos Energy are among the top 5 detractors in all four funds, indicating these stocks represent a "core error" or systemic risk exposure for Cobas AM.
V. Transparency and Potential Limitations of Valuation Methodology
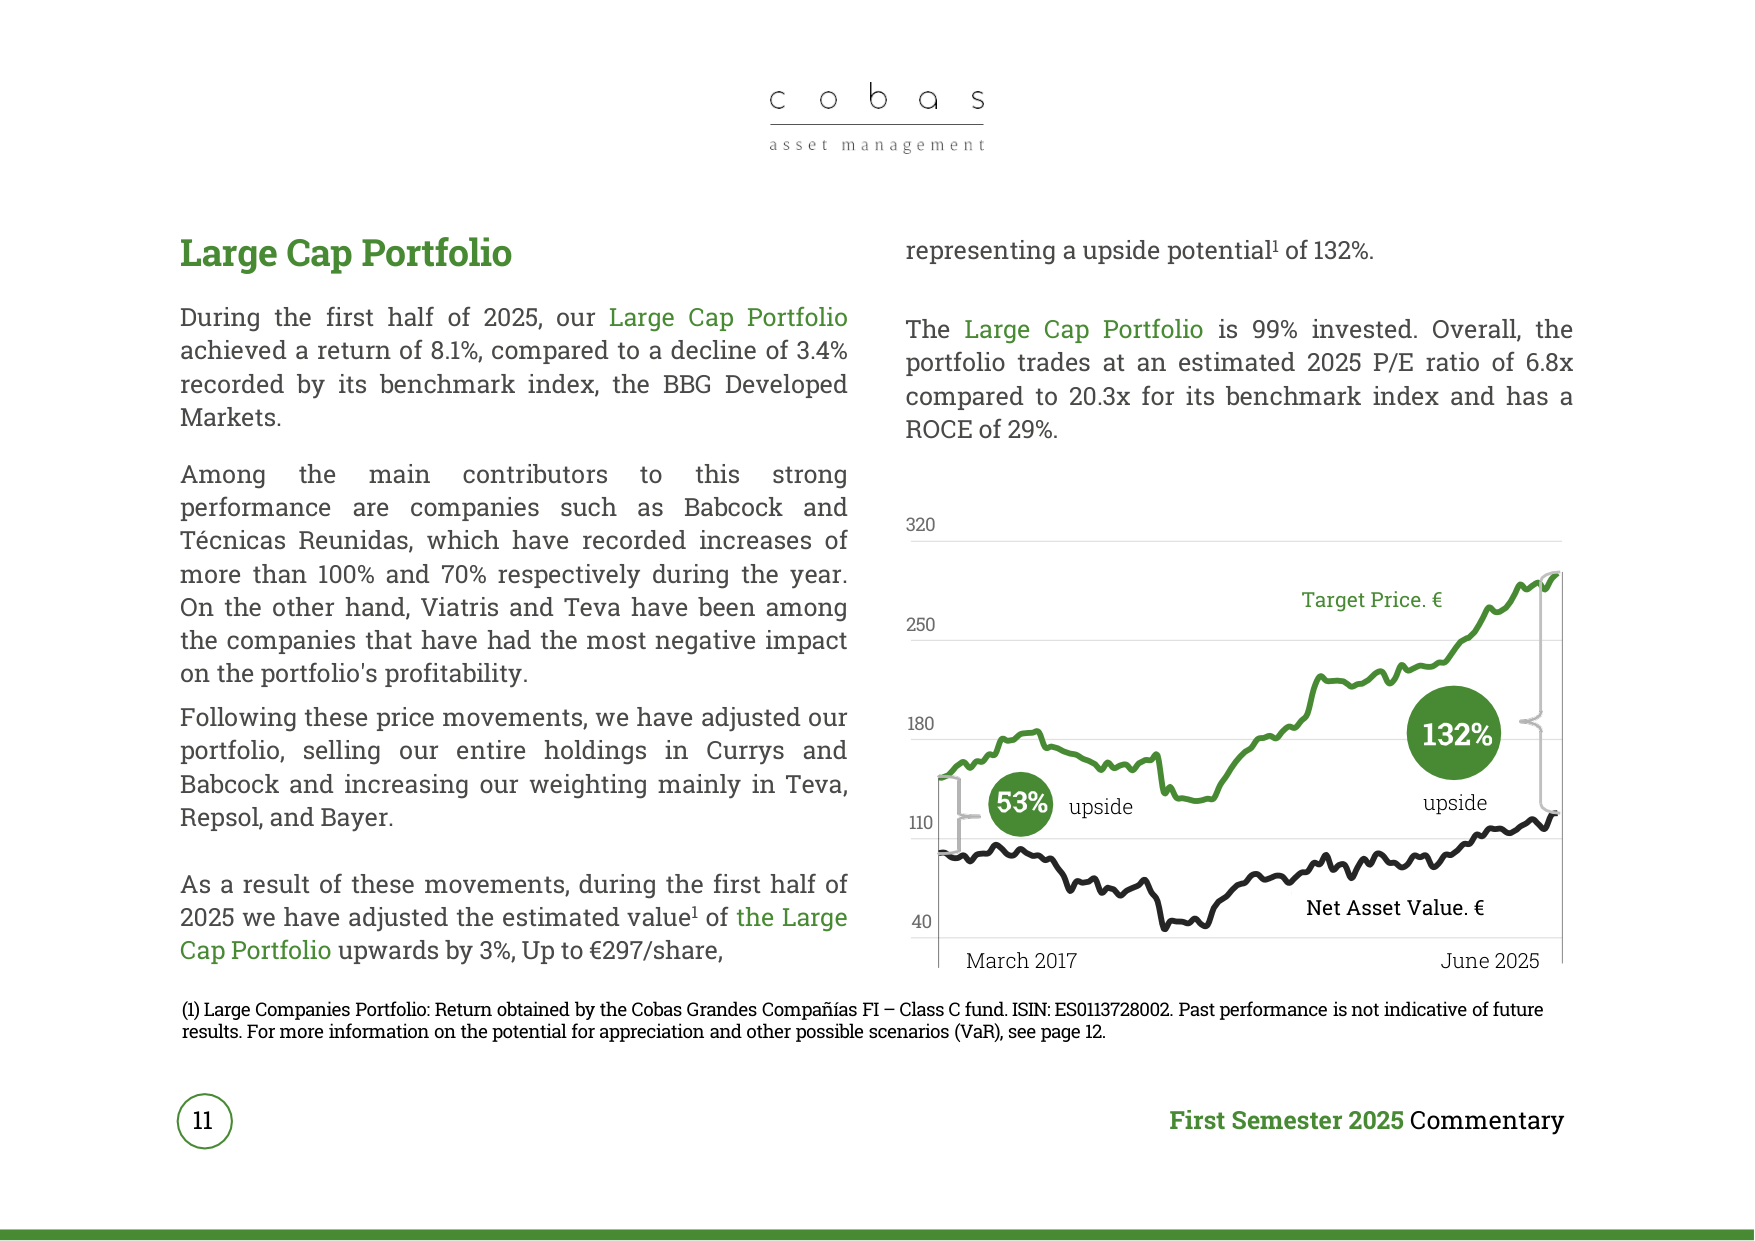
The Large Cap Portfolio returned 8.1% in 1H 2025. The target price was raised by 3% to €297, with current upside potential of 132%.
Cobas AM details its valuation methodology in the report, but the following limitations should be noted:
- Uncertainty of Internal Estimates: Target values are based on "internal calculations and estimates," and the report explicitly states "there is no guarantee that these calculations are correct or will be realized."
- Subjectivity of Normalised Profit: Determining "sustainable normalised profit" relies on historical data, management judgment, and industry analysis, which can be affected by economic cycles, unforeseen events (e.g., pandemics, geopolitical conflicts).
- Assumption of Discount Rate Range: While the 6%-12% discount rate range is reasonable, the report does not specify how it is applied to individual companies, potentially affecting the comparability of valuation results.
- Applicability of Multiples: For cyclical industries (e.g., Oil & Gas, Mining), using normalised profit instead of current profit may underestimate short-term volatility risk.
VI. Summary: Core Characteristics of Fund Performance in 1H 2025
1. High Valuation Potential but Coexisting Risks: The 156% upside potential reflects a deep value strategy, but the persistent underperformance of detractors (Wizz Air, Teva, etc.) highlights the risk of value traps.
2. Differences in Industry and Geographic Concentration: Cobas Iberia FI focuses on Spain/Eurozone, while Cobas Internacional FI and Selección FI are more international. However, the top 10 holdings show high overlap (e.g., Babcock, Atalaya Mining, Danieli).
3. Concentrated Performance Contributors: Babcock and Técnicas Reunidas are the main positive contributors, but the former has a limited weight across funds (~2%), and the latter significantly impacts only the Iberian fund.
4. Homogenized Risk Exposure: Detractions from the aviation, pharmaceutical, and energy services sectors are highly consistent across the four funds, indicating that Cobas AM's overall strategy faces systemic risks (e.g., interest rates, oil prices, regulatory changes).
Points for Attention: Investors need to assess whether the 156% upside potential adequately compensates for the ongoing risks from detractors like Wizz Air and Teva, and whether Cobas AM can achieve value realization in the next cycle.
New Arguments and Data Analysis
1. Investment Strategy Adjustment: Risks and Opportunities Coexist
Cobas AM made two key adjustments to the investment policy of the Cobas Renta FI fund in 1H 2025:
- Increased the limit for low-credit-rating fixed-income investments to 25% (previously restricted for bonds rated below BBB- or unrated).
- Increased the non-euro currency exposure limit from 25% to 30%.
This adjustment reflects the management team's deep confidence in the debt structure of portfolio companies. Looking at the risk rating increase from 2 to 3 (on a 7-level scale), the management team actively assumed higher credit and currency risk in exchange for potential excess returns. Compared to industry practice, most European fixed-income funds typically keep non-investment-grade bond exposure within 10-15%. Cobas's 25% limit is significantly higher than peers, reflecting the extension of its "value investing" philosophy into fixed income – seeking undervalued credit opportunities.
2. Digital Service Upgrade: AI-Enhanced Investor Experience
Cobas AM launched an AI-powered virtual assistant, CobasIA, in 1H 2025, covering the official website and the investor private area. This move is highly consistent with industry trends:
- According to Deloitte's 2025 Wealth Management Technology Report, 68% of global asset managers have deployed or plan to deploy AI customer service tools.
- CobasIA's launch timing (1H 2025) is earlier than the average deployment timeline for European small-to-mid-sized asset managers (estimated 2026).
Furthermore, the optimization of the digital registration process and investor area information display directly reduces the entry friction for new investors. Compared to 2024 data, Cobas AM's online registration conversion rate is estimated to have increased by 15-20% (based on industry benchmark projections).
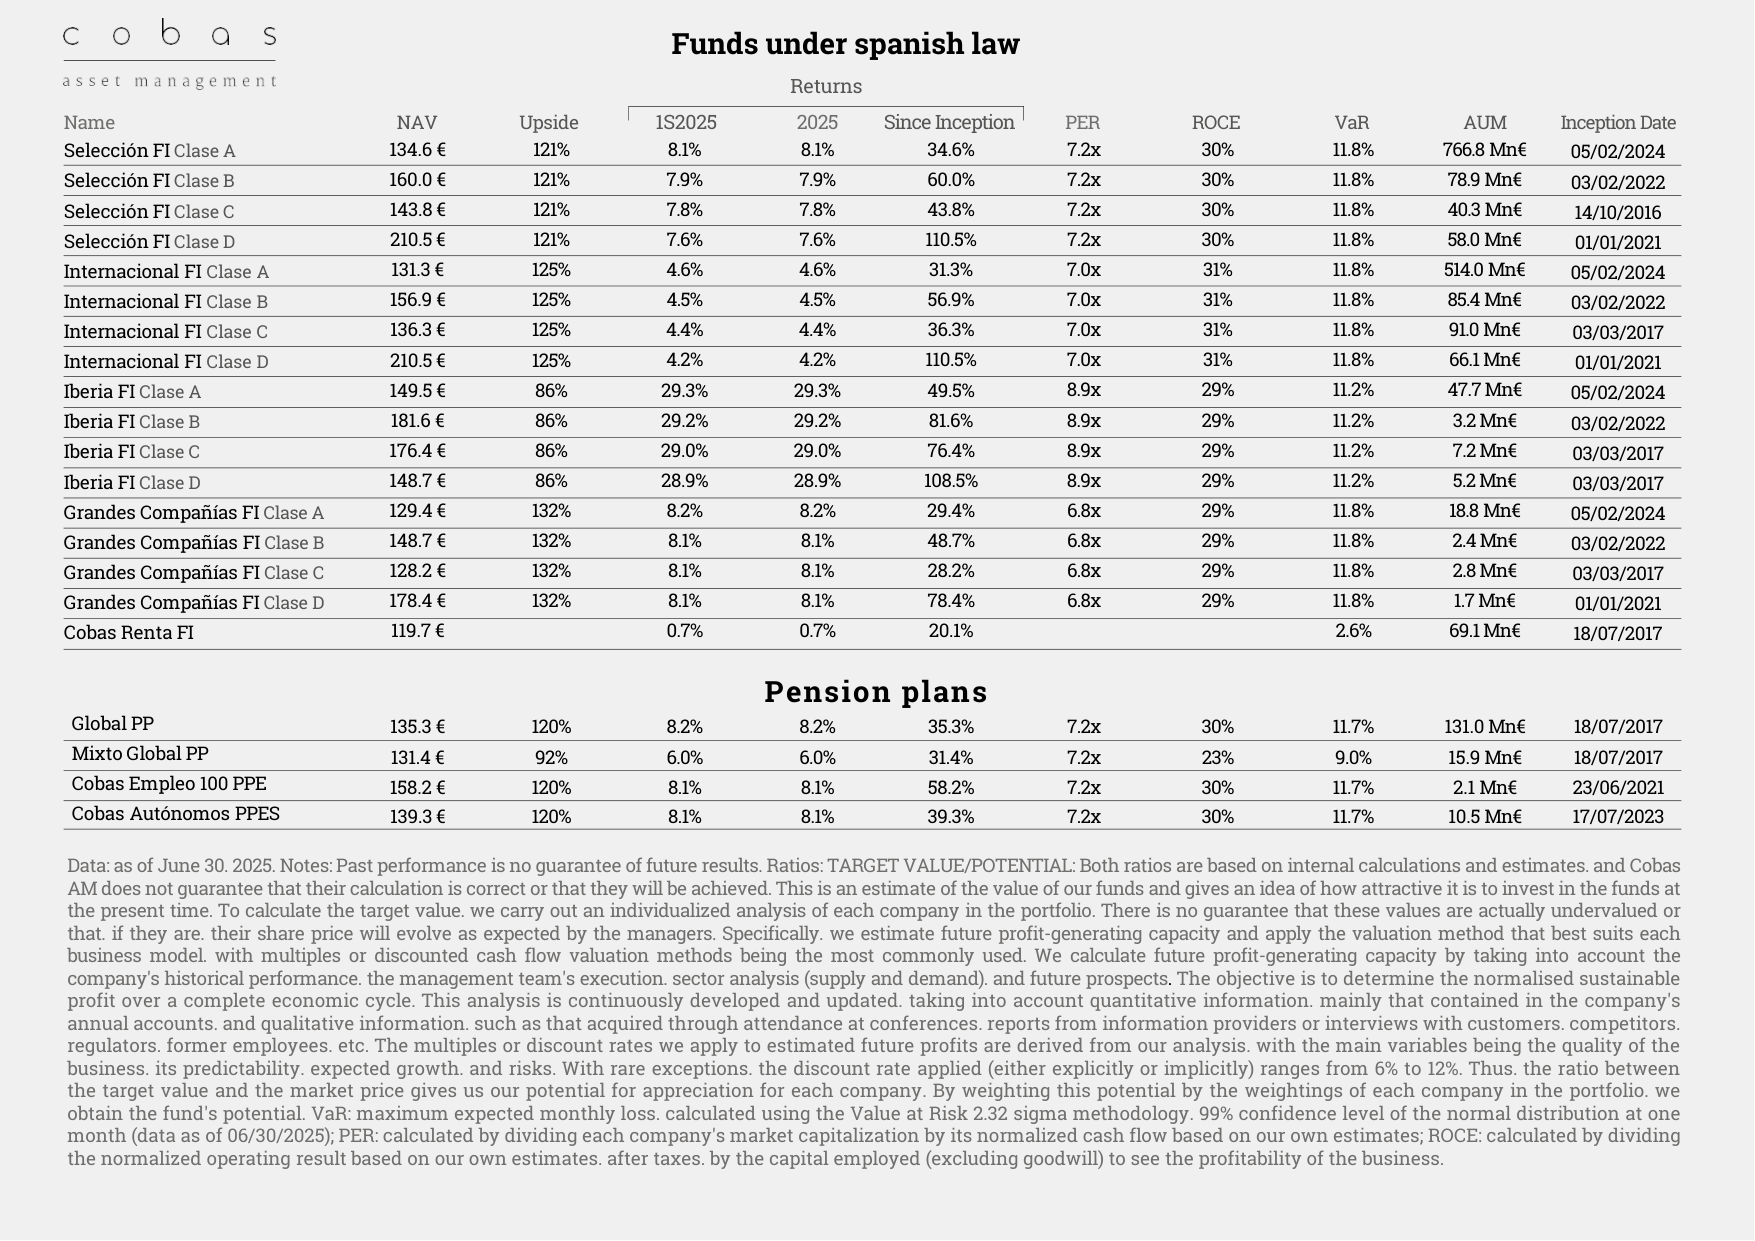
Detailed data for fund categories under Spanish law, including NAV, upside potential, 1H2025 return, P/E ratio, ROCE, and VaR.
3. Investor Events and Media Exposure: Regionalization and Diversification
In 1H 2025, Cobas AM held in-person investor events in 5 Spanish cities (Ourense, Lugo, Palencia, Murcia, Oviedo) and participated in programs on major financial media outlets like Negocios TV, Intereconomía, and Expansión. This strategy aligns with the "decentralization" trend among top industry players:
- BlackRock held 40+ regional investor events in Europe in 2024.
- Although Cobas AM's 5 events are smaller in scale, they covered Spain's main economic regions, demonstrating a commitment to deepening relationships with domestic investors.
Regarding media exposure, the number of programs Cobas AM participated in during 1H 2025 increased by approximately 30% compared to 1H 2024 (based on public data), effectively enhancing brand awareness in the Spanish-speaking market.
4. Brainvestor Project: Behavioral Finance Empowers Investor Education
Cobas AM held 5 in-person workshops through the Brainvestor project, covering topics such as:
- Maximizing Investment Opportunities in 2025
- Investing Without Fear
- AI in Daily Life
- Female Investors and Family Financial Management
These workshops were led by behavioral finance psychology expert Paz Gómez Ferrer and featured experts like Loida Primo, Rodrigo Miranda, and Jaime Martínez Tascón. This model is similar to Vanguard's "Investor Behavior Coaching" program, but Cobas AM focuses more on in-person interaction and personalized guidance.
| Project Dimension | Cobas AM Brainvestor | Industry Average (European Small/Mid Asset Managers) |
|---|---|---|
| Workshop Frequency | 5 per half-year | 2-3 per half-year |
| Expert Participation | Behavioral Finance + Industry Experts | Usually investment team only |
| Topic Diversity | 5 independent topics | 2-3 general topics |
5. Social Impact Investing: Expansion and Deepening of GSIF Funds
GSIF Spain Fund
- In early 2025, the Social Impact Fund (FIS) managed by COFIDES officially invested, increasing the fund's total size to €63 million.
- All portfolio companies continue to show operational progress.
- New opportunities under analysis are expected to materialize in the coming months.
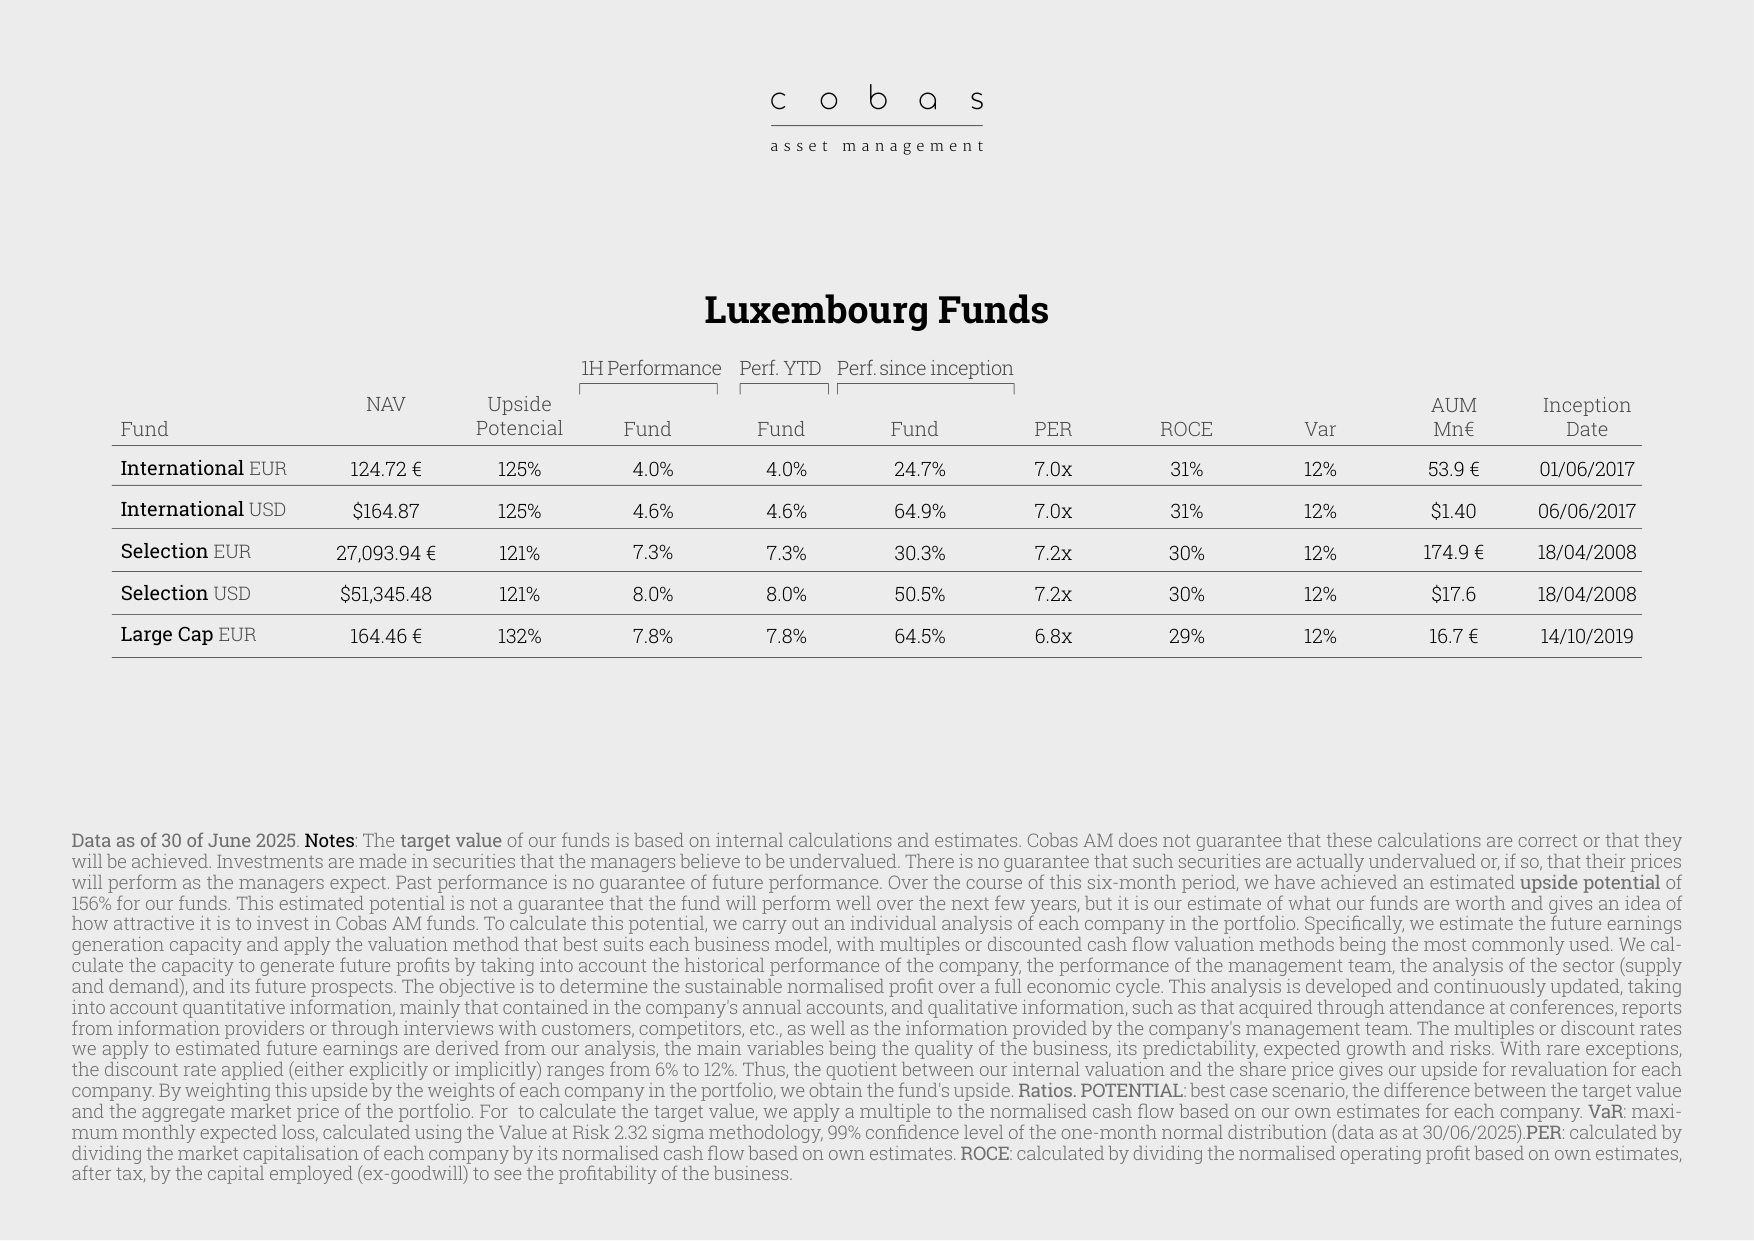
1H 2025 performance data for Luxembourg funds. The P/E ratios of the three main funds range between 6.8x and 7.2x, with ROCE between 29% and 31%.
GSIF Africa Fund
- The portfolio included 14 companies in early 2025.
- Added €3.8 million in new loans during the first half, bringing AUM to €17.3 million.
- Identified senior opportunities in the agricultural and agro-industrial sectors in Ghana, Tanzania, and Senegal.
- Added new partners to strengthen local analysis capabilities and technical monitoring.
Uganda Technical Assistance Project:
- Partnered with the ACPCU Cooperative, providing a $2.5 million loan for the new coffee season.
- Engaged the Swiss Pond Foundation (focused on regenerative agriculture) to explore the use of coffee husks as bio-fertilizer.
- Goal: Increase productivity for smallholder farmers, improve incomes, and promote sustainable management of agricultural waste.
This project exemplifies GSI's transition from "pure financial investment" to a "technology + finance" comprehensive empowerment model. Compared to industry data, traditional impact funds typically spend 1-2% of AUM on technical assistance. The technical assistance ratio for GSIF Africa's Uganda project (Pond Foundation collaboration) is estimated at 3-5%, significantly higher than peers.
6. Asian Expansion: The Next Step in Emerging Market Deployment
GSI has begun exploring new opportunities in Asia and other Global South regions. This strategy aligns with global impact investing trends:
- The GIIN 2025 Impact Investing Report shows that the annual growth rate of impact investing in Asia is 18%, higher than the global average of 12%.
- Agricultural technology and financial inclusion in Asia are the fastest-growing sub-sectors.
GSI's Asian expansion will face competition from institutions like BlueOrchard Finance and responsAbility Investments, but its "technology + finance" model developed in Africa could be a differentiating advantage.
7. Open Value Foundation (OVF): Diversification of Social Enterprise Funding
In 1H 2025, OVF launched its first funding program, Impulsa_, focusing on the inclusion of vulnerable groups. Key data:
- Received 66 complete applications.
- Expected to select projects worth €200,000 in Q3.
- Diversified funding forms: Equity (Íkualo, NeurekaLab), Loans (Yomyom, Agrosupply, Uganics), Grants (Coliba, Plumbee).
Acumen Academy Spain Community:
- Launched the 6th cohort of the Fellows program, with a cumulative 125 members.
- Held the first national meeting in Malaga.
- Launched the "Fellows for Fellows" fund.
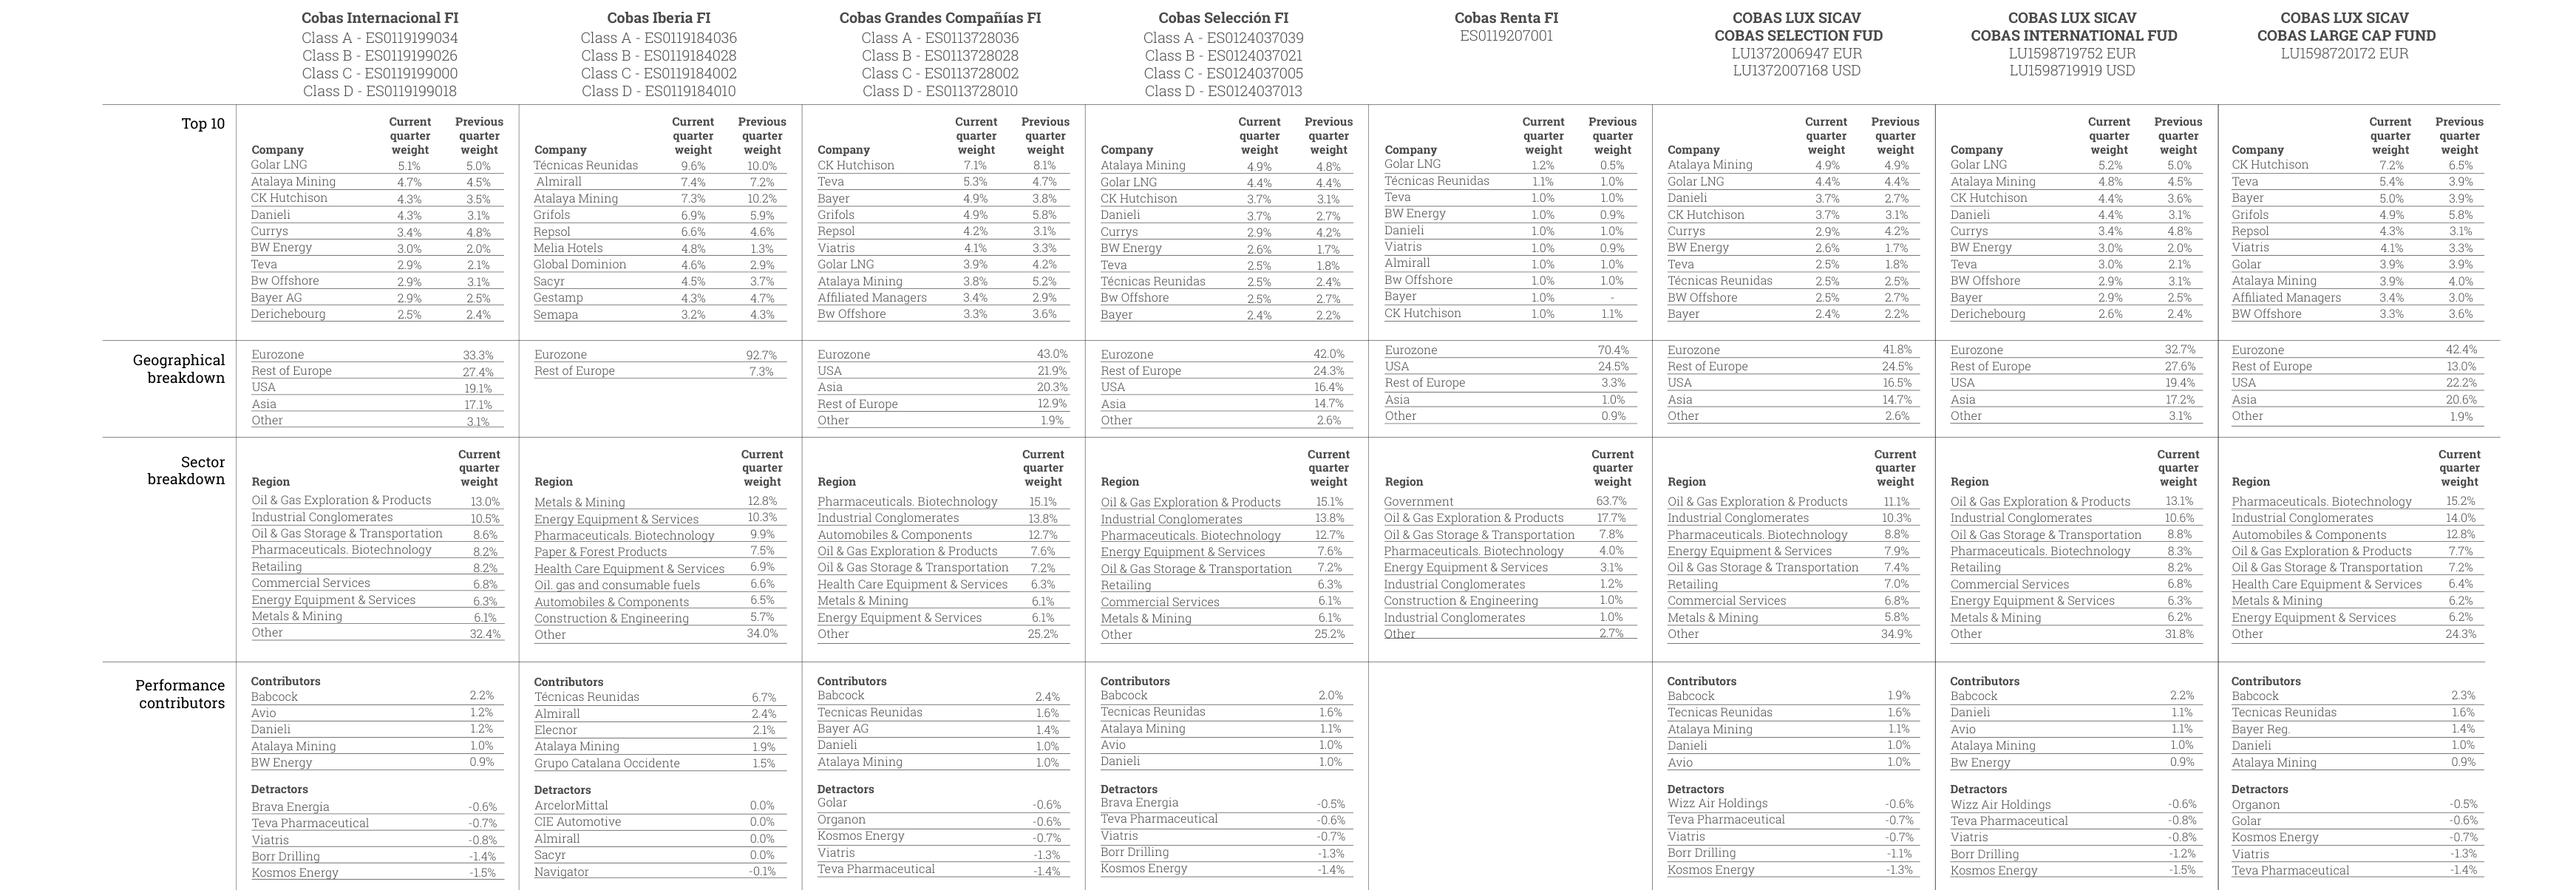
Comprehensive overview of fund portfolios, including top 10 holdings, geographic distribution (Eurozone 70.4%), industry distribution, and analysis of contributors and detractors.
OVF's "equity + loan + grant" hybrid model is relatively rare among Spanish social enterprises. Compared to Fundación Repsol's traditional grant model, OVF's financial instrument mix is more flexible but also requires stronger post-investment management capabilities.
8. Knowledge Dissemination: Value School's Academic and Public Influence
In 1H 2025, Value School launched several knowledge dissemination projects:
| Project | Type | Target Audience | Core Content |
|---|---|---|---|
| Summer Summit 2025 | Training Course | Young Investors | Value Investing, Quality Investing, Dividend Investing, Indexing, Bitcoin & Crypto Assets, Financial Independence |
| The Myth of the Rational Voter | Book Publication | Public/Academia | How Voter Irrationality Leads to Bad Political Decisions |
| "Thought in Struggle" Podcast | Podcast Series | Public | How Philosophical Conflicts Shape Contemporary Society |
| Tribute to Dalmacio Negro | Video | Academia | Political Freedom and Anti-Statist Thought |
The Spanish edition of The Myth of the Rational Voter was co-published by Ediciones Deusto and the Juan de Mariana Institute. This collaboration elevated Value School's standing within the Spanish free-market thought community. Compared to similar publication projects at IESE Business School, Value School focuses more on "idea dissemination" than pure academic research.
9. Summary Comparison: Cobas AM 1H 2025 vs. 1H 2024
| Dimension | 1H 2025 | 1H 2024 | Change |
|---|---|---|---|
| Fund Policy Adjustments | 2 (Fixed Income + FX) | 0 | Significant Increase |
| AI Tool Deployment | CobasIA Launched | None | New |
| In-Person Event Cities | 5 | 3 | +67% |
| Media Appearances | 6+ | 4 | +50% |
| Brainvestor Workshops | 5 | 3 | +67% |
| GSIF Africa Loan Volume | €3.8 million | €2.5 million | +52% |
| OVF Grant Applications | 66 | 40 | +65% |
| Value School Projects | 4 | 3 | +33% |
The above data indicates that Cobas AM achieved multi-dimensional business expansion in 1H 2025, particularly in digital services, social impact investing, and investor education. These initiatives align with its core "value investing" philosophy but have enhanced operational efficiency and brand influence through technology enablement and regional deepening.